Texas Manufacturing Outlook Survey

Texas manufacturing activity weakens, employment growth slows
For this month’s survey, Texas business executives were asked supplemental questions on wages, prices and the impact of the recent heat wave. Results for these questions from the Texas Manufacturing Outlook Survey, Texas Service Sector Outlook Survey and Texas Retail Outlook Survey have been released together. Read the special questions results.
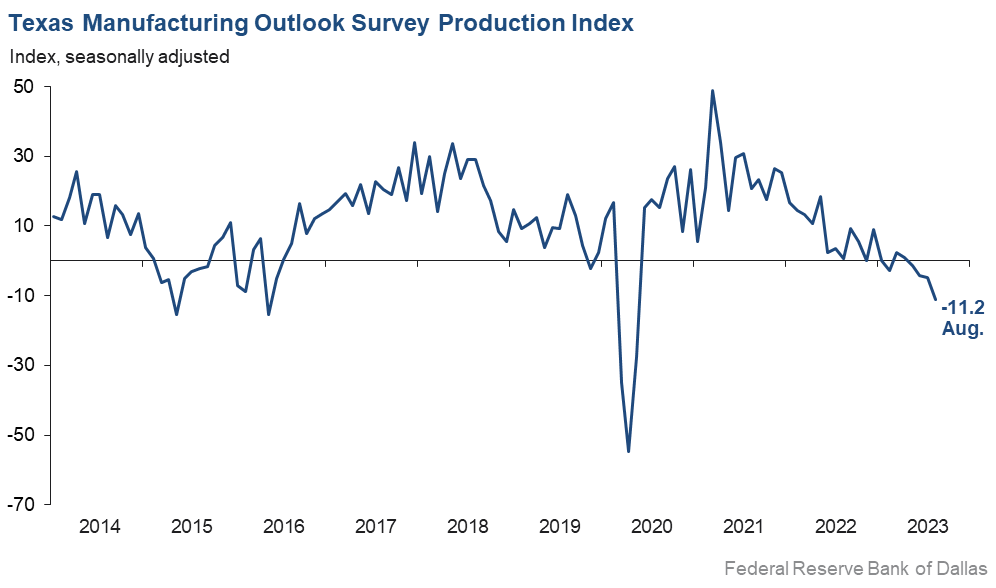
Texas factory activity contracted again in August, according to business executives responding to the Texas Manufacturing Outlook Survey. The production index, a key measure of state manufacturing conditions, fell six points to -11.2—its lowest level since May 2020.
Other measures of manufacturing activity also indicated contraction in August. The new orders index has been in negative territory for more than a year and posted a reading of -15.8, up slightly from July. The capacity utilization index edged down to -3.7, and the shipments index dropped 14 points to -15.8. The capital expenditures index dropped to -8.6, a three-year low.
Perceptions of broader business conditions continued to worsen in August. The general business activity index stayed negative but ticked up to -17.2, while the company outlook index was largely unchanged at -18.4. Uncertainty regarding outlooks continued to rise, with the corresponding index remaining positive, though it fell eight points in August to its lowest reading in more than two years.
Labor market measures suggest slower growth in employment and shorter workweeks in August. The employment index decreased six points to 4.3, a reading below the series average of 7.8. Eighteen percent of firms noted net hiring, while 14 percent noted net layoffs. The hours worked index slipped back into negative territory, coming in at -3.8.
Price pressures remained rather subdued in August, while wage growth accelerated. The raw materials prices index rose seven points to 17.4, still well below its average reading of 27.6. The finished goods prices index held steady at 1.8, a reading suggestive of little price growth this month. The wages and benefits index shot up 16 points to 34.9, pushing past its average reading of 21.1.
Expectations regarding future manufacturing activity were mixed in August. The future production index remained positive but slipped to 6.3. The future general business activity index returned to negative territory after pushing positive last month, coming in at -3.3. Most other measures of future manufacturing activity retreated this month but remained in positive territory.
Next release: Monday, September 25
Data were collected Aug. 15–23, and 88 Texas manufacturers responded to the survey. The Dallas Fed conducts the Texas Manufacturing Outlook Survey monthly to obtain a timely assessment of the state’s factory activity. Firms are asked whether output, employment, orders, prices and other indicators increased, decreased or remained unchanged over the previous month.
Survey responses are used to calculate an index for each indicator. Each index is calculated by subtracting the percentage of respondents reporting a decrease from the percentage reporting an increase. When the share of firms reporting an increase exceeds the share reporting a decrease, the index will be greater than zero, suggesting the indicator has increased over the prior month. If the share of firms reporting a decrease exceeds the share reporting an increase, the index will be below zero, suggesting the indicator has decreased over the prior month. An index will be zero when the number of firms reporting an increase is equal to the number of firms reporting a decrease. Data have been seasonally adjusted as necessary.
Results summary
Historical data are available from June 2004 to the most current release month.
| Business Indicators Relating to Facilities and Products in Texas Current (versus previous month) | ||||||||
| Indicator | Aug Index | Jul Index | Change | Series Average | Trend* | % Reporting Increase | % Reporting No Change | % Reporting Decrease |
Production | –11.2 | –4.8 | –6.4 | 10.3 | 4(–) | 22.0 | 44.8 | 33.2 |
Capacity Utilization | –3.7 | –2.4 | –1.3 | 8.3 | 4(–) | 23.3 | 49.7 | 27.0 |
New Orders | –15.8 | –18.1 | +2.3 | 5.7 | 15(–) | 19.8 | 44.6 | 35.6 |
Growth Rate of Orders | –12.5 | –20.6 | +8.1 | –0.1 | 16(–) | 20.2 | 47.1 | 32.7 |
Unfilled Orders | –13.2 | –13.8 | +0.6 | –1.8 | 13(–) | 10.8 | 65.2 | 24.0 |
Shipments | –15.8 | –2.2 | –13.6 | 8.8 | 8(–) | 19.2 | 45.7 | 35.0 |
Delivery Time | –4.3 | –11.4 | +7.1 | 1.2 | 5(–) | 11.2 | 73.3 | 15.5 |
Finished Goods Inventories | –6.9 | –1.2 | –5.7 | –3.2 | 3(–) | 14.0 | 65.1 | 20.9 |
Prices Paid for Raw Materials | 17.4 | 10.5 | +6.9 | 27.6 | 40(+) | 27.6 | 62.2 | 10.2 |
Prices Received for Finished Goods | 1.8 | 2.3 | –0.5 | 8.9 | 2(+) | 17.1 | 67.6 | 15.3 |
Wages and Benefits | 34.9 | 19.1 | +15.8 | 21.1 | 40(+) | 36.4 | 62.1 | 1.5 |
Employment | 4.3 | 10.0 | –5.7 | 7.8 | 6(+) | 17.8 | 68.7 | 13.5 |
Hours Worked | –3.8 | 3.9 | –7.7 | 3.7 | 1(–) | 15.3 | 65.6 | 19.1 |
Capital Expenditures | –8.6 | –2.4 | –6.2 | 6.7 | 2(–) | 12.9 | 65.6 | 21.5 |
| General Business Conditions Current (versus previous month) | ||||||||
| Indicator | Aug Index | Jul Index | Change | Series Average | Trend** | % Reporting Improved | % Reporting No Change | % Reporting Worsened |
Company Outlook | –18.4 | –16.9 | –1.5 | 5.4 | 18(–) | 11.8 | 58.0 | 30.2 |
General Business Activity | –17.2 | –20.0 | +2.8 | 1.7 | 16(–) | 12.0 | 58.8 | 29.2 |
| Indicator | Aug Index | Jul Index | Change | Series Average | Trend* | % Reporting Increase | % Reporting No Change | % Reporting Decrease |
Outlook Uncertainty | 12.7 | 20.5 | –7.8 | 16.9 | 28(+) | 27.6 | 57.5 | 14.9 |
| Business Indicators Relating to Facilities and Products in Texas Future (six months ahead) | ||||||||
| Indicator | Aug Index | Jul Index | Change | Series Average | Trend* | % Reporting Increase | % Reporting No Change | % Reporting Decrease |
Production | 6.3 | 15.5 | –9.2 | 36.9 | 40(+) | 29.7 | 46.9 | 23.4 |
Capacity Utilization | 2.5 | 10.8 | –8.3 | 33.8 | 40(+) | 27.9 | 46.8 | 25.4 |
New Orders | 3.2 | 19.7 | –16.5 | 34.3 | 10(+) | 25.2 | 52.8 | 22.0 |
Growth Rate of Orders | 0.5 | 12.3 | –11.8 | 25.4 | 3(+) | 21.6 | 57.3 | 21.1 |
Unfilled Orders | –12.5 | 2.3 | –14.8 | 3.1 | 1(–) | 7.5 | 72.5 | 20.0 |
Shipments | 5.5 | 16.9 | –11.4 | 35.3 | 40(+) | 28.2 | 49.1 | 22.7 |
Delivery Time | –3.9 | –5.4 | +1.5 | –1.4 | 5(–) | 9.6 | 76.9 | 13.5 |
Finished Goods Inventories | –15.9 | –5.1 | –10.8 | 0.2 | 4(–) | 8.5 | 67.1 | 24.4 |
Prices Paid for Raw Materials | 20.8 | 13.6 | +7.2 | 33.8 | 41(+) | 29.4 | 62.0 | 8.6 |
Prices Received for Finished Goods | 2.5 | 11.6 | –9.1 | 20.8 | 40(+) | 14.5 | 73.5 | 12.0 |
Wages and Benefits | 39.5 | 42.7 | –3.2 | 39.4 | 40(+) | 46.7 | 46.1 | 7.2 |
Employment | 13.2 | 21.9 | –8.7 | 23.2 | 39(+) | 29.0 | 55.2 | 15.8 |
Hours Worked | –1.3 | 4.1 | –5.4 | 9.1 | 1(–) | 12.0 | 74.7 | 13.3 |
Capital Expenditures | 14.2 | 24.3 | –10.1 | 19.7 | 39(+) | 27.5 | 59.2 | 13.3 |
| General Business Conditions Future (six months ahead) | ||||||||
| Indicator | Aug Index | Jul Index | Change | Series Average | Trend** | % Reporting Increase | % Reporting No Change | % Reporting Worsened |
Company Outlook | 6.1 | 5.9 | +0.2 | 18.8 | 3(+) | 24.1 | 57.9 | 18.0 |
General Business Activity | –3.3 | 4.6 | –7.9 | 12.9 | 1(–) | 16.0 | 64.7 | 19.3 |
*Shown is the number of consecutive months of expansion or contraction in the underlying indicator. Expansion is indicated by a positive index reading and denoted by a (+) in the table. Contraction is indicated by a negative index reading and denoted by a (–) in the table.
**Shown is the number of consecutive months of improvement or worsening in the underlying indicator. Improvement is indicated by a positive index reading and denoted by a (+) in the table. Worsening is indicated by a negative index reading and denoted by a (–) in the table.
Data have been seasonally adjusted as necessary.
Production index
Comments from survey respondents
These comments are from respondents’ completed surveys and have been edited for publication.
- The chemical industry remains slow.
- High interest rates are affecting industrial production like never before. In addition to reshoring heavy activity, supply-chain issues, lack of qualified labor and interest rates have placed an inverted incentive to grow due to a major slowdown in capital equipment expenditures. This is the time to stop raising interest rates and give confidence to the industrial segments to plan growth. Rehiring after major layoffs in this industry is not like in the consumer industry. It is costly, laborious and a long-term expedition. And with the lack of reforms in immigration and education, we are encountering major difficulties in running industrial operations. Never mind the demographics issue the U.S. is about to encounter in the short run. I think it is time for the Federal Reserve to take a creative approach when it comes to interest rate management.
- We have seen broader markets weaken with the exception of automotive. We have seen pull-ins from auto, likely due to preparation for the potential UAW [United Auto Workers union] strikes. Revenues in China are especially weak.
- We are seeing increased issues with aluminum, especially casted products.
- [Our business is] performing as planned.
- For the first time in a long time, we are seeing customers reduce or cancel orders due to softening end-use demand. We expect this trend to continue over the next few months. We continue to make capital investments, focusing on buying high-quality used manufacturing equipment at a discount when other people are pulling back because of uncertainty.
- Customer orders came to a sudden halt. The overall volume dropped 51 percent year over year.
- For a lot of businesses, production is sold out until February 2024.
- Many RFQs [requests for quotation] are out with existing customers who have not been given the go ahead to start projects/improvements.
- Supply constraints are improving, but there are still ongoing challenges with some suppliers.
- It has been business as usual. We are working on new opportunities and satisfying existing customers. We are still in the “new normal” from a margins perspective.
- We have seen a contraction in government contracts. Customer discretionary spending capability has decreased.
- Slow and steady is the current environment. Hopefully, this is not the new normal.
- The phone is not ringing. Our sales team is working harder with less results. Projects are being postponed and, perhaps even more telling, payments are increasingly protracted.
- Business is slowing down, but we are adding new products to produce. This should be positive for our business long term.
- We have seen a very slight increase in orders for August and September.
- Our industry is in a technical recession. In addition to that, foreign imports are at a very high percentage if not the highest in our history. Mexico is a leading exporter to the U.S. now. They have a raw material advantage of not having Section 232 tariffs on their aluminum. Domestic companies in our industry are affected by the 10 percent duty, which Mexico is not, giving our competitors in Mexico a significant cost advantage.
- We have been very fortunate to have a large job that has sustained us for most of the summer and will continue into September. Without this large job, we would have been stupid slow like a lot of our competitors are. There seems to be a softness in our industry right now, and because of that, we are worried about what six months from now looks like.
- [There were] no major changes this month in terms of pricing, staffing or outlook. Things have not deteriorated nor have they materially improved (still status quo, which is good and profitable). We are hoping to see an uptick in consumer spending and order volumes in the fourth quarter, similar to what we've seen in prior years.
- Vendor price increases have slowed but have not been rolled back. Interest rates are killing our industry.
Historical Data
Historical data can be downloaded dating back to June 2004.
Indexes
Download indexes for all indicators. For the definitions of all variables, see Data Definitions.
| Unadjusted |
| Seasonally adjusted |
All Data
Download indexes and components of the indexes (percentage of respondents reporting increase, decrease, or no change). For the definitions of all variables, see Data Definitions.
| Unadjusted |
| Seasonally adjusted |
Questions regarding the Texas Business Outlook Surveys can be addressed to Emily Kerr at emily.kerr@dal.frb.org.
Sign up for our email alert to be automatically notified as soon as the latest Texas Manufacturing Outlook Survey is released on the web.