Texas Manufacturing Outlook Survey

Texas manufacturing slips back into contraction
For this month’s survey, Texas business executives were asked supplemental questions on expected demand and operating margins. Results for these questions from the Texas Manufacturing Outlook Survey, Texas Service Sector Outlook Survey and Texas Retail Outlook Survey have been released together. Read the special questions results.
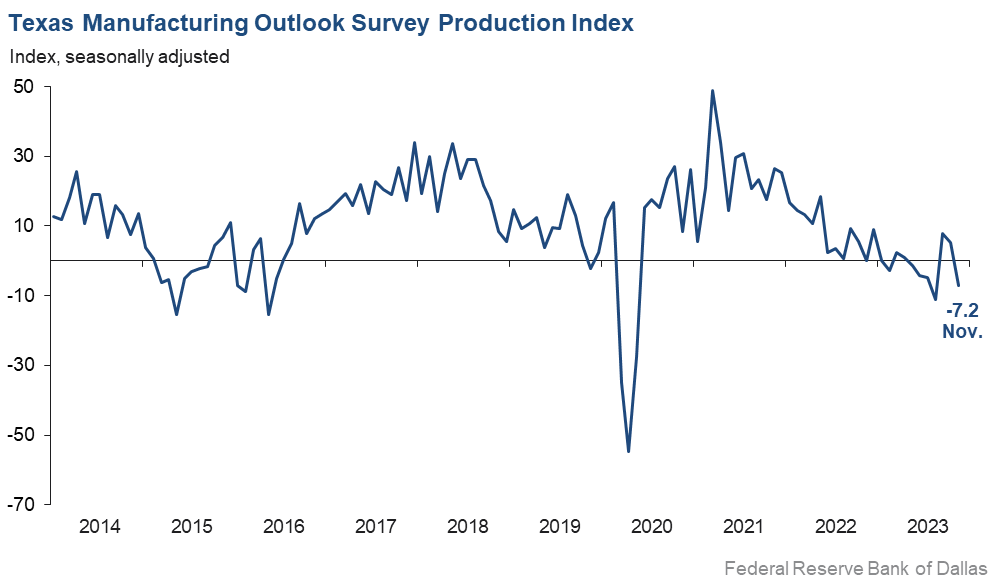
Texas factory activity contracted in November after two months of expansion, according to business executives responding to the Texas Manufacturing Outlook Survey. The production index, a key measure of state manufacturing conditions, fell 12 points to -7.2.
Other measures of manufacturing activity also indicated contraction this month. The new orders index has been negative for 18 months and dropped from -8.8 to -20.5 in November. The capacity utilization index returned to negative territory, falling from 5.4 to -10.1, while the shipments index slipped eight points to -9.5.
Perceptions of broader business conditions continued to worsen in November. The general business activity and company outlook indexes remained largely unchanged at -19.9 and -18.8, respectively, having now spent more than a year and a half in negative territory. The outlook uncertainty index stayed slightly elevated at 20.3.
Labor market measures suggest slightly slower employment growth and shorter workweeks in November. The employment index edged down from 6.7 to 5.0, a reading below the series average of 7.8. Twenty-two percent of firms noted net hiring, while 17 percent noted net layoffs. The hours worked index posted a second negative reading and slipped three points to -5.5.
Wage growth normalized this month, while material cost growth remained below average and selling prices fell. The wages and benefits index moved down four points to 20.0, a reading in line with its series average. The raw materials prices index held steady at 12.6, a reading well below average and indicative of more modest price growth than usual. The finished goods prices index decreased from -2.1 to -6.2, its lowest reading since mid-2020.
Expectations regarding future manufacturing activity remained mixed in November. The future production index stayed positive but fell six points to 13.7. The future general business activity index posted a fourth consecutive negative reading and pushed down from -6.8 to -13.4. Most other measures of future manufacturing activity remained in positive territory this month.
Next release: Tuesday, December 26
Data were collected Nov. 13–21, and 92 Texas manufacturers responded to the survey. The Dallas Fed conducts the Texas Manufacturing Outlook Survey monthly to obtain a timely assessment of the state’s factory activity. Firms are asked whether output, employment, orders, prices and other indicators increased, decreased or remained unchanged over the previous month.
Survey responses are used to calculate an index for each indicator. Each index is calculated by subtracting the percentage of respondents reporting a decrease from the percentage reporting an increase. When the share of firms reporting an increase exceeds the share reporting a decrease, the index will be greater than zero, suggesting the indicator has increased over the prior month. If the share of firms reporting a decrease exceeds the share reporting an increase, the index will be below zero, suggesting the indicator has decreased over the prior month. An index will be zero when the number of firms reporting an increase is equal to the number of firms reporting a decrease. Data have been seasonally adjusted as necessary.
Results summary
Historical data are available from June 2004 to the most current release month.
| Business Indicators Relating to Facilities and Products in Texas Current (versus previous month) | ||||||||
| Indicator | Nov Index | Oct Index | Change | Series Average | Trend* | % Reporting Increase | % Reporting No Change | % Reporting Decrease |
Production | –7.2 | 5.2 | –12.4 | 10.2 | 1(–) | 23.0 | 46.8 | 30.2 |
Capacity Utilization | –10.1 | 5.4 | –15.5 | 8.2 | 1(–) | 21.4 | 47.0 | 31.5 |
New Orders | –20.5 | –8.8 | –11.7 | 5.5 | 18(–) | 19.9 | 39.7 | 40.4 |
Growth Rate of Orders | –25.4 | –16.8 | –8.6 | –0.4 | 19(–) | 13.9 | 46.7 | 39.3 |
Unfilled Orders | –18.1 | –12.9 | –5.2 | –1.9 | 2(–) | 10.0 | 61.9 | 28.1 |
Shipments | –9.5 | –1.4 | –8.1 | 8.6 | 11(–) | 19.9 | 50.7 | 29.4 |
Delivery Time | –8.1 | –7.8 | –0.3 | 1.1 | 8(–) | 9.1 | 73.7 | 17.2 |
Finished Goods Inventories | –2.2 | –5.3 | +3.1 | –3.2 | 6(–) | 19.8 | 58.2 | 22.0 |
Prices Paid for Raw Materials | 12.6 | 13.6 | –1.0 | 27.5 | 43(+) | 25.5 | 61.6 | 12.9 |
Prices Received for Finished Goods | –6.2 | –2.1 | –4.1 | 8.7 | 2(–) | 10.1 | 73.6 | 16.3 |
Wages and Benefits | 20.0 | 24.4 | –4.4 | 21.2 | 43(+) | 24.1 | 71.8 | 4.1 |
Employment | 5.0 | 6.7 | –1.7 | 7.8 | 9(+) | 21.6 | 61.7 | 16.6 |
Hours Worked | –5.5 | –2.3 | –3.2 | 3.6 | 2(–) | 15.3 | 63.9 | 20.8 |
Capital Expenditures | 4.2 | 2.3 | +1.9 | 6.6 | 2(+) | 22.2 | 59.8 | 18.0 |
| General Business Conditions Current (versus previous month) | ||||||||
| Indicator | Nov Index | Oct Index | Change | Series Average | Trend** | % Reporting Improved | % Reporting No Change | % Reporting Worsened |
Company Outlook | –18.8 | –17.1 | –1.7 | 5.1 | 21(–) | 11.0 | 59.2 | 29.8 |
General Business Activity | –19.9 | –19.2 | –0.7 | 1.4 | 19(–) | 12.2 | 55.7 | 32.1 |
| Indicator | Nov Index | Oct Index | Change | Series Average | Trend* | % Reporting Increase | % Reporting No Change | % Reporting Decrease |
Outlook Uncertainty | 20.3 | 20.2 | +0.1 | 17.1 | 31(+) | 27.0 | 66.3 | 6.7 |
| Business Indicators Relating to Facilities and Products in Texas Future (six months ahead) | ||||||||
| Indicator | Nov Index | Oct Index | Change | Series Average | Trend* | % Reporting Increase | % Reporting No Change | % Reporting Decrease |
Production | 13.7 | 20.0 | –6.3 | 36.7 | 43(+) | 32.5 | 48.8 | 18.8 |
Capacity Utilization | 12.7 | 12.3 | +0.4 | 33.5 | 43(+) | 32.1 | 48.6 | 19.4 |
New Orders | 8.4 | 12.4 | –4.0 | 34.0 | 13(+) | 30.7 | 47.0 | 22.3 |
Growth Rate of Orders | 6.8 | 8.4 | –1.6 | 25.1 | 6(+) | 26.1 | 54.6 | 19.3 |
Unfilled Orders | –6.3 | 2.6 | –8.9 | 3.0 | 1(–) | 8.5 | 76.7 | 14.8 |
Shipments | 19.2 | 22.7 | –3.5 | 35.1 | 43(+) | 37.2 | 44.9 | 18.0 |
Delivery Time | –4.0 | –4.7 | +0.7 | –1.5 | 8(–) | 12.2 | 71.6 | 16.2 |
Finished Goods Inventories | –10.3 | –4.6 | –5.7 | 0.1 | 7(–) | 13.8 | 62.1 | 24.1 |
Prices Paid for Raw Materials | 27.9 | 29.3 | –1.4 | 33.7 | 44(+) | 36.4 | 55.1 | 8.5 |
Prices Received for Finished Goods | 24.2 | 26.4 | –2.2 | 20.8 | 43(+) | 32.2 | 59.8 | 8.0 |
Wages and Benefits | 38.9 | 41.0 | –2.1 | 39.4 | 43(+) | 40.5 | 57.9 | 1.6 |
Employment | 12.0 | 11.7 | +0.3 | 23.1 | 42(+) | 25.1 | 61.8 | 13.1 |
Hours Worked | –0.1 | 5.7 | –5.8 | 9.0 | 1(–) | 14.1 | 71.7 | 14.2 |
Capital Expenditures | 12.9 | 14.5 | –1.6 | 19.6 | 42(+) | 26.6 | 59.7 | 13.7 |
| General Business Conditions Future (six months ahead) | ||||||||
| Indicator | Nov Index | Oct Index | Change | Series Average | Trend** | % Reporting Increase | % Reporting No Change | % Reporting Worsened |
Company Outlook | –7.4 | –2.6 | –4.8 | 18.5 | 3(–) | 17.3 | 58.0 | 24.7 |
General Business Activity | –13.4 | –6.8 | –6.6 | 12.6 | 4(–) | 12.4 | 61.8 | 25.8 |
*Shown is the number of consecutive months of expansion or contraction in the underlying indicator. Expansion is indicated by a positive index reading and denoted by a (+) in the table. Contraction is indicated by a negative index reading and denoted by a (–) in the table.
**Shown is the number of consecutive months of improvement or worsening in the underlying indicator. Improvement is indicated by a positive index reading and denoted by a (+) in the table. Worsening is indicated by a negative index reading and denoted by a (–) in the table.
Data have been seasonally adjusted as necessary.
Production index
Comments from survey respondents
These comments are from respondents’ completed surveys and have been edited for publication.
- The chemical industry seems to be in a recession now.
- We are seeing a lot of price and lead-time increases with aluminum products.
- We are working our way through a cyclical bottom as customer demand has slowed in most markets, and customers work to right-size inventory. Growth is resuming in PC/handsets, other markets are still correcting, and auto has yet to show any signs of slowing.
- I think we are on the downside of the through cycle for building products. While the professional-level activity has been somewhat consistent throughout the year, the end users are just now returning to the market.
- New orders are slow coming in.
- Our customer base is very slow to release orders. It is not a price-point issue but rather customers’ concerns surrounding their uncertainty.
- Sales orders have increased here at year-end, which is a good sign after a slowdown this fall. Raw material prices have decreased, leading to improved profit margin. We raised employee wages 5 percent, with the last increase 18 months ago. We need to retain good employees, as labor turnover is still a concern. Our minimum wage is $14 an hour.
- Orders are getting pushed out. Sales volume is down since last month and earlier this year.
- The Dallas area continues to be a bright spot in construction, particularly in health care and hospitality. Our largest business threats are a lack of skilled tradespeople and replacing our older workers who are retiring.
- Business remains slow, and we see no signs of improvement.
- The cost of funds, Middle East concerns and it being a [upcoming] presidential election year all seem to be influencing our markets.
- The quote rate has increased. We expect that orders will increase after Jan. 1.
- October, November and (estimated) December sales volumes have decreased by 30–35 percent from normal. This is attributed predominantly to the ripple effect of the UAW [United Auto Workers] strike. About 40 percent of our customers are tier 1 suppliers to automotive. In general, the volume of sales across all other segments is down, which is expected this time of year.
- The future is uncertain.
- We are still in a holding pattern, with business not good but not bad either. Planning is cautious at this point.
- Our retail sector is reeling somewhat. We’ll wait and see how bad Christmas goes, but the consumer is heavily burdened.
- Customers’ inventories are lower, yet they are not buying. This means their customers are slow.
- Our U.S. industry has lost approximately 30 percent of our sales to foreign competition who is either dumping or receiving government subsidies, or both. Last month, a coalition of companies within our industry filed charges against 15 countries with the Commerce Department for unfair trade. A preliminary ruling last week by the International Trade Commission found enough evidence to substantiate our claims and move forward with the investigation. We are hopeful that the rulings will advance our U.S. efforts for fair trade.
- Incoming orders continued to decline over the last six to eight months. Now that we have worked through our backlog, it is affecting our ability to reach breakeven and has affected our employment number. We do not see that this situation will improve into first quarter 2024.
- We continue to book new orders, which is a very pleasant surprise. We had feared things would be slowing down right now, but that is not the case. We do know we should be pretty busy starting in about six months and carrying forward for at least four to five months, so things are looking promising for sure.
- Customers are hammering down prices by getting competitive quotes and pushing back on pricing. Order quantity for our consumer goods packaging orders is smaller than last year.
- We are seeing a good increase in sales as people do holiday shopping. It's hard to gauge how the rest of the holiday season will go, and uncertainty is high.
- There is nothing encouraging on the horizon.
Historical Data
Historical data can be downloaded dating back to June 2004.
Indexes
Download indexes for all indicators. For the definitions of all variables, see Data Definitions.
| Unadjusted |
| Seasonally adjusted |
All Data
Download indexes and components of the indexes (percentage of respondents reporting increase, decrease, or no change). For the definitions of all variables, see Data Definitions.
| Unadjusted |
| Seasonally adjusted |
Questions regarding the Texas Business Outlook Surveys can be addressed to Emily Kerr at emily.kerr@dal.frb.org.
Sign up for our email alert to be automatically notified as soon as the latest Texas Manufacturing Outlook Survey is released on the web.