Texas Manufacturing Outlook Survey

Texas manufacturing activity contracts in January
For this month’s survey, Texas business executives were asked supplemental questions on the labor market. Results for these questions from the Texas Manufacturing Outlook Survey, Texas Service Sector Outlook Survey and Texas Retail Outlook Survey have been released together. Read the special questions results.
This month’s data release also includes annual seasonal factor revisions. Once per year, the Federal Reserve Bank of Dallas revises the historical data for the Texas Manufacturing Outlook Survey after calculating new seasonal adjustment factors. Annual seasonal revisions result in slight changes in the seasonally adjusted series. Read more information on seasonal adjustment.
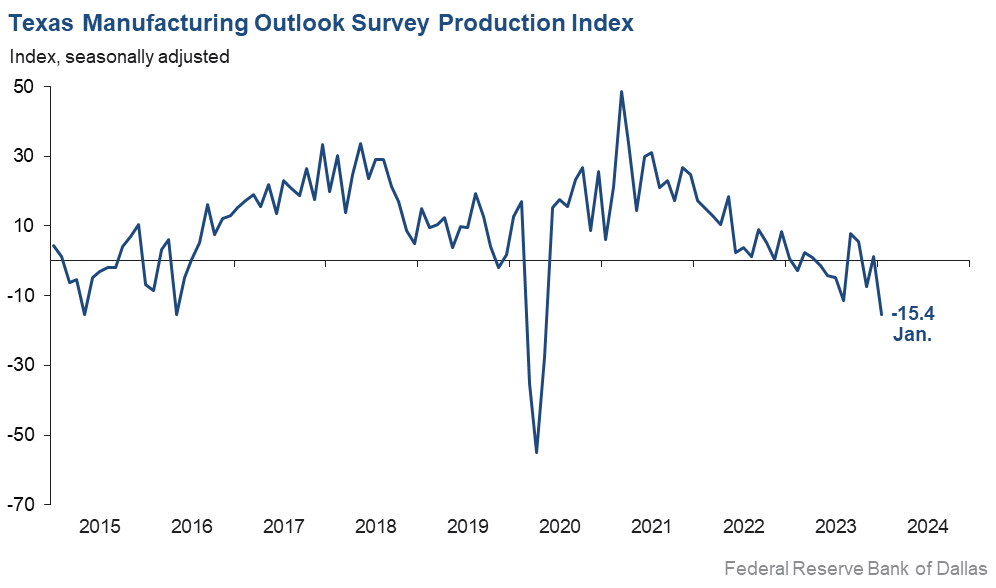
Texas factory activity contracted in January after stabilizing in December, according to business executives responding to the Texas Manufacturing Outlook Survey. The production index, a key measure of state manufacturing conditions, dropped 17 points to -15.4—its lowest reading since mid-2020.
Other measures of manufacturing activity also indicated contraction this month. The new orders index ticked down from -10.1 to -12.5 in January, while the growth rate of orders index remained negative but pushed up eight points to -14.4. The capacity utilization index dropped to a multiyear low of -14.9, and the shipments index slipped 11 points to -16.6.
Perceptions of broader business conditions continued to worsen in January. The general business activity index fell from -10.4 to -27.4, and the company outlook index fell from -9.4 to -18.2. The outlook uncertainty index held fairly steady at 20.9.
Labor market measures suggested employment declines and shorter workweeks in January. The employment index moved down seven points to -9.7, its lowest reading since mid-2020. Fourteen percent of firms noted net hiring, while 23 percent noted net layoffs. The hours worked index came in at -11.8 after a near-zero reading last month.
Wage and input costs continued to increase this month, while selling prices were flat. The wages and benefits index edged down to 20.8, in line with its average reading. The raw materials prices index inched up to 20.2, a reading below average and indicative of more modest cost growth than usual. The finished goods prices index came in at 0, suggesting prices in January were similar to those in December.
Expectations regarding future manufacturing activity improved in January. The future production index moved up 10 points to 21.7, and most other indexes pushed further positive as well. Meanwhile, the future general business activity index remained negative and was little changed from its December reading, coming in at -10.4.
Next release: Monday, February 26
Data were collected Jan. 16–24, and 92 out of the 127 Texas manufacturers surveyed submitted a response. The Dallas Fed conducts the Texas Manufacturing Outlook Survey monthly to obtain a timely assessment of the state’s factory activity. Firms are asked whether output, employment, orders, prices and other indicators increased, decreased or remained unchanged over the previous month.
Survey responses are used to calculate an index for each indicator. Each index is calculated by subtracting the percentage of respondents reporting a decrease from the percentage reporting an increase. When the share of firms reporting an increase exceeds the share reporting a decrease, the index will be greater than zero, suggesting the indicator has increased over the prior month. If the share of firms reporting a decrease exceeds the share reporting an increase, the index will be below zero, suggesting the indicator has decreased over the prior month. An index will be zero when the number of firms reporting an increase is equal to the number of firms reporting a decrease. Data have been seasonally adjusted as necessary.
Results summary
Historical data are available from June 2004 to the most current release month.
| Business Indicators Relating to Facilities and Products in Texas Current (versus previous month) | ||||||||
| Indicator | Jan Index | Dec Index | Change | Series Average | Trend* | % Reporting Increase | % Reporting No Change | % Reporting Decrease |
Production | –15.4 | 1.2 | –16.6 | 10.0 | 1(–) | 16.2 | 52.2 | 31.6 |
Capacity Utilization | –14.9 | 0.6 | –15.5 | 8.0 | 1(–) | 16.3 | 52.5 | 31.2 |
New Orders | –12.5 | –10.1 | –2.4 | 5.3 | 20(–) | 16.0 | 55.4 | 28.5 |
Growth Rate of Orders | –14.4 | –22.4 | +8.0 | –0.5 | 21(–) | 12.2 | 61.1 | 26.6 |
Unfilled Orders | –12.9 | –9.9 | –3.0 | –2.0 | 4(–) | 6.6 | 73.9 | 19.5 |
Shipments | –16.6 | –5.3 | –11.3 | 8.5 | 16(–) | 14.0 | 55.4 | 30.6 |
Delivery Time | –8.1 | –3.2 | –4.9 | 1.0 | 10(–) | 6.9 | 78.1 | 15.0 |
Finished Goods Inventories | –2.2 | –5.4 | +3.2 | –3.2 | 8(–) | 17.6 | 62.6 | 19.8 |
Prices Paid for Raw Materials | 20.2 | 17.8 | +2.4 | 27.4 | 45(+) | 25.1 | 70.0 | 4.9 |
Prices Received for Finished Goods | 0.1 | 6.1 | –6.0 | 8.7 | 2(+) | 12.7 | 74.8 | 12.6 |
Wages and Benefits | 20.8 | 25.1 | –4.3 | 21.2 | 45(+) | 22.9 | 75.0 | 2.1 |
Employment | –9.7 | –2.8 | –6.9 | 7.7 | 2(–) | 13.7 | 62.9 | 23.4 |
Hours Worked | –11.8 | –0.2 | –11.6 | 3.5 | 4(–) | 12.2 | 63.7 | 24.0 |
Capital Expenditures | 4.7 | 2.8 | +1.9 | 6.5 | 4(+) | 21.5 | 61.7 | 16.8 |
| General Business Conditions Current (versus previous month) | ||||||||
| Indicator | Jan Index | Dec Index | Change | Series Average | Trend** | % Reporting Improved | % Reporting No Change | % Reporting Worsened |
Company Outlook | –18.2 | –9.4 | –8.8 | 4.9 | 23(–) | 7.8 | 66.2 | 26.0 |
General Business Activity | –27.4 | –10.4 | –17.0 | 1.2 | 21(–) | 6.2 | 60.3 | 33.6 |
| Indicator | Jan Index | Dec Index | Change | Series Average | Trend* | % Reporting Increase | % Reporting No Change | % Reporting Decrease |
Outlook Uncertainty | 20.9 | 18.3 | +2.6 | 17.2 | 33(+) | 29.7 | 61.5 | 8.8 |
| Business Indicators Relating to Facilities and Products in Texas Future (six months ahead) | ||||||||
| Indicator | Jan Index | Dec Index | Change | Series Average | Trend* | % Reporting Increase | % Reporting No Change | % Reporting Decrease |
Production | 21.7 | 12.0 | +9.7 | 36.5 | 45(+) | 36.0 | 49.7 | 14.3 |
Capacity Utilization | 16.3 | 12.9 | +3.4 | 33.4 | 45(+) | 30.7 | 54.9 | 14.4 |
New Orders | 20.9 | 14.2 | +6.7 | 33.9 | 15(+) | 34.1 | 52.7 | 13.2 |
Growth Rate of Orders | 13.3 | 5.4 | +7.9 | 25.0 | 8(+) | 27.7 | 57.9 | 14.4 |
Unfilled Orders | –1.9 | –6.5 | +4.6 | 2.9 | 3(–) | 8.8 | 80.4 | 10.7 |
Shipments | 21.2 | 14.1 | +7.1 | 34.9 | 45(+) | 37.3 | 46.6 | 16.1 |
Delivery Time | –3.0 | –0.6 | –2.4 | –1.5 | 10(–) | 4.9 | 87.1 | 7.9 |
Finished Goods Inventories | 4.6 | –3.4 | +8.0 | 0.1 | 1(+) | 19.5 | 65.5 | 14.9 |
Prices Paid for Raw Materials | 25.2 | 26.1 | –0.9 | 33.6 | 46(+) | 33.1 | 59.0 | 7.9 |
Prices Received for Finished Goods | 18.4 | 27.0 | –8.6 | 20.8 | 45(+) | 26.4 | 65.5 | 8.0 |
Wages and Benefits | 34.4 | 34.2 | +0.2 | 39.3 | 236(+) | 37.6 | 59.2 | 3.2 |
Employment | 14.3 | 7.3 | +7.0 | 23.0 | 44(+) | 23.2 | 67.9 | 8.9 |
Hours Worked | –3.3 | 4.0 | –7.3 | 8.9 | 1(–) | 11.1 | 74.5 | 14.4 |
Capital Expenditures | 9.2 | 10.7 | –1.5 | 19.5 | 44(+) | 21.7 | 65.8 | 12.5 |
| General Business Conditions Future (six months ahead) | ||||||||
| Indicator | Jan Index | Dec Index | Change | Series Average | Trend** | % Reporting Increase | % Reporting No Change | % Reporting Worsened |
Company Outlook | 4.4 | 0.8 | +3.6 | 18.4 | 2(+) | 19.8 | 64.8 | 15.4 |
General Business Activity | –10.4 | –9.3 | –1.1 | 12.4 | 6(–) | 11.9 | 65.9 | 22.3 |
*Shown is the number of consecutive months of expansion or contraction in the underlying indicator. Expansion is indicated by a positive index reading and denoted by a (+) in the table. Contraction is indicated by a negative index reading and denoted by a (–) in the table.
**Shown is the number of consecutive months of improvement or worsening in the underlying indicator. Improvement is indicated by a positive index reading and denoted by a (+) in the table. Worsening is indicated by a negative index reading and denoted by a (–) in the table.
Data have been seasonally adjusted as necessary.
Production index
Comments from survey respondents
These comments are from respondents’ completed surveys and have been edited for publication.
- Stagflation, increased commodity costs, labor costs and benefits to retain talented staff, political upheaval, border failure and dysfunction at the regulatory level [are issues affecting our business].
- Current macroeconomic conditions are not encouraging. After a busy fourth quarter, the start of 2024 has been slower than planned. My view of 2024 has changed. I had thought 2024 would be a good year, but I see signs of trouble ahead, which will be disruptive.
- Drought last year and a small cotton crop have caused supply issues for us.
- We are seeing increased stability in demand for our products, which is a change from a year ago when we saw a dramatic decline in our super-premium items. It feels to us like consumers are more comfortable this year than last year. Interest rate increases have stopped for the moment, which may have an impact on their attitude. We are seeing moderate growth this year, which is a good sign for us.
- Demand feels weak right now.
- January has been a slower month for sales relative to December (to be expected) and year over year (which was not expected). We are also seeing increasing lead times for inventory and delays at the ports, which we've not seen or experienced in several months. Overall, uncertainty is high, and I'm feeling less optimistic than I did last quarter.
- The improvement is slight but measurable.
- The unnecessary, ill-advised postal rate increase conflicts with the already-weakened demand and has undermined any recovery of that type of marketing. Combined with the continued inflation on our raw materials of paper, ink and replacement parts for our machinery, nothing is helping our future.
- We continue to be busier than normal for this time of year, which we are thankful for. Some departments are able to jump on jobs quicker, while others have a backlog. We are about to book a really big job that will help sustain us for a few months, which is a nice thing to bring in at this time of year.
- The current state of the oil market is slowing. This is resulting in a noticeable reduction in new orders. The first and second quarters of the year will be challenging. Things may pick up near the end of the third quarter, best-case scenario. Worst-case scenario, fourth quarter or early 2025.
- In order to improve our business outlook, we are adding product offerings through capital expenditures. Legacy business is declining due to competition outside of the U.S.
- Our segment of the manufacturing industry is under attack with unfair trade practices. We were successful around 10 years ago in slowing down China from dumping extrusions. A coalition of companies within our industry filed unfair trade charges last year against 15 countries. Initial rulings by the International Commerce Commission last year indicate our industry has been severely damaged, which means our trade case is moving to the next step, and anti-dumping and countervailing duties more than likely are forthcoming.
- Lots of bad vibes out there. But orders are not down as much as I would have expected.
- We expect softening of demand in the first half of 2024, with partial recovery forecasted for the second half.
- Federal Reserve rate-hike levels have all but stopped demand. There is no way to forecast six months forward.
- We are very concerned about our credit line renewal in February, the loan amount being decreased and rate costs increasing.
- It has been a slow start to the year as we thought business would pick up after the holidays, however, it has not. Based on current business activity, this may be a rough year.
- We are investing short term in new manufacturing equipment because our competitors are now asking us to manufacture their equipment. This is increasing our sales and production of finished goods to the point that we are buying larger quantities of raw materials.
- We are still having trouble finding raw metal goods and bar stock.
- The election is the greatest influencer presently. Oil prices and Middle East "anxiety" have an adverse impact. Extreme cold after a seemingly inordinately hot summer have also added some incongruity to our production.
- We would expect to move through a cyclical bottom sometime between the second and third quarters of 2024. End demand seems to remain stable; customers are adjusting inventory in response to lower growth expectations.
- We have seen a decrease in quote opportunities, quote requests and sales orders. I am not sure the reason why.
- [Our] heads [will be] in the sand for the next 18 months.
Historical Data
Historical data can be downloaded dating back to June 2004.
Indexes
Download indexes for all indicators. For the definitions of all variables, see Data Definitions.
| Unadjusted |
| Seasonally adjusted |
All Data
Download indexes and components of the indexes (percentage of respondents reporting increase, decrease, or no change). For the definitions of all variables, see Data Definitions.
| Unadjusted |
| Seasonally adjusted |
Questions regarding the Texas Business Outlook Surveys can be addressed to Emily Kerr at emily.kerr@dal.frb.org.
Sign up for our email alert to be automatically notified as soon as the latest Texas Manufacturing Outlook Survey is released on the web.