Texas Manufacturing Outlook Survey

Texas manufacturing activity stabilizes in February
For this month’s survey, Texas business executives were asked supplemental questions on expected demand and hiring. Results for these questions from the Texas Manufacturing Outlook Survey, Texas Service Sector Outlook Survey and Texas Retail Outlook Survey have been released together. Read the special questions results.
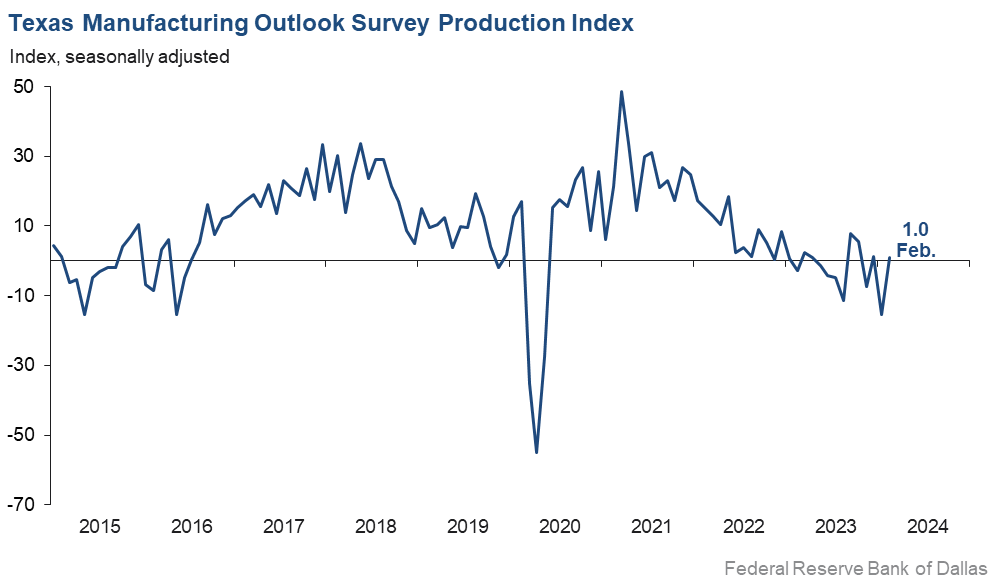
Texas factory activity stabilized in February after contracting in January, according to business executives responding to the Texas Manufacturing Outlook Survey. The production index, a key measure of state manufacturing conditions, rebounded 16 points to 1.0. The near-zero reading suggests flat output month over month.
Other measures of manufacturing activity also indicated stability this month, and an increase in demand was seen. The new orders index—a key measure of demand—shot up 18 points in January to 5.2, its first positive reading since May 2022. The capacity utilization and shipments indexes both posted double-digit increases to push up from contractionary territory (negative readings) into neutral territory (readings near zero).
Perceptions of broader business conditions continued to worsen in February, though the indexes were less negative than in January. The general business activity index increased from -27.4 to -11.3, and the company outlook index rose from -18.2 to -8.5. The outlook uncertainty index retreated 10 points to 11.0.
Labor market measures suggested growth in employment but shorter workweeks this month. The employment index rebounded after two negative readings, rising 16 points to 5.9. Eighteen percent of firms noted net hiring, while 13 percent noted net layoffs. The hours worked index remained negative for a fifth month in a row but edged up to -7.0.
Wage and input costs continued to increase this month, while selling prices remained flat. The wages and benefits index held steady at a near-average reading of 20.1. The raw materials prices index retreated five points to 15.4, falling further below average and indicative of more modest cost growth than usual. The finished goods prices index remained near 0, suggesting prices in February were unchanged from January.
Expectations regarding future manufacturing activity improved in February. The future production index held steady at 22.4, and the future general business activity index shot up 17 points to 6.2, returning to positive territory after six months of negative readings. Most other measures of future manufacturing activity edged further positive this month.
Next release: Monday, March 25
Data were collected Feb. 13–21, and 92 of the 127 Texas manufacturers surveyed submitted a response. The Dallas Fed conducts the Texas Manufacturing Outlook Survey monthly to obtain a timely assessment of the state’s factory activity. Firms are asked whether output, employment, orders, prices and other indicators increased, decreased or remained unchanged over the previous month.
Survey responses are used to calculate an index for each indicator. Each index is calculated by subtracting the percentage of respondents reporting a decrease from the percentage reporting an increase. When the share of firms reporting an increase exceeds the share reporting a decrease, the index will be greater than zero, suggesting the indicator has increased over the prior month. If the share of firms reporting a decrease exceeds the share reporting an increase, the index will be below zero, suggesting the indicator has decreased over the prior month. An index will be zero when the number of firms reporting an increase is equal to the number of firms reporting a decrease. Data have been seasonally adjusted as necessary.
Results summary
Historical data are available from June 2004 to the most current release month.
| Business Indicators Relating to Facilities and Products in Texas Current (versus previous month) | ||||||||
| Indicator | Feb Index | Jan Index | Change | Series Average | Trend* | % Reporting Increase | % Reporting No Change | % Reporting Decrease |
Production | 1.0 | –15.4 | +16.4 | 10.0 | 1(+) | 23.9 | 53.2 | 22.9 |
Capacity Utilization | –1.0 | –14.9 | +13.9 | 8.0 | 2(–) | 22.1 | 54.8 | 23.1 |
New Orders | 5.2 | –12.5 | +17.7 | 5.3 | 1(+) | 27.6 | 49.9 | 22.4 |
Growth Rate of Orders | –5.5 | –14.4 | +8.9 | –0.5 | 22(–) | 18.2 | 58.1 | 23.7 |
Unfilled Orders | –13.7 | –12.9 | –0.8 | –2.0 | 5(–) | 6.2 | 73.9 | 19.9 |
Shipments | 0.1 | –16.6 | +16.7 | 8.4 | 1(+) | 24.5 | 51.1 | 24.4 |
Delivery Time | –8.0 | –8.1 | +0.1 | 1.0 | 11(–) | 11.1 | 69.8 | 19.1 |
Finished Goods Inventories | 1.1 | –2.2 | +3.3 | –3.2 | 1(+) | 22.2 | 56.7 | 21.1 |
Prices Paid for Raw Materials | 15.4 | 20.2 | –4.8 | 27.3 | 46(+) | 23.8 | 67.8 | 8.4 |
Prices Received for Finished Goods | 0.8 | 0.1 | +0.7 | 8.6 | 3(+) | 11.4 | 78.0 | 10.6 |
Wages and Benefits | 20.1 | 20.8 | –0.7 | 21.2 | 46(+) | 24.2 | 71.7 | 4.1 |
Employment | 5.9 | –9.7 | +15.6 | 7.7 | 1(+) | 18.4 | 69.1 | 12.5 |
Hours Worked | –7.0 | –11.8 | +4.8 | 3.5 | 5(–) | 9.4 | 74.2 | 16.4 |
Capital Expenditures | 5.0 | 4.7 | +0.3 | 6.5 | 5(+) | 17.8 | 69.4 | 12.8 |
| General Business Conditions Current (versus previous month) | ||||||||
| Indicator | Feb Index | Jan Index | Change | Series Average | Trend** | % Reporting Improved | % Reporting No Change | % Reporting Worsened |
Company Outlook | –8.5 | –18.2 | +9.7 | 4.9 | 24(–) | 9.6 | 72.3 | 18.1 |
General Business Activity | –11.3 | –27.4 | +16.1 | 1.1 | 22(–) | 11.0 | 66.7 | 22.3 |
| Indicator | Feb Index | Jan Index | Change | Series Average | Trend* | % Reporting Increase | % Reporting No Change | % Reporting Decrease |
Outlook Uncertainty | 11.0 | 20.9 | –9.9 | 17.1 | 34(+) | 20.9 | 69.2 | 9.9 |
| Business Indicators Relating to Facilities and Products in Texas Future (six months ahead) | ||||||||
| Indicator | Feb Index | Jan Index | Change | Series Average | Trend* | % Reporting Increase | % Reporting No Change | % Reporting Decrease |
Production | 22.4 | 21.7 | +0.7 | 36.4 | 46(+) | 32.9 | 56.6 | 10.5 |
Capacity Utilization | 20.2 | 16.3 | +3.9 | 33.3 | 46(+) | 32.8 | 54.6 | 12.6 |
New Orders | 24.2 | 20.9 | +3.3 | 33.8 | 16(+) | 35.0 | 54.2 | 10.8 |
Growth Rate of Orders | 17.7 | 13.3 | +4.4 | 25.0 | 9(+) | 28.7 | 60.3 | 11.0 |
Unfilled Orders | 3.9 | –1.9 | +5.8 | 2.9 | 1(+) | 9.4 | 85.1 | 5.5 |
Shipments | 24.4 | 21.2 | +3.2 | 34.9 | 46(+) | 35.6 | 53.2 | 11.2 |
Delivery Time | –3.1 | –3.0 | –0.1 | –1.5 | 11(–) | 6.2 | 84.5 | 9.3 |
Finished Goods Inventories | –3.5 | 4.6 | –8.1 | 0.1 | 1(–) | 14.9 | 66.7 | 18.4 |
Prices Paid for Raw Materials | 20.9 | 25.2 | –4.3 | 33.6 | 47(+) | 28.5 | 63.9 | 7.6 |
Prices Received for Finished Goods | 22.7 | 18.4 | +4.3 | 20.8 | 46(+) | 28.4 | 65.9 | 5.7 |
Wages and Benefits | 34.9 | 34.4 | +0.5 | 39.3 | 237(+) | 38.3 | 58.3 | 3.4 |
Employment | 15.6 | 14.3 | +1.3 | 23.0 | 45(+) | 23.4 | 68.8 | 7.8 |
Hours Worked | 4.4 | –3.3 | +7.7 | 8.9 | 1(+) | 12.3 | 79.8 | 7.9 |
Capital Expenditures | 17.7 | 9.2 | +8.5 | 19.5 | 45(+) | 24.7 | 68.3 | 7.0 |
| General Business Conditions Future (six months ahead) | ||||||||
| Indicator | Feb Index | Jan Index | Change | Series Average | Trend** | % Reporting Increase | % Reporting No Change | % Reporting Worsened |
Company Outlook | 11.8 | 4.4 | +7.4 | 18.3 | 3(+) | 22.3 | 67.2 | 10.5 |
General Business Activity | 6.2 | –10.4 | +16.6 | 12.3 | 1(+) | 18.4 | 69.4 | 12.2 |
*Shown is the number of consecutive months of expansion or contraction in the underlying indicator. Expansion is indicated by a positive index reading and denoted by a (+) in the table. Contraction is indicated by a negative index reading and denoted by a (–) in the table.
**Shown is the number of consecutive months of improvement or worsening in the underlying indicator. Improvement is indicated by a positive index reading and denoted by a (+) in the table. Worsening is indicated by a negative index reading and denoted by a (–) in the table.
Data have been seasonally adjusted as necessary.
Production index
Comments from survey respondents
These comments are from respondents’ completed surveys and have been edited for publication.
- Turmoil at the federal level is impacting funding.
- Sales were below projections for January and February; March does not look encouraging. Currently, employee hours have not been affected as we had a busy fourth quarter and need to rebuild finished goods inventory. If sales do not return to normal soon, we will be cutting employee hours. Market conditions are volatile. We do not expect any interest rate cut until June, and that could change if gasoline prices spike because of political tensions.
- Beef markets are getting very expensive, as supply is highly constrained.
- There was not much movement between February and January. There have been some delays in shipping, but other than that, it has been largely the same month over month.
- The shortage of labor that was critical during the pandemic and after has turned to being merely very tight—meaning very difficult to find qualified personnel. Job jumping has ground to a halt. Wage increases are being granted in the 3.5 to 5.0 percent range for employees meeting job requirements.
- We are slow at this very moment, but it's the calm before the storm as our incoming orders are up significantly compared with the prior year to date for our fiscal year ending Sept. 30. We hear others in our industry are very slow, so we are fortunate to have this much work lined up for the next five to six months at least.
- We are seeing a pullback from client orders as they, and us, work to reduce both finished goods and raw material inventories to increase cash flow.
- I have no idea what is going to happen.
- January weather issues hampered production (natural gas curtailments) and shipments due to icy road conditions.
- Interest rates continue to harm the homebuilding materials business. We don’t expect any improvement until interest rates drop.
- We continue to be negatively affected by foreign imports being dumped into our markets and subsidized by their governments.
- Uncertainty has increased on our general legacy business. Our strategy is to diversify our product offerings. Significant capital expenditures are underway to provide processes and equipment to provide these new products.
- We have the best backlog that we have ever had. This began a year ago and continues.
- We are still waiting on our debt renewal.
- We are once again increasing our inventory to meet expected demand. Quotes are increasing as we meet and talk to our customers. However, they are worried about the political environment and the elections, but that doesn’t mean that they are going to change their purchasing decisions.
- There's an odd chill in the air that we can't determine if it's election related, general economic malaise or fear of pending doom. It's very strange. Things are status quo with a bit of negative undertone, which is somewhat disturbing for business owners.
- Please lower interest rates. Capital equipment and manufacturing indexes are at dangerous levels. Help the nearshore movement.
- There have been several private funding groups buying up companies similar to ours. I don't know if we can make it competitively in the market.
- Many of our customers have long-term contracts. We expect the amount of contracts to increase for our remanufacturing capacity.
- Supplier prices continue to increase, and wage/benefits also continue to increase, but we sell into a fixed-income senior market and we can't increase end prices.
Historical Data
Historical data can be downloaded dating back to June 2004.
Indexes
Download indexes for all indicators. For the definitions of all variables, see Data Definitions.
| Unadjusted |
| Seasonally adjusted |
All Data
Download indexes and components of the indexes (percentage of respondents reporting increase, decrease, or no change). For the definitions of all variables, see Data Definitions.
| Unadjusted |
| Seasonally adjusted |
Questions regarding the Texas Business Outlook Surveys can be addressed to Emily Kerr at emily.kerr@dal.frb.org.
Sign up for our email alert to be automatically notified as soon as the latest Texas Manufacturing Outlook Survey is released on the web.