Texas Manufacturing Outlook Survey

June 26, 2017
Texas Manufacturing Continues to Expand but at a Slower Pace
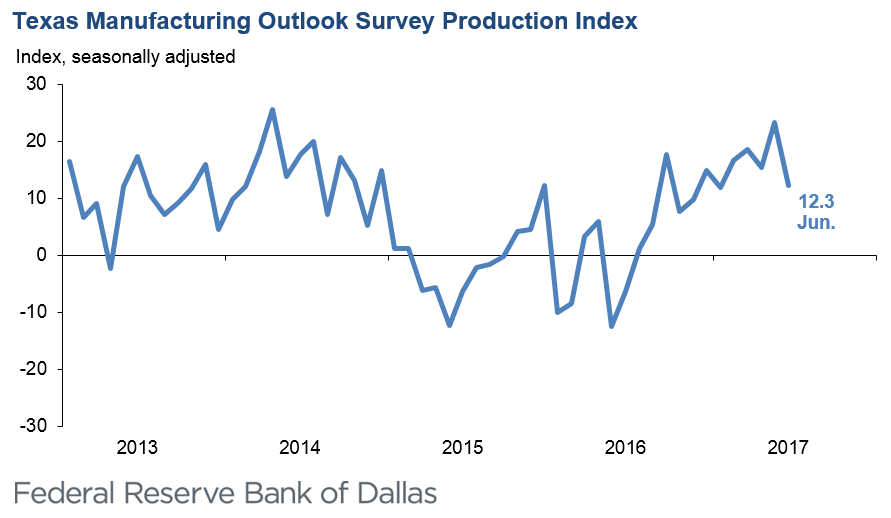
Texas factory activity increased in June, according to business executives responding to the Texas Manufacturing Outlook Survey. The production index, a key measure of state manufacturing conditions, fell 11 points to 12.3, indicating output grew but at a slower pace than in May.
Other measures of current manufacturing activity also indicated that growth moderated. The new orders and growth rate of orders indexes fell several points each, coming in at 9.6 and 4.7, respectively. The capacity utilization index moved down to 12.3, and the shipments index retreated to 8.5 after surging last month.
Perceptions of broader business conditions improved in June, although the indexes were less positive than in May. The general business activity index edged down to 15.0. The company outlook index posted a 10th consecutive positive reading but fell nine points to 10.8.
Labor market measures indicated continued employment gains and longer workweeks this month. The employment index posted a sixth consecutive positive reading and edged up to 9.6. Nineteen percent of firms noted net hiring, compared with 10 percent noting net layoffs. The hours worked index dropped to 8.9, down seven points from a six-year high last month.
Prices and wages rose in June, albeit at a somewhat slower pace. Upward pressure on input costs continued to recede slightly, with the raw materials prices index edging down two points to 15.6. Upward pressure on selling prices also abated, with the finished goods prices index falling from 5.9 to 3.6. The wages and benefits index remained elevated but ticked down to 21.1.
Expectations regarding future business conditions continued to improve. The index of future general business activity held steady at 31.9, while the index of future company outlook came in at 35.6, up five points from last month’s reading. Other indexes for future manufacturing activity showed mixed movements but remained solidly in positive territory.
Next release: Monday, July 31
|
Data were collected June 13–21, and 113 Texas manufacturers responded to the survey. The Dallas Fed conducts the Texas Manufacturing Outlook Survey monthly to obtain a timely assessment of the state’s factory activity. Firms are asked whether output, employment, orders, prices and other indicators increased, decreased or remained unchanged over the previous month. Survey responses are used to calculate an index for each indicator. Each index is calculated by subtracting the percentage of respondents reporting a decrease from the percentage reporting an increase. When the share of firms reporting an increase exceeds the share reporting a decrease, the index will be greater than zero, suggesting the indicator has increased over the prior month. If the share of firms reporting a decrease exceeds the share reporting an increase, the index will be below zero, suggesting the indicator has decreased over the prior month. An index will be zero when the number of firms reporting an increase is equal to the number of firms reporting a decrease. Data have been seasonally adjusted as necessary. |
June 26, 2017
Results Summary
Click on links in the table for greater details. Historical data are available from June 2004 to the most current release month.
| Business Indicators Relating to Facilities and Products in Texas Current (versus previous month) | ||||||||
| Indicator | Jun Index | May Index | Change | Indicator Direction* | Trend** (Months) | % Reporting Increase | % Reporting No Change | % Reporting Decrease |
12.3 | 23.3 | –11.0 | Increasing | 12 | 28.8 | 54.7 | 16.5 | |
12.3 | 19.4 | –7.1 | Increasing | 12 | 29.2 | 53.9 | 16.9 | |
9.6 | 18.1 | –8.5 | Increasing | 8 | 32.5 | 44.5 | 22.9 | |
4.7 | 12.3 | –7.6 | Increasing | 6 | 26.4 | 51.9 | 21.7 | |
1.3 | 8.1 | –6.8 | Increasing | 6 | 16.4 | 68.5 | 15.1 | |
8.5 | 24.7 | –16.2 | Increasing | 7 | 28.7 | 51.1 | 20.2 | |
0.0 | 2.7 | –2.7 | Unchanged | 1 | 11.4 | 77.2 | 11.4 | |
–1.6 | –2.3 | +0.7 | Decreasing | 2 | 18.4 | 61.6 | 20.0 | |
–7.1 | –1.8 | –5.3 | Decreasing | 2 | 13.3 | 66.4 | 20.4 | |
15.6 | 17.5 | –1.9 | Increasing | 16 | 20.6 | 74.4 | 5.0 | |
3.6 | 5.9 | –2.3 | Increasing | 11 | 12.9 | 77.8 | 9.3 | |
21.1 | 24.3 | –3.2 | Increasing | 91 | 22.9 | 75.3 | 1.8 | |
9.6 | 8.3 | +1.3 | Increasing | 6 | 19.1 | 71.4 | 9.5 | |
8.9 | 15.7 | –6.8 | Increasing | 8 | 19.3 | 70.3 | 10.4 | |
12.7 | 11.1 | +1.6 | Increasing | 10 | 20.2 | 72.3 | 7.5 | |
| General Business Conditions Current (versus previous month) | ||||||||
| Indicator | Jun Index | May Index | Change | Indicator Direction* | Trend** (Months) | % Reporting Improved | % Reporting No Change | % Reporting Worsened |
10.8 | 20.2 | –9.4 | Improving | 10 | 23.2 | 64.4 | 12.4 | |
15.0 | 17.2 | –2.2 | Improving | 9 | 27.9 | 59.2 | 12.9 | |
| Business Indicators Relating to Facilities and Products in Texas Future (six months ahead) | ||||||||
| Indicator | Jun Index | May Index | Change | Indicator Direction* | Trend** (Months) | % Reporting Increase | % Reporting No Change | % Reporting Decrease |
47.5 | 49.7 | –2.2 | Increasing | 100 | 53.7 | 40.1 | 6.2 | |
42.9 | 43.6 | –0.7 | Increasing | 100 | 49.3 | 44.3 | 6.4 | |
52.6 | 46.5 | +6.1 | Increasing | 100 | 57.3 | 38.0 | 4.7 | |
35.7 | 36.4 | –0.7 | Increasing | 100 | 39.7 | 56.3 | 4.0 | |
10.4 | 12.9 | –2.5 | Increasing | 21 | 18.3 | 73.8 | 7.9 | |
45.0 | 46.6 | –1.6 | Increasing | 100 | 52.5 | 40.0 | 7.5 | |
0.9 | 6.6 | –5.7 | Increasing | 7 | 11.1 | 78.7 | 10.2 | |
14.9 | 4.6 | +10.3 | Increasing | 7 | 23.8 | 67.3 | 8.9 | |
7.4 | 5.5 | +1.9 | Increasing | 12 | 17.6 | 72.2 | 10.2 | |
18.5 | 28.7 | –10.2 | Increasing | 99 | 25.0 | 68.5 | 6.5 | |
15.9 | 30.5 | –14.6 | Increasing | 17 | 20.6 | 74.8 | 4.7 | |
44.7 | 42.7 | +2.0 | Increasing | 157 | 44.9 | 54.9 | 0.2 | |
32.3 | 43.1 | –10.8 | Increasing | 55 | 40.9 | 50.5 | 8.6 | |
8.3 | 12.0 | –3.7 | Increasing | 13 | 18.1 | 72.1 | 9.8 | |
25.2 | 24.8 | +0.4 | Increasing | 91 | 29.9 | 65.4 | 4.7 | |
| General Business Conditions Future (six months ahead) | ||||||||
| Indicator | Jun Index | May Index | Change | Indicator Direction* | Trend** (Months) | % Reporting Increase | % Reporting No Change | % Reporting Worsened |
35.6 | 30.9 | +4.7 | Improving | 17 | 41.1 | 53.4 | 5.5 | |
31.9 | 31.6 | +0.3 | Improving | 13 | 35.8 | 60.3 | 3.9 | |
*Indicator direction refers to this month's index. If index is positive (negative), indicator is increasing (decreasing) or improving (worsening). If zero, indicator is unchanged.
**Number of months moving in current direction.
Data have been seasonally adjusted as necessary.
June 26, 2017
Production Index
June 26, 2017
Comments from Survey Respondents
These comments are from respondents' completed surveys and have been edited for publication.
Fabricated Metal Product Manufacturing
- We are seeing extremely strong price competition for our products, with increased foreign pressure for the project work. Wage pressure is coming from the continued capital project work along the Gulf Coast.
- We have experienced a lull in new orders, which seems to be the result of contractors digesting previous work backlogs. Having said that, there has been widespread dissatisfaction among contractors regarding the lack of progress on tax reduction and health care reform.
- Some projects are being let, finally. Here’s my take on the Texas economy: If you won the bid and have the business, you are busy. If you didn’t get the bid, you are not. Meaning, this is not a rising-tide economy where everyone is busy—it is spotty and super competitive.
- Energy sector sales have remained strong since fourth quarter 2016. Quote activity for the industrial sector is improving.
Computer and Electronic Product Manufacturing
- The global economy, exports and the high dollar—these are the main components to the slowdown of American capital equipment manufacturing.
- Business is definitely stronger than a year ago. There is no evidence of channel inventory building or double ordering, but we never get evidence. The question remains how long will this strength last.
- We have some new products in development that we hope to be completed by the end of the summer. Hopefully, we will be selling them.
Paper Manufacturing
- We have seen a slight setback in June after a good start in the first five months of the year.
Transportation Equipment Manufacturing
- Our business is heavily impacted by municipal tax receipts. Our data strongly suggest those numbers are on the way up in Texas (home to 70 percent of our business). We won’t know what the timing of that rebound will actually be, but we’re hopeful that it could begin as soon as fourth quarter 2017 (which coincides with most municipal budget years). We are optimistic that we will participate in that recovery fairly soon but are cautious about overextending until we have a better handle on the realities of the situation.
- We see potential to greatly benefit from the increased consumer optimism if President Trump can get some legislative achievements. So far, it has been fueled by his independent actions.
Printing and Related Support Activities
- Business is down, with a trend of declining expenditures by companies doing marketing. This trend started at the end of February and is picking up speed going into the summer. The printing, mailing, advertising and graphics industries are all way down across the country. Even the U.S. Postal Service’s total mail volume is also down from last year. Many business owners feel a major recession is imminent.
- We are having continued problems finding qualified personnel to fill training jobs for machine operator positions.
- We had a hooray May, due in part to a large project that basically fell in our lap. We went from spending huge overtime hours to now being really slow, with less-than-40-hour workweeks. Early summer can be slow for our industry, trying to scrounge up work where we can, just to keep machines and people busy. Our hope is that fall and early winter will be healthy for us.
Food Manufacturing
- Labor continues to be very tight nationwide. This is the biggest impediment to growth.
Wood Product Manufacturing
- We are adding substantial capacity and believe we can sell it all. About two-thirds of the increase will be absorbed by existing customers increasing demand, and the rest will be increased market share.
Miscellaneous Manufacturing
- We appreciate the few regulatory improvements implemented from the current administration so far. Tax reform is still needed, and further reduction of regulations is still needed. Good business managers are nearly impossible to find, and in general good labor is in limited supply and commanding a higher wage.
Historical Data
Historical data can be downloaded dating back to June 2004.
Indexes
Download indexes for all indicators. For the definitions of all variables, see Data Definitions.
| Unadjusted |
| Seasonally adjusted |
All Data
Download indexes and components of the indexes (percentage of respondents reporting increase, decrease, or no change). For the definitions of all variables, see Data Definitions.
| Unadjusted |
| Seasonally adjusted |
Questions regarding the Texas Manufacturing Outlook Survey can be addressed to Emily Kerr at emily.kerr@dal.frb.org.
Sign up for our e-mail alert to be automatically notified as soon as the latest Texas Manufacturing Outlook Survey is released on the web.