Assessment of Current Economic Conditions and Implications for Monetary Policy
May 22, 2017
As you know, at its May meeting, the Federal Open Market Committee voted to leave the federal funds rate unchanged at a range of 75 to 100 basis points. I believe that this action is consistent with an approach of removing accommodation only in a gradual and patient manner, based on our ongoing assessment of economic conditions.
The purpose of this essay is to provide a synopsis of my current views regarding economic conditions in the U.S. and globally, and my thoughts regarding the appropriate stance of U.S. monetary policy.
The Dallas Fed is one of the 12 regional Federal Reserve Banks in the United States. The Eleventh District is composed of Texas, northern Louisiana and southern New Mexico. Texas accounts for 8.8 percent of U.S. gross domestic product (GDP).[1] It is the largest exporting state in the U.S. and is home to 52 Fortune 500 companies. The characteristics of our district give the Dallas Fed unique insights into energy, trade and immigration issues, as well as great insight into the regional, national and global economies.
With that background, let me begin with a discussion of energy, given its importance to the Eleventh District as well as the nation and the world.
Energy
It is the view of our economists at the Dallas Fed that we are in the midst of a fragile equilibrium regarding global oil supply and demand.
Based on the expectation that global daily oil demand will grow, on average, at approximately 1.3 million barrels per day, we estimate that global consumption and production of oil will move into rough balance sometime in 2017. This balancing process has been helped by the implementation of the December 2016 agreement between OPEC and certain non-OPEC nations to decrease production levels by as much as 1.8 million barrels per day.
The fragility comes from the fact that, while OPEC has agreed to reduce production levels, U.S. oil production is increasing for the first time in over two years. Since the fall of 2016, U.S. oil production has risen from a low of approximately 8.6 million barrels per day to approximately 9.2 million barrels a day currently. It is our estimate that U.S. production will increase to approximately 9.7 million barrels per day by year-end 2017. The question is whether OPEC members, and other oil-producing nations, will stick to their commitments to reduce production in the face of steadily rising U.S. production. This fragile balancing process is happening in the context of record levels of excess global oil inventories.
Assuming that OPEC and non-OPEC countries extend their production agreements, as we expect, our economists anticipate excess inventory levels should begin to consistently decline sometime later this year. Based on the expectation that the market will unfold in this manner, I would expect continued price volatility but within a roughly stable band of the mid-$40s to the mid-$50s for the remainder of 2017.
Based on these price expectations, our latest Dallas Fed Energy Survey reports a notable increase in plans for capital spending in 2017 by exploration and production firms. We observe that the bulk of these spending plans are focused on shale production and are likely to involve investment in technologies that will create greater production efficiencies. Survey participants report that, in a number of locations, current market prices are sufficiently above breakeven levels to encourage further rig count growth, particularly in the Permian Basin.
Many of our recent discussions with industry contacts continue to be focused on the substantial potential supply upside of the Permian Basin in the years ahead. The Permian Basin has oil-bearing deposits that are layered, allowing multiple horizontal wells to run off a single well pad and much higher resource recovery per acre. The Permian currently produces approximately 2.3 million barrels per day.[2] With technological advances, many of our contacts believe that the Permian can expand production substantially in the years ahead. As a result, we expect that major oil companies, in the near term, may continue to avoid large long-lived capital projects and will, instead, focus their capital spending on more flexible and shorter life-cycle shale opportunities in the U.S.
The District
Aided in part by improvement in the state’s energy sector, Dallas Fed economists expect Texas job growth of approximately 2 to 2.5 percent in 2017, the strongest rate in three years. Our business surveys suggest improving conditions in the state’s manufacturing sector as well as continued strength in services.
Texas continues to benefit from the migration (as well as immigration) of people and firms to the state. Aided by this trend, the state’s economy has become increasingly diversified. The population of Texas is estimated to have grown from approximately 22.8 million in 2005 to almost 28 million in 2016.[3] Based on these trends, and as the energy sector continues to strengthen and recover, Dallas Fed economists are optimistic about the growth prospects for Texas and the Eleventh District in the months and years ahead.
Against this optimistic backdrop, I am cognizant that U.S. trade policy decisions could impact our outlook. In particular, we believe that U.S. trading and cross-border investment relationships with Mexico are important to enhancing job growth and competitiveness in the U.S. as well as economic growth in the Eleventh District.
Mexico is the top destination for Texas exports. Manufactured goods exports supported, directly and indirectly, an estimated 1 million jobs in Texas in 2015, equal to 8.2 percent of the state’s employment.[4] In 2016, Texas exports to Mexico were $92.7 billion. Dallas Fed economists believe that the trading relationship with Mexico has helped various industries in Texas[5] (as well as the U.S.) gain global competitiveness. If this trading relationship were severely weakened, it’s our judgment that the U.S. would lose competitiveness and that jobs would be lost to other parts of the world, particularly Asia. In addition, Texas border cities have benefited tremendously from the increasing U.S.–Mexico economic integration—leading to job gains, primarily in service sectors, that have resulted in higher wages and improved standards of living for many Texans.[6]
The U.S.
GDP in the U.S. is estimated to have grown at a 0.7 percent rate in the first quarter of 2017. This disappointing level of growth was due to weak growth in consumer spending as well as a significant inventory deceleration.
Despite this poor start to the year, our Dallas Fed economists expect GDP growth of approximately 2.25 percent in 2017. The key underpinning of our forecast is our expectation of a strong U.S. consumer. The U.S. consumer has spent the past nine years deleveraging from record levels of debt to GDP and is today in relatively good financial shape and, as a result, has capacity to spend.
In addition to a strong consumer, we also expect GDP growth in 2017 to be bolstered by some improvement in the level of nonresidential fixed business investment. We expect that our estimate of GDP growth, while sluggish by historical standards, will be sufficient to remove remaining slack from the labor market.
Potential changes in fiscal policy and structural reforms have the potential to provide upside to this forecast. However, I am also closely monitoring the potential negative effects of policies that could reduce the affordability of and access to health care, and policies that could negatively influence the spending habits of immigrants who reside in the U.S. Policy uncertainty in these key areas and the rhetoric associated with the public debate regarding these potential policies bear watching as our economists assess the propensity of consumers to spend versus save.
Unemployment
We are making good progress toward reaching our full-employment objective. The most recent April jobs report showed an increase of 211,000 jobs and a decline in the headline unemployment rate to 4.4 percent. This report is consistent with the three-, six- and nine-month average gains of approximately 180,000 new jobs per month. As we move forward, I would not be surprised if the average rate of job growth slowed somewhat, consistent with a declining level of labor slack in the economy.
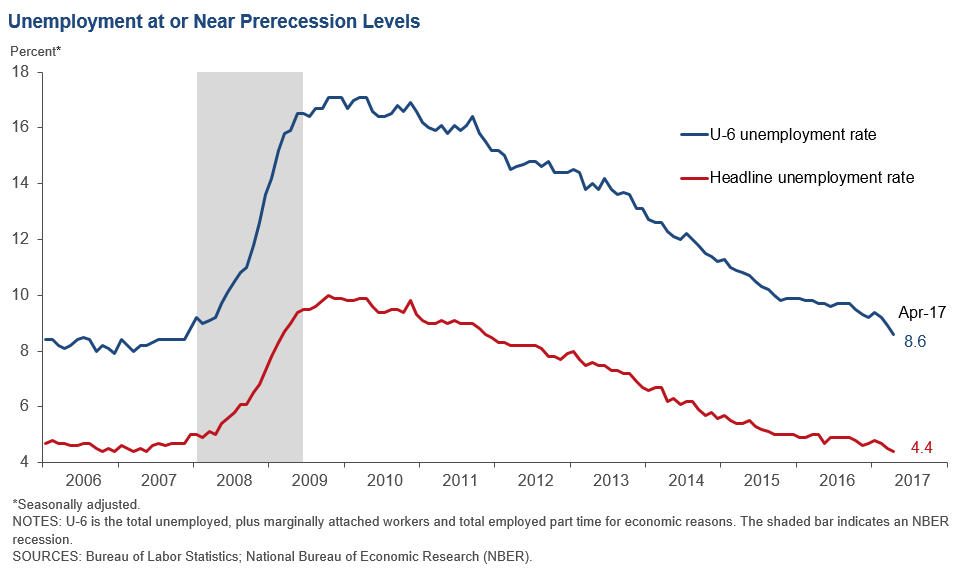
In addition to the headline unemployment rate, my economic team looks at several measures of labor market slack, including estimates of discouraged workers and people working part time for economic reasons (otherwise known as U-6 unemployment), as well as the labor force participation rate.
U-6 unemployment (see chart below) now stands at 8.6 percent, which compares with a prerecession low of 8.1 percent. Looking at this historical data suggests to me that we are moving very close to full employment in the U.S.
In addition to U-6, we also closely look at the labor force participation rate, which now stands at 62.9 percent. This compares with a participation rate of 66 percent in 2007. Our economists believe that a majority of the decline in participation is due to the aging of the population. This aging trend is expected to continue in the U.S. as well as across almost all advanced economies. Over the next 10 years, we estimate that, due to aging of the workforce, the U.S. participation rate will decline to below 61 percent.[7]
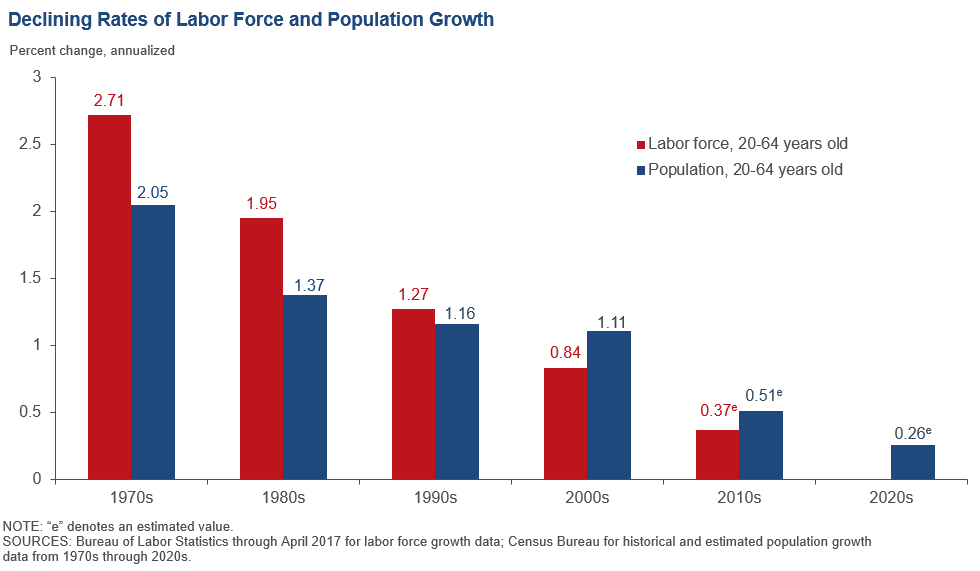
The net impact of this aging trend has been, and is likely to be in the future, a reduction in the rate of labor force growth. You can see from the chart (below) that, beginning in the 2000s, population growth among those 20 to 64 years old has outpaced overall labor force growth. This trend has been due to a steadily increasing percentage of the 55–64 population within the 20–64 age range as well as a slowdown in the rate at which women have been entering the workforce. Dallas Fed economists expect these trends to continue as we head toward the 2020s.
Because GDP growth is comprised of growth in the workforce plus gains in productivity, weaker expected workforce growth trends will likely have significant negative implications for potential GDP growth in the years ahead—unless we take steps to mitigate these effects.
Tackling the Skills Gap in the U.S.
When we look at measures of discouraged workers and those who are working part time for economic reasons, I would note the high correlation between participation rates (as well as unemployment rates) and levels of educational attainment. The labor force participation rate for prime-age workers is approximately 88 percent for college graduates and 81 percent for those who have attended some college. However, prime-age worker participation is only 76 percent for those with a high school diploma and only 66 percent for those who have less than a high school diploma.
Our economists at the Dallas Fed believe that the skills gap in the U.S. is substantial. The National Federation of Independent Business reports that as of April 2017, 48 percent of small businesses indicated that they were unable to find qualified applicants to fill job openings. CEOs report difficulty in hiring workers for middle-class-wage jobs such as nurses, construction workers, truck drivers, oilfield workers, automotive technicians, industrial technicians, heavy equipment operators, computer network support specialists, web developers and insurance specialists. When these types of jobs go unfilled, U.S. businesses expand more slowly and the nation’s growth is impeded.
This is why I have been regularly talking about the need for the U.S. to do much more to beef up public/private partnerships that focus on skills training in order to help workers attain the skills needed to find employment in the 21st-century economy. We also need to invest in programs that improve early-childhood literacy and generally enhance the level of educational attainment among our younger population. Both of these types of initiatives have the added benefit of helping to potentially reduce income inequality by creating broader workforce productivity gains and prosperity.
Inflation
Progress toward reaching our 2 percent inflation objective has been slow over the past several years. I believe this has likely been due to a rising dollar and weaker energy prices, as well as a number of persistent secular forces, such as globalization and technology-enabled disruption (see “Broader Secular Trends” below).
Twelve-month measures of headline and core inflation fell in March. Inflation readings, to date, for April show further weakness. While I believe that these recent readings are likely not indicative of a weakening trend, I intend to be patient and open minded in assessing upcoming data releases in this regard.
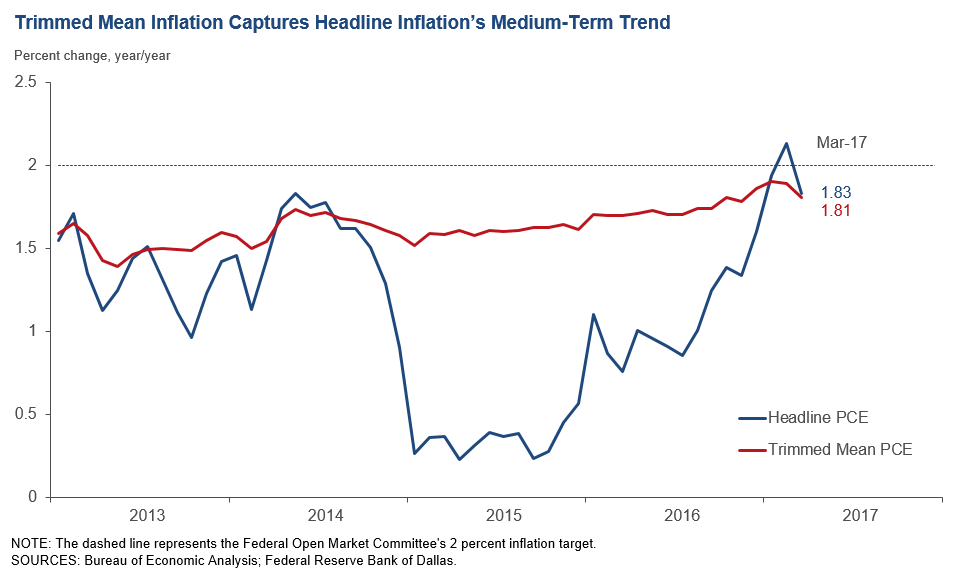
In order to analyze inflation trends, our economists look at headline inflation but also track several measures of core inflation. In particular, Dallas Fed economists closely monitor our Dallas Fed Trimmed Mean PCE inflation rate (see chart below). This measure trims out the most extreme upward and downward monthly price movements and, our economists believe, represents a more reliable indicator of the trend of inflation. This measure gradually increased from 1.7 to 1.8 percent through most of 2016 and ran at approximately 1.6 percent in 2015. Through March, it is running at approximately 1.8 percent on a 12-month basis after having touched 1.9 percent in January and February. The gradual upward trend of this measure has given me confidence that, as slack continues to be removed from the labor market, headline inflation should reach, or exceed, the Fed’s 2 percent longer-run objective in the medium term. I will be closely watching this measure in the months ahead in order to confirm that we are continuing to make progress in reaching our inflation objective.
Non-U.S.
In assessing economic conditions in the U.S., my research team closely monitors economic developments outside the U.S. to evaluate how these developments might impact economic growth domestically. In this regard, we are closely watching the impact of Brexit on the U.K. and European economies as well as monitoring new developments in Europe. At this stage, I believe that the impact of Brexit is likely to be manageable for the U.S., although we are continuing to carefully monitor political developments and other policy decisions that could create a risk of contagion among other European countries.
We also monitor emerging-market countries, particularly China. China has a high degree of overcapacity (particularly in state-owned enterprises) and high and growing levels of debt. The nation is also in the midst of a multiyear transition from being a manufacturing- and export-driven economy to one that is based on consumer spending and services. This transition is likely to take many years, and the world is going to have to become accustomed to lower rates of Chinese growth. In the meantime, China has worked to manage capital outflows and currency volatility. As we saw in the first quarter of 2016, this situation has the potential to create periods of financial market volatility and lead to bouts of tightening in global financial conditions, which could, in turn, slow economic growth in the U.S.
Broader Secular Trends
In addition to monitoring cyclical trends, my economic research team carefully considers and works to understand several key secular drivers. As I have emphasized over the past year, these drivers are likely having a powerful influence on unfolding economic conditions.
I have particularly focused on four key secular drivers:
- Aging-workforce demographics in the U.S. and across major economies. As discussed earlier, aging-population trends, on balance, reduce labor force participation rates and ultimately create headwinds for potential GDP growth. These demographic trends are also likely to impact the “dependency ratio”[8]—that is, they are likely to lead to a situation in which an increasing share of the population is depending on those of working age to pay for future medical and retirement benefits. These trends are likely to exacerbate the issues regarding the sustainability of U.S. government fiscal obligations (discussed further below).
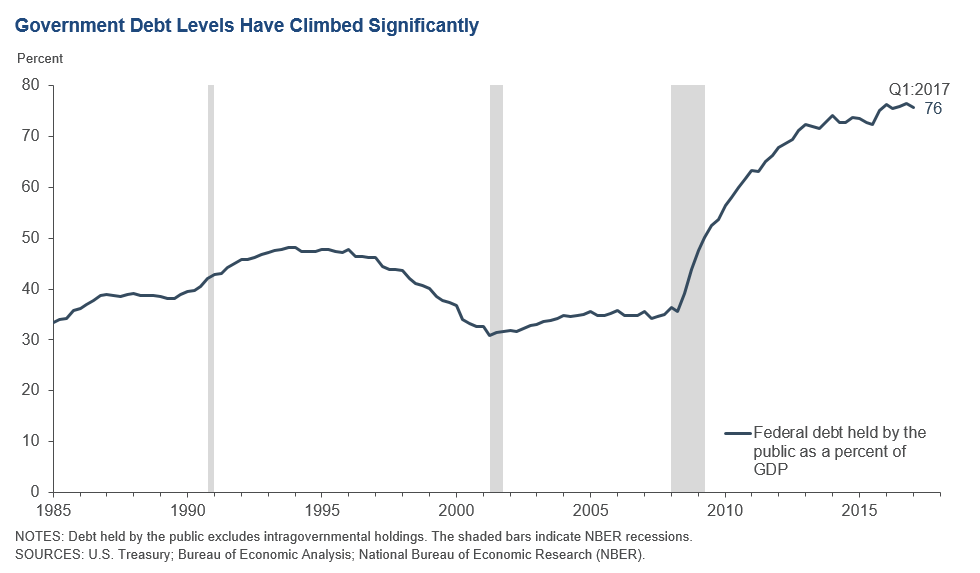
- Limits to the sustainability of the so-called global debt super cycle. Historically, the U.S. and other countries have used increasing debt—often through tax cuts and increased government spending—to boost economic growth. At this point, there are likely limits to the ability of countries, including the U.S., to further increase debt to GDP in order to generate higher levels of economic growth. As I discussed earlier in this essay, we have seen a deleveraging of the U.S. household sector since 2008. This has likely created some headwinds for economic growth over the past several years. The good news is that the household sector is in much better shape today. However, while household balance sheets have improved since the Great Recession, government debt held by the public stands at approximately 76 percent of GDP (see chart below), and the present value of future unfunded entitlements is now estimated at $46 trillion.[9] These obligations will increasingly work their way into U.S. budget deficits over the next five to 10 years—raising questions regarding fiscal sustainability which, if not addressed, could negatively impact longer-run economic growth.
- Globalization. Economies, financial markets and companies are more closely intertwined than ever before. For example, regarding trade, estimates indicate that approximately 40 percent of the content of U.S. imports from Mexico is of U.S. origin.[10] This is because much of this trade is related to integrated supply chains and logistical arrangements between U.S. and Mexican companies. As mentioned earlier, it is our view at the Dallas Fed that these arrangements have helped improve U.S. competitiveness and created jobs in the U.S. Without these arrangements, these jobs might have otherwise been lost to other areas of the world, particularly Asia.
While trade and globalization have yielded net economic benefits for the U.S. economy, they have also created severe local hardships that the U.S. and other advanced economies have struggled to address. The challenge is how to reap the benefits of globalization while addressing the disruptions it creates—failing to do so is likely to have negative implications for trade and the pace of economic growth in the U.S. and globally. - Technology-enabled disruption. In order to improve their competiveness, many companies are actively investing in technology, which is leading to a significant reduction in the number of workers needed to produce goods and services. The result is that U.S. workers across a range of industries are finding their jobs being eliminated.
Many industries are facing a disruptive competitor that is offering lower-cost goods or services. Think the digital camera versus the old film industry, Amazon versus retail stores, Kahn Academy versus brick-and-mortar schools, 3-D printing versus traditional manufacturing, Uber versus taxis and so on. This technology-enabled disruption has allowed consumers to achieve better value and more easily shop for merchandise and services in a way that lets them easily choose the lowest price. It has also reduced the pricing power of many companies and caused them to intensify their focus on creating greater operational efficiencies.
I believe that the dislocations resulting from technology-enabled disruption are sometimes confused with the impacts of globalization. This is a powerful trend, apart from globalization, which may help explain why the rate of employment among prime-age workers in the U.S. has not recovered to prerecession levels. It may also help explain why companies have been more hesitant to make capacity expansion decisions as well as invest in major capital projects.
In light of these secular trends and the sluggish economic growth over the past several years, I have been speaking the past several months about the need for structural reforms and fiscal policy to join the menu of economic policy. Monetary policy is not designed, by itself, to address the key structural challenges we face today stemming from changing demographic trends and lower levels of productivity growth, as well as dislocations created by globalization and increasing rates of technology-enabled disruption. While monetary policy has a key role to play, it is not a substitute for structural reforms and other actions that could address deeper fundamental challenges.
The primary prism I use to judge new structural reforms and potential fiscal policies is whether they help grow the labor force and/or improve productivity growth in the U.S. GDP growth is comprised of these two components, and I believe potential new policies should be judged in the context of whether they create sustainable improvement in these measures.
The Current Stance of Monetary Policy
As I mentioned earlier in this essay, I believe that we are making good progress in accomplishing our dual-mandate objectives of full employment and price stability. However, I am cognizant that progress toward our 2 percent inflation goal has been slow and, at times, uneven. I intend to be patient in critically assessing upcoming data to evaluate whether we are continuing to make progress in reaching our inflation objective.
I have consistently stated that I believe there is a cost to excessive accommodation in terms of limiting returns to savers, as well as creating distortions and imbalances in investing, hiring and other business decisions. Monetary policy accommodation is not costless. It has been my experience that significant imbalances are often easier to recognize in hindsight and can be very painful to address.
However, I also believe that the key secular drivers discussed earlier in this essay will continue to pose challenges for economic growth. As a result, my view is that the neutral rate, the rate at which we are neither accommodative nor restrictive, is likely to be much lower than we are historically accustomed.
Based on these considerations, I have argued that future removals of accommodation should be done in a gradual and patient manner. In that regard, I continue to believe that three rate increases for 2017, including the March increase, is an appropriate baseline case for the near-term path of the federal funds rate.
“Gradual and patient” means to me that I need to be open to assessing incoming economic information in order to update my analysis regarding the appropriate stance of economic policy. I will avoid being rigid or unduly predetermined in my views. If I see information that suggests the economy is developing more slowly than I expect, then the pace of rate increases could be slower than my baseline path, and if economic growth is stronger than I expect, the pace of increases could be faster.
In addition, as we make further progress in removing accommodation, I believe we should begin the process of gradually reducing the size of the Federal Reserve balance sheet. I think it will likely be appropriate to begin this process sometime later this year.
Notes
The views expressed by the author do not necessarily reflect official positions of the Federal Reserve System.
| 1. | Bureau of Economic Analysis, Fourth Quarter 2016. |
| 2. | Based on the Drilling Productivity Report, Energy Information Administration, May 15, 2017. |
| 3. | Census Bureau. |
| 4. | “Texas Border Cities Illustrate Benefits and Challenges of Trade,” by Jesus Cañas, Federal Reserve Bank of Dallas Southwest Economy, Fourth Quarter, 2016. Also see “Jobs Supported by State Exports 2015,” by Jeffrey Hall and Chris Rasmussen, Office of Trade and Economic Analysis, International Trade Administration, U.S. Department of Commerce, May 31, 2016. |
| 5. | “Texas Comparative Advantage and Manufacturing Exports,” by Jesus Cañas, Luis Bernardo Torres and Christina English, in Ten-Gallon Economy: Sizing Up Texas’ Economic Growth, Pia M. Orrenius, Jesus Cañas and Michael Weiss, eds., New York: Palgrave MacMillan, 2015. |
| 6. | “So Close to Mexico: Economic Spillovers Along the Texas–Mexico Border,” by Roberto Coronado, Marycruz De León and Eduardo Saucedo, in Ten-Gallon Economy: Sizing Up Texas’ Economic Growth, Pia M. Orrenius, Jesus Cañas and Michael Weiss, eds., New York: Palgrave MacMillan, 2015. Also see “El Paso and Texas Border Cities Close the Gap in Per Capita Income,” by Roberto Coronado and Robert W Gilmer, Crossroads, Issue 2, 2012. |
| 7. | “Labor Force Projections to 2024: The Labor Force Is Growing, but Slowly,” Monthly Labor Review, Bureau of Labor Statistics, December 2015, www.bls.gov/opub/mlr/2015/article/labor-force-projections-to-2024.htm. |
| 8. | “Global Demographic Trends Shape Policy Environment,” by Mark Wynne, Federal Reserve Bank of Dallas Economic Letter, vol. 11, no. 7, 2016. |
| 9. | 2016 Annual Report of the Boards of Trustees of the Federal Hospital Insurance and Federal Supplementary Medical Insurance Trust Funds, June 22, 2016. |
| 10. | Give Credit Where Credit is Due: Tracing Value Added in Global Production Chains,” by Robert Koopman, William Powers, Zhi Wang and Shang-Jin Wei, National Bureau of Economic Research, NBER Working Paper no. 16426, December 2011. |
About the Author
Robert S. Kaplan was president and CEO of the Federal Reserve Bank of Dallas, 2015–21.