Trade relationships affect U.S. dollar appreciation’s impact across states
The value of the U.S. dollar against other currencies has appreciated, making most goods produced in the U.S. more expensive overseas during the past year. By looking at state-specific export-weighted real (inflation-adjusted) exchange rates, some states clearly face greater challenges than others amid the dollar’s varying gains relative to other currencies.
This variability is sometimes lost in the U.S. real trade-weighted value of the dollar produced by the Federal Reserve Board, which provides a good guide for the overall strength of the dollar.
The relationship between the value of the dollar and international trade is complex. Economists describe it as endogenous because the value of the dollar and trade are often jointly determined by factors such as the supply and demand for goods and services as well as the supply and demand for international investment.
Nonetheless, an increase in the value of the dollar makes the price of goods produced in the U.S. more expensive relative to goods produced in other countries, leading to less demand than if the dollar had not appreciated.
Value of dollar and economic growth
Manufacturing accounts for a large share of exports from the top exporting states. For instance, in Texas, the nation’s top exporting state, the share is approximately 78.5 percent of all exports.
The relationship between changes in a state’s real trade-weighted value of the dollar (RTWVD) and its future economic growth can be tested statistically. Past research for Texas shows that an increased RTWVD has been followed by slowing state job growth.
The impact of changes in the dollar on a state’s economic growth varies due to two primary factors: 1) the importance of exports to the state’s economy, and 2) the countries to which the state exports.
The first can be measured by using an estimate of the share of private sector jobs by state that are tied to exports. The U.S. International Trade Administration produces such data. The second factor can be measured using the Dallas Fed’s state-level RTWVD estimates.
These measures weight the real exchange rate of the U.S. dollar relative to a trading partner’s currency by the state’s export share to that country. It is based on the top 30 countries to which a state exports. As an example, an increase in the real value of the peso will affect Texas and New York differently: As of fourth quarter 2018, Mexico accounted for roughly 34 percent of Texas exports but only 4 percent of New York exports.
Tracking variance among states
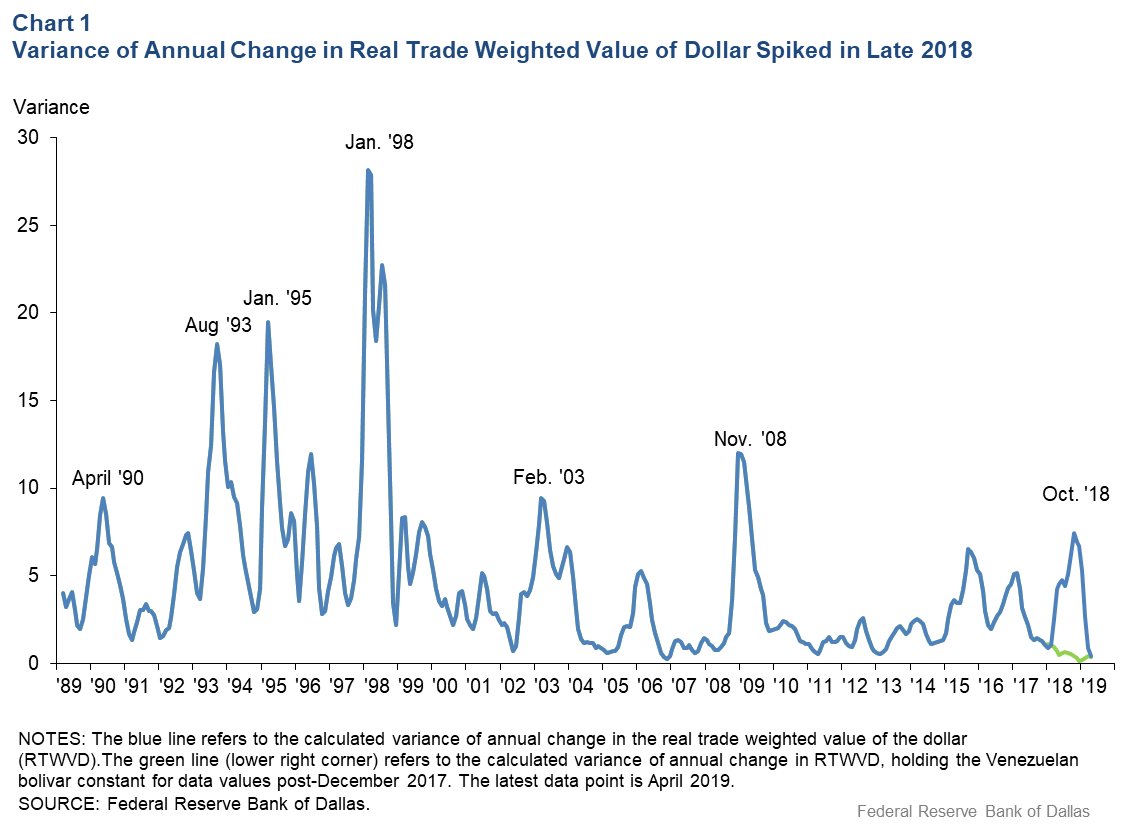
To summarize the differences in the broad movement of the state RTWVDs, we calculate, for each month, the variance across all states in the year-over-year change in the three-month moving average (Chart 1). If the movement of the RTWVDs over time in each state were the same, the line would be fixed at zero and there would be no need for separate state estimates.
As the chart shows, movements of the RTWVDs vary quite noticeably and at certain points can vary sharply. Some spikes are due to broad-based differentials across states, such as during the Asian crisis in the late 1990s and during the Great Recession in 2008–09. Some are narrowly concentrated, such as in 2003, when the Brazilian real depreciated sharply, primarily affecting Florida’s RTWVD. Depreciation of the Venezuelan bolivar is responsible for much of the recent spike in the variance across states.
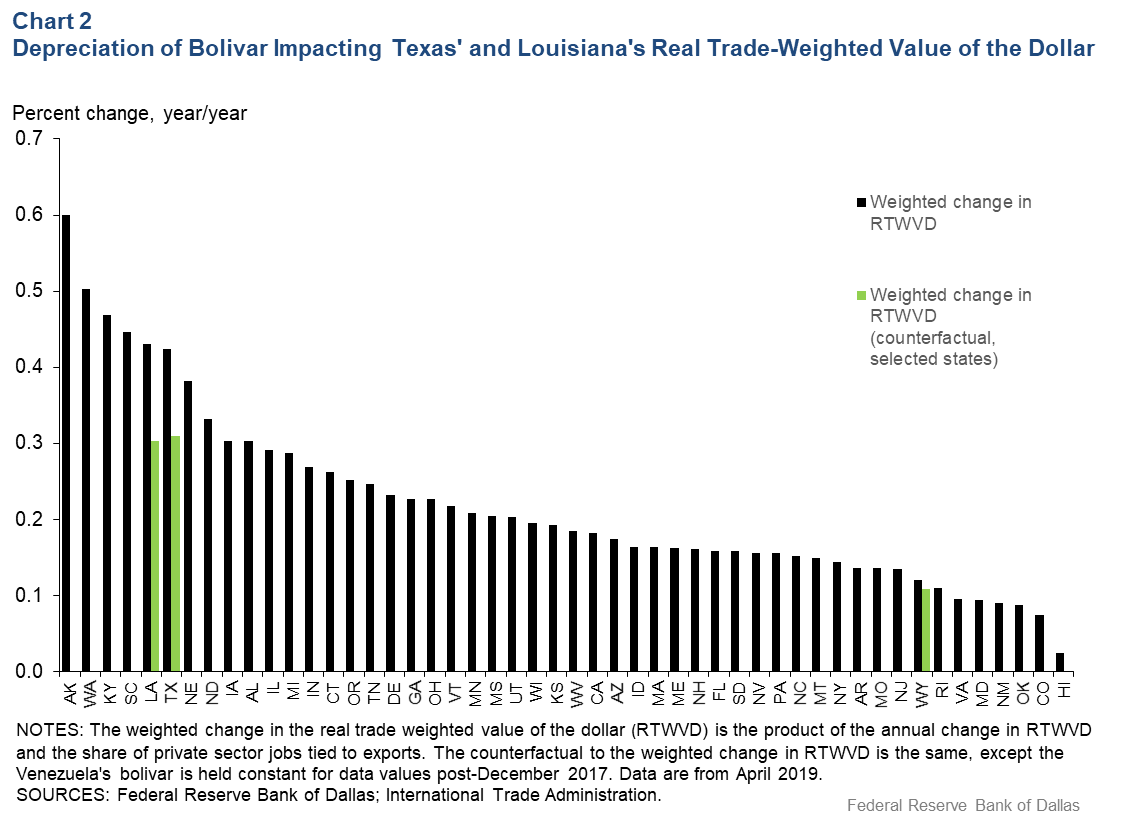
The Federal Reserve Board’s real trade-weighted value of dollar for goods increased 3.9 percent in the 12 months through May 2019. Overall, the appreciation against most foreign currencies increased the RTWVD for all states. States likely facing the largest impact from the dollar appreciation are shown on the left side of Chart 2, where the black bars represent the percent change in the RTWVD weighted by the percentage of the state’s jobs tied to exports.
The impact of Venezuela
The top six states potentially facing the greatest impact from appreciation of the dollar are Alaska, Washington, Kentucky, South Carolina, Louisiana and Texas. Interestingly, the RTWVDs of Louisiana and Texas contain the Venezuelan bolivar, with Wyoming the only other state with bolivar exposure.
Although the export weight is less than 2 percent in Louisiana, Texas and Wyoming, the real value of the dollar against the bolivar appreciated 689 percent in the 12 months ended October 2018 and 91 percent in the 12 months ended in April 2019. Interestingly, U.S. exports (primarily petroleum and coal products) to Venezuela increased through December 2018 but have since declined by 70 percent through March. This large decline is likely due to currency devaluation and, more recently, to U.S. trade sanctions imposed in January.
To isolate the impacts of the bolivar’s collapse, we hold its value constant since December 2017. As shown by the short green line in Chart 1, all of the increase in the variance across states since then has been due to bolivar depreciation. However, as shown in the chart, the bolivar’s impact on the variance across states was very small by April 2019.
In Chart 2, the green bars are the weighted appreciation of the dollar for the three states, holding the real exchange rate with Venezuela constant. Adjusting for depreciation of the bolivar paints a slightly different picture.
Texas falls to seventh place and Louisiana to eighth after the bolivar adjustment. Had this adjustment been undertaken in October 2018, the Texas TWVD would have appreciated only .21 percent instead of 1.1 percent; the appreciation for Louisiana would have been .18 percent instead of 1.1 percent.
About the Authors

Keith R. Phillips
Phillips is an assistant vice president and senior economist in the San Antonio Branch at the Federal Reserve Bank of Dallas.

Judy Teng
Teng is a research assistant in the San Antonio Branch at the Federal Reserve Bank of Dallas.
The views expressed are those of the authors and should not be attributed to the Federal Reserve Bank of Dallas or the Federal Reserve System.