
U.S. economic rebound uneven amid resurgent local COVID-19 outbreaks
Americans sharply reduced their mobility in late March and early April, staying at home to avoid COVID-19 infection. As mobility and economic activity resumed in the latter half of April and into May, the renewed movement didn’t appear to reflect local infection rates.
That pattern changed the following month. Across states, a strong relationship seems to have developed between local COVID-19 cases and mobility. Mobility has declined in states experiencing a rising rate of new cases, while mobility has increased in states that saw a relatively high incidence earlier in the pandemic but an easing in recent weeks.
Economic activity has exhibited a similar response to COVID-19 outbreaks. Thus, the economic recovery going forward is likely to be geographically uneven, dictated by local infection conditions. A full recovery to pre-pandemic levels of economic activity appears unlikely until the virus is under control.Tracking relationship between infection cases and mobility
The Federal Reserve Bank of Dallas developed the Mobility and Engagement Index (MEI), using geolocation data provided by SafeGraph, a geospatial data analysis firm. It is a measure of the deviation from normal mobility behaviors resulting from COVID-19 (Chart 1).
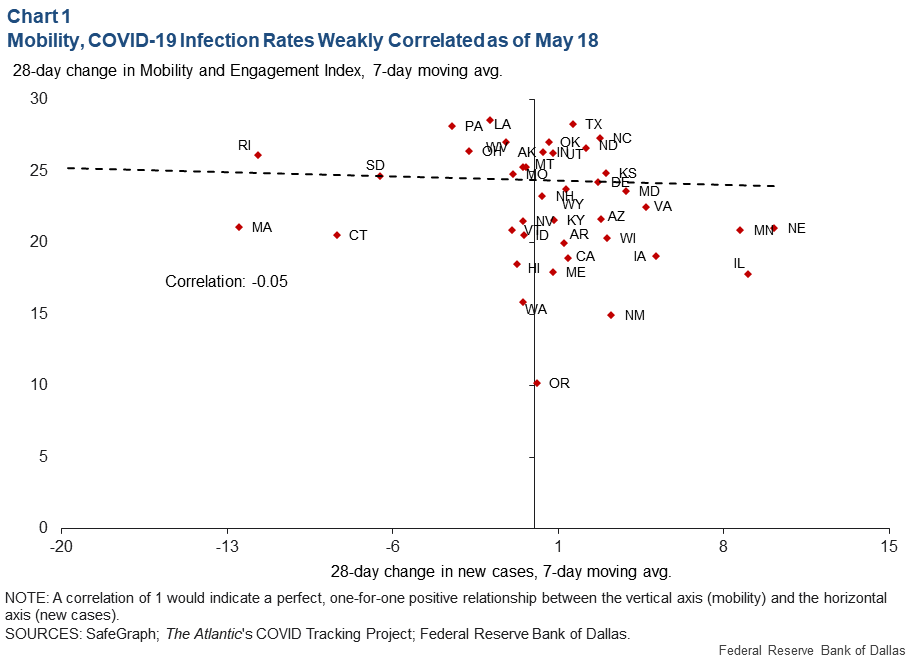
Chart 1 illustrates that increases in mobility were universal across states—MEI values are all positive—and that states with declining infection rates were not necessarily the same ones experiencing the most rapid mobility increases as of May 18. The correlation coefficient of -0.05 indicates no relationship—1.0 would indicate a perfect correlation. This is surprising and may reflect that behavior was more responsive to national infection conditions than to local ones.
Strengthening state-level response to COVID-19
By July 18, states that had experienced increasing rates of infection in the second half of June also experienced the largest drops in mobility (Chart 2).
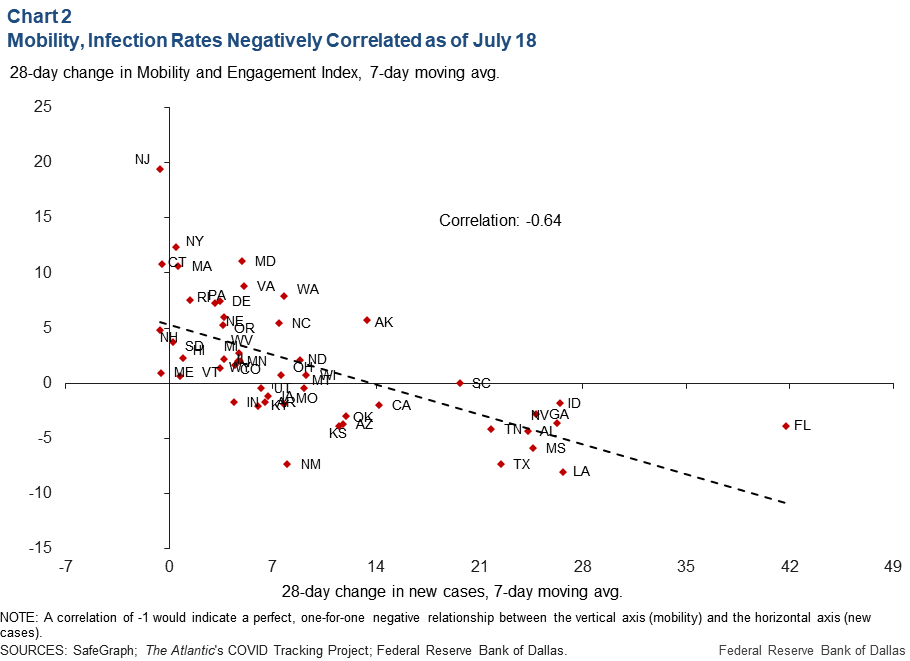
As Chart 1 shows, the correlation between mobility and infection rates was weak in mid-May, implying that at an aggregate level, state mobility was minimally changing in response to local infection rates. This relationship has since evolved, as Chart 2 indicates. Infection rates are more dispersed across states and the correlation is now more strongly negative, with a correlation coefficient of -0.64.
This points to mobility becoming more closely tied to local infection rates than a few months prior.
High-frequency indicators exhibit similar behavior
Chart 3 shows the day-by-day evolution of the correlation between the four-week change in COVID-19 infection rates and the four-week change in high-frequency indicators of economic activity.
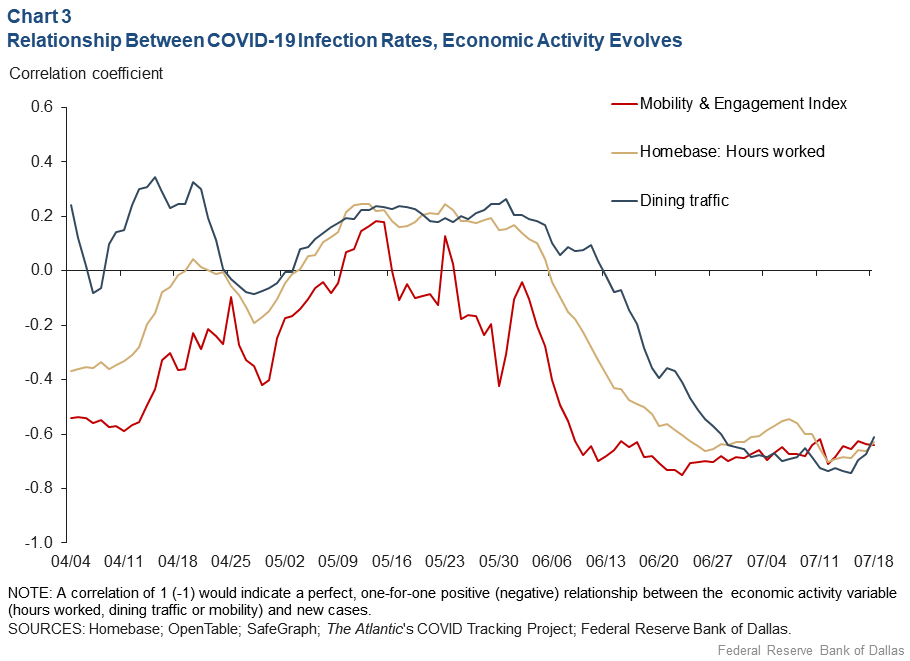
The MEI, dining traffic and hours worked exhibit similar patterns. Dining traffic is measured as seated diners at a sample of restaurants on the OpenTable restaurant reservations network. Hours worked is the percent change from January in hours worked by hourly employees at businesses that use Homebase software.
The message in Chart 3 is consistent with that of the previous figures. Early in the response to the pandemic, there was little consistency in the relationship between infection rate changes and increased activity. Near the end of May and through June, these correlations have trended consistently negative, indicating that states with increasing rates of infection saw mobility and economic activity slowing at a greater rate.
In other words, the response to infection rates has become more localized. For the four weeks ended July 18, the relationship remained consistent and strongly negative.
Notably, the MEI and hours worked lines in Chart 3 were negative in mid-April as mobility hit a low point, driven largely by the hardest-hit states in the northeastern U.S. This proved to be transitory in May. The relationship between the two-week change in infections and two-week change in economic activity indicates a weaker relationship in July. However, the four-week change smooths out possible noise to reveal a relationship that is more stable over time.
Positioning for an uneven U.S. recovery
In May, there was a sense that the nation as a whole had endured the worst of the COVID-19 crisis, with new infections declining enough to prompt a broad-based bounce in mobility and economic activity. Now, as infections rise in some regions, Americans are responding to what they see in their own communities.
This change in behavior has implications for the economic outlook. The positive is that regions with improving health situations—such as the Northeast—may continue to experience accelerating mobility and economic activity despite a worsening national infection rate. The negative implication is that the recoveries in regions experiencing rapidly rising levels of COVID-19 cases will likely stagnate or head back down.
For the national economy, this implies a slower, more uneven path, with a full nationwide recovery not possible until new infections are brought under control.
About the Authors

Tyler Atkinson
Atkinson is a business economist in the Research Department at the Federal Reserve Bank of Dallas.

Jackson Crawford
Crawford is a research analyst in the Research Department at the Federal Reserve Bank of Dallas

Sam Dannels
Dannels is a research analyst in the Research Department at the Federal Reserve Bank of Dallas.

Andrew Gross
Gross is a research analyst in the Research Department at the Federal Reserve Bank of Dallas.
The views expressed are those of the authors and should not be attributed to the Federal Reserve Bank of Dallas or the Federal Reserve System.