
A tale of boom and bust: What drives dry bulk freight rates?
As events in the past year have amply demonstrated, volatility in shipping markets is very much back after a period of relative tranquility. Thus, the Baltic Exchange Dry Index, a measure of shipping costs, nearly quadrupled from January to June 2020 as the shocks of COVID-19 first ravaged, then propelled international trade in bulk commodities. Even one-time events, such as the Suez Canal blockage in late March 2021, suddenly roiled global shipping markets.
A new Dallas Fed working paper analyzes the drivers of global dry bulk freight rates from 1850 to 2020 based on a new and large dataset. It finds that freight rates followed a downward but undulating path, with a cumulative 79 percent decline. Shipping demand shocks strongly dominate all other shocks as drivers of freight rates’ booms and busts. As shipping demand shocks increased in importance over time, shipping supply shocks became less relevant.
Dry bulk freight rates from 1850 to 2020
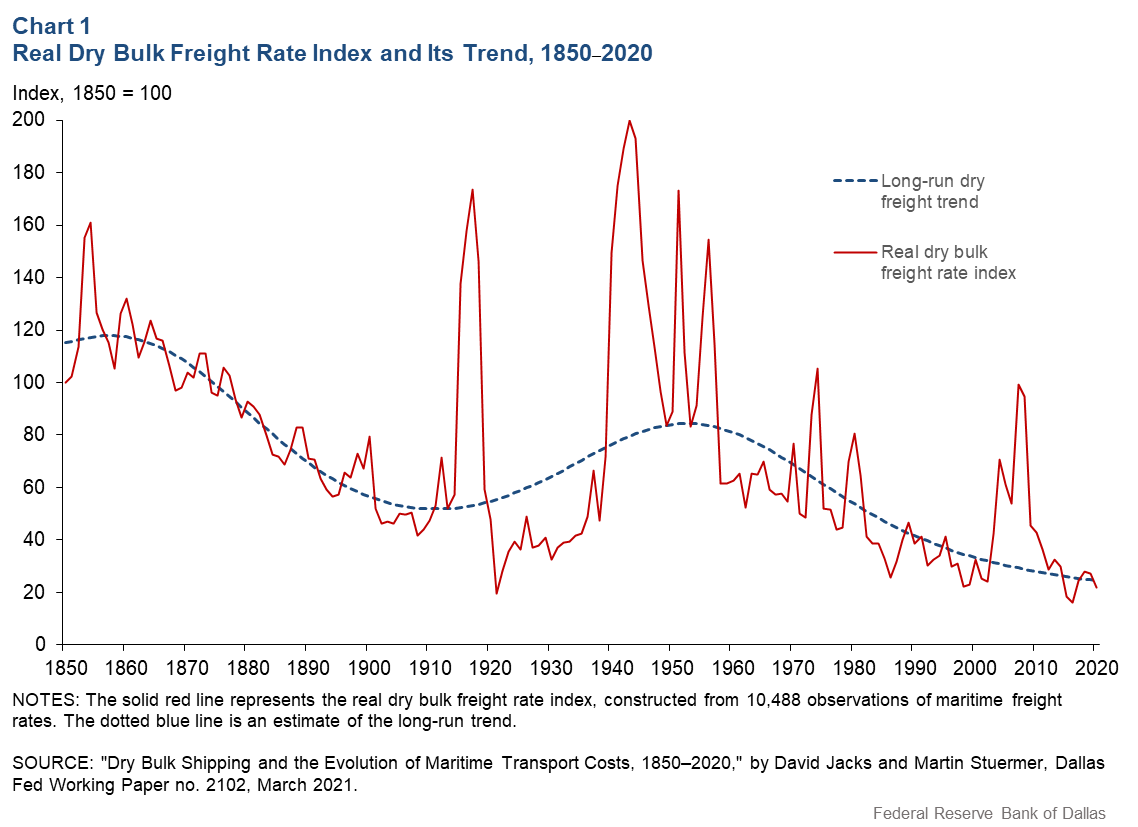
One of the paper’s main contributions is the longest consistently measured and continuous series on global dry bulk freight rates (Chart 1). Dry bulk refers to commodity cargo such coal, grains and ore that is shipped in large, unpackaged parcels. This sector represents roughly 50 percent of world trade by volume today, looming large in our understanding of the global economy and shipping markets and their co-evolution. (By comparison, many finished goods are transported in container vessels.)
On a downward but undulating trend
Real (inflation-adjusted) dry bulk freight rates are estimated to have followed a downward though undulating path, falling 55 percent from 1850 to 1910, rising 62 percent from 1910 to 1950 and falling 71 percent since 1950. Overall, the rates experienced a cumulative decline of 79 percent in the 1850–2020 period.
Behind these slowly evolving trends, there were also often abrupt movements, with real dry bulk freight rates in some instances nearly tripling on a year-over-year basis. We relate this secular decline to developments documented in the historical academic literature such as significant productivity growth accompanying radical changes in goods handling and storage in ports and in naval architecture affecting the design of ships and propulsion.
Abstracting away from this long-run trend and its potential productivity-related determinants, we narrow our focus to understanding the drivers of booms and busts that occur at a higher frequency. That is, is it possible to rationalize the often-extreme changes we observe in dry bulk freight rates by considering fundamentals in the sector?
Analyzing booms and busts
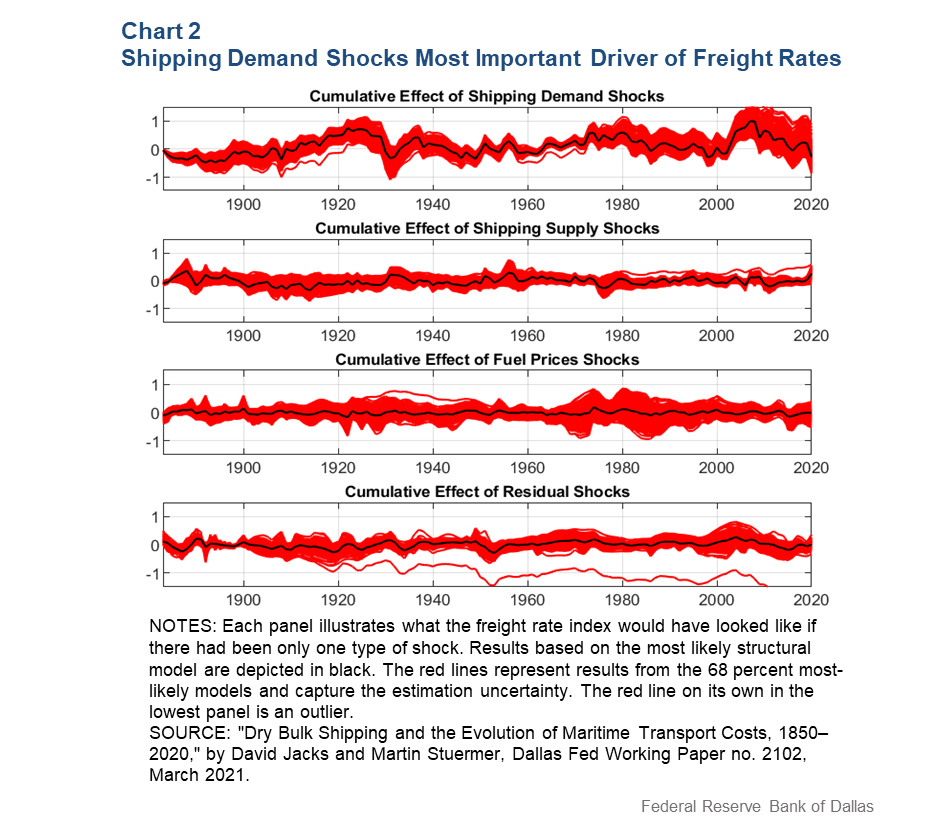
We build on a canonical structural vector autoregressive (VAR) model with sign restrictions—a statistical model that can analyze changes involving the simultaneous behavior of a number of variables—to identify shocks in the dry bulk freight market. Based on assumptions related to supply-and-demand analysis, we decompose the freight rate index into the contributions of four shocks: a shipping demand shock, a shipping supply shock, a fuel price shock and a residual shock.
Chart 2 illustrates the relative importance of each of the four structural shocks in driving dry bulk freight rates. For example, the black line in the upper panel shows how shipping demand shocks led to steep declines in freight rates during the Great Depression in the 1930s and during the recent COVID-19 crisis, based on the most likely model. The red captures the estimation uncertainty around these results. Another way of thinking about the chart is that each of the sub-panels represents a counterfactual simulation of what freight rates would have been had only one particular shock been involved.
Shipping demand shocks are the main driver
Our results indicate that shipping demand shocks strongly dominate as drivers of real dry bulk freight rates over the long run. For the full period, from 1850 to 2020, demand shocks explain 49 percent of the variation in real dry bulk freight rates, while shipping supply shocks account for only 22 percent.
Thus, the two fundamental shocks related to simple supply and demand are responsible for 71 percent of the medium- and long-run variation in real dry bulk freight rates. Fuel price shocks are responsible for 11 percent and residual shocks for 18 percent.
Shipping supply shocks become less important over time
The contribution of shipping demand shocks to the variation in real dry bulk freight rates increased substantially from 44 percent in the pre-World War I period to 56 percent in the interwar years and remained elevated in the post-World War II era, a time of increasing global trade.
In contrast, the contribution of shipping supply shocks decreased substantially in the interwar years and remained suppressed in the post-World War II era. Finally, the contribution of fuel price shocks and residual shocks remained roughly constant through the three sub-periods.
Tailwind for global trade
In the future, freight rates will certainly still be characterized by boom-and bust-periods. If the significant productivity growth of the past continues in goods handling and storage at ports and in naval architecture and propulsion, we will see furtherance of the longer-term downward but undulating path in real freight rates. This will be supportive of international trade going forward.
About the Authors
The views expressed are those of the authors and should not be attributed to the Federal Reserve Bank of Dallas or the Federal Reserve System.