
Private subprime mortgages challenged FHA during 2000s housing boom
The implosion of the subprime private loan securitization (PLS) mortgage market during summer 2007—contributing to the recession that followed—was a defining moment in U.S. financial history. It highlighted the fragility of the marketplace for mortgages that were pooled together into bond-like securities—securitized—and sold to investors.
Since then, considerable research has been devoted to better understanding the meteoric rise of the subprime PLS mortgage market in the early-to-mid 2000s. But an important aspect has been largely ignored: The simultaneous decline in mortgage originations with Federal Housing Administration (FHA) insurance, a product that traditionally served borrowers on the margin of the rent–own decision.
We document the opposite trends for subprime PLS and FHA home-purchase mortgages during the 2000s. We find that a large share of subprime PLS originations violated at least one of the FHA’s underwriting restrictions. This finding is consistent with subprime PLS growth during the 2000s arising from a combination of relaxed underwriting standards by private lenders/investors and increased borrower demand for riskier mortgage products.
FHA, subprime PLS mortgage borrowers share similarities
Borrowers using subprime PLS mortgages frequently had low credit scores and minimal required down payments. This kind of loan also had long been available through lenders participating in the FHA’s mortgage insurance program.
Chart 1 presents median loan-to-value ratios for FHA-insured and subprime PLS home-purchase mortgages originated in 2002–08. For FHA loans, the median ratio was 98 percent for almost the entire period, reflecting a 3.5 percent minimum down payment and a policy allowing borrowers to roll upfront mortgage insurance premiums into the loan balance.
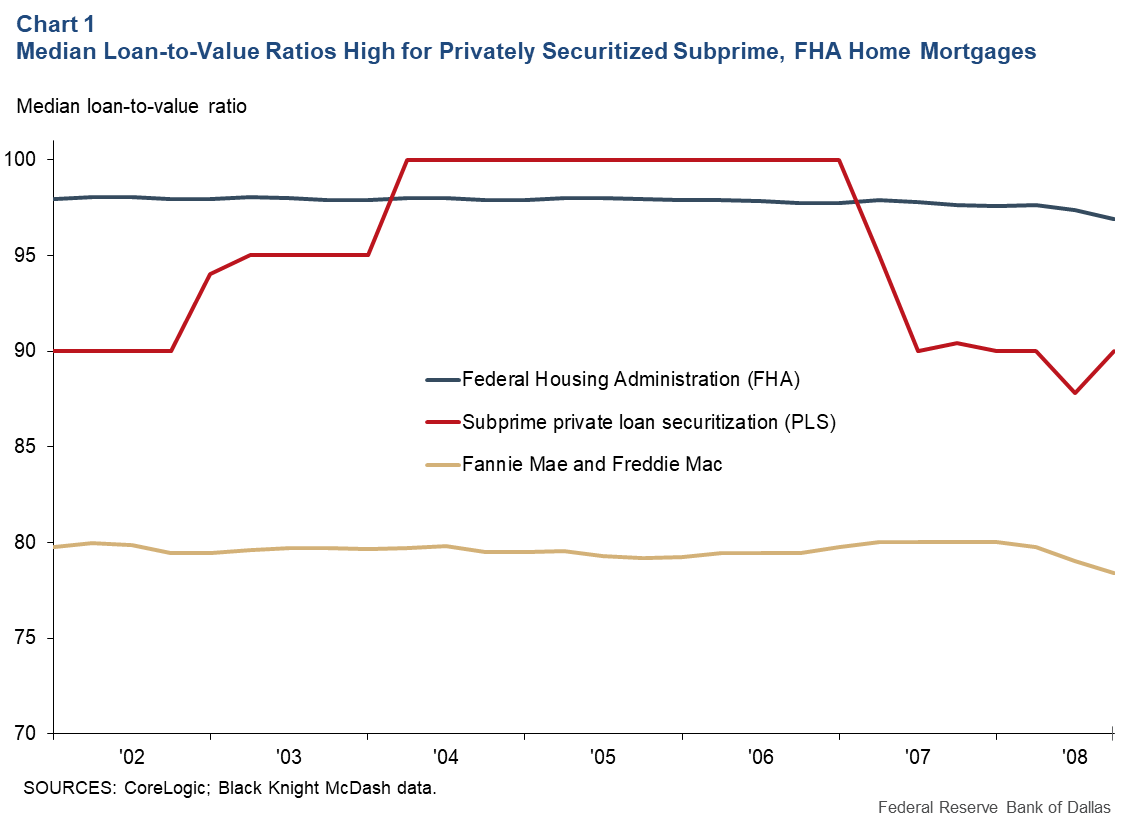
For subprime PLS home-purchase mortgages, the median loan-to-value ratio was more volatile. It started at around 90 percent in 2002, rose to 95 percent in 2003 and peaked at 100 percent during the height of the housing boom, 2004–06. At the onset of the housing bust in 2007, the median subprime loan-to-value ratio retreated to 90 percent.
By comparison, the median loan-to-value ratio for home-purchase mortgages guaranteed by Fannie Mae and Freddie Mac—the government-sponsored enterprises that have traditionally backed the bulk of residential mortgages—held steady at around 80 percent during this time.
Quarterly median credit scores for subprime PLS and FHA home-purchase mortgages tracked very closely through the 2002–06 housing boom. After the private mortgage securitization system collapsed in 2007, credit scores climbed for FHA as well as for Fannie Mae- and Freddie Mac-guaranteed mortgages.
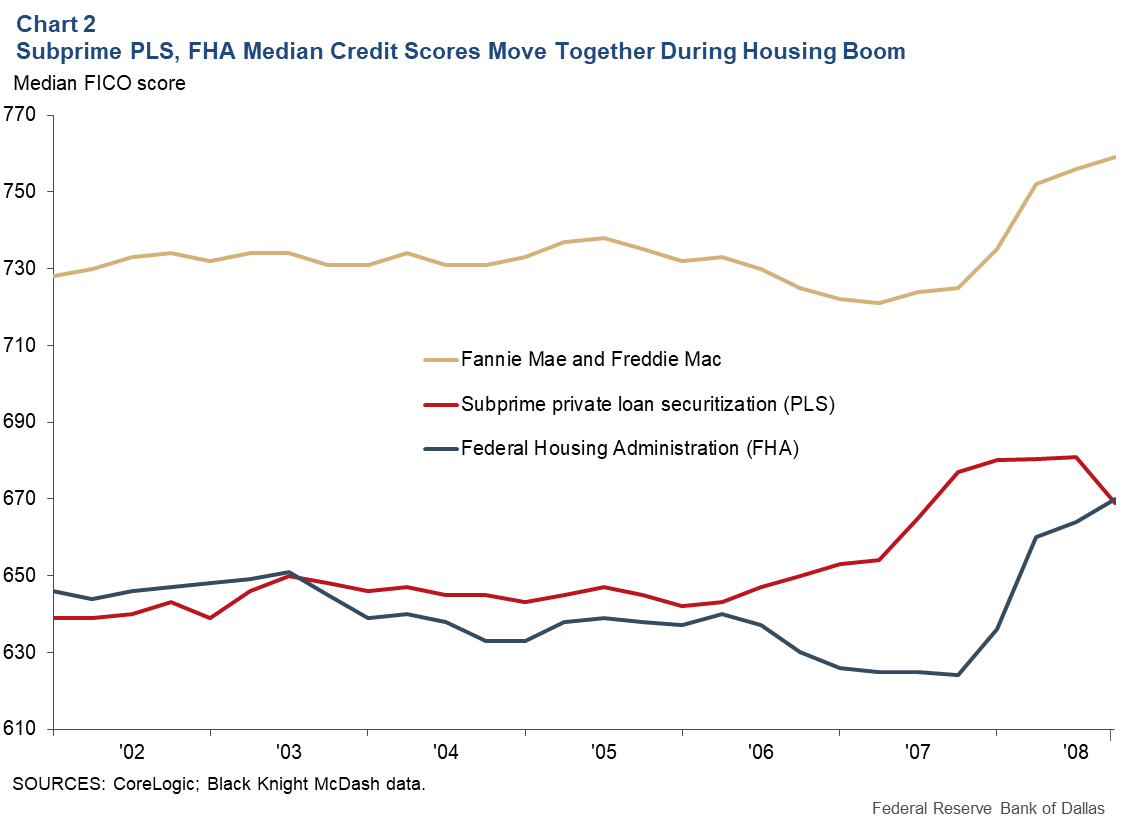
Charts 1 and 2 show how subprime PLS and FHA catered to a similar set of homebuyers with low credit scores who were unwilling or unable to make significant down payments. The figures also make clear that even before the housing boom ramped up, the FHA program was available to borrowers with blemished credit histories and low income/wealth.
FHA, subprime PLS market shares negatively correlated
There is a striking inverse relationship between the market shares of FHA and subprime PLS home-purchase mortgages originated in the contiguous 48 states during 2002–08, data from Home Mortgage Disclosure Act and CoreLogic show (Chart 3).
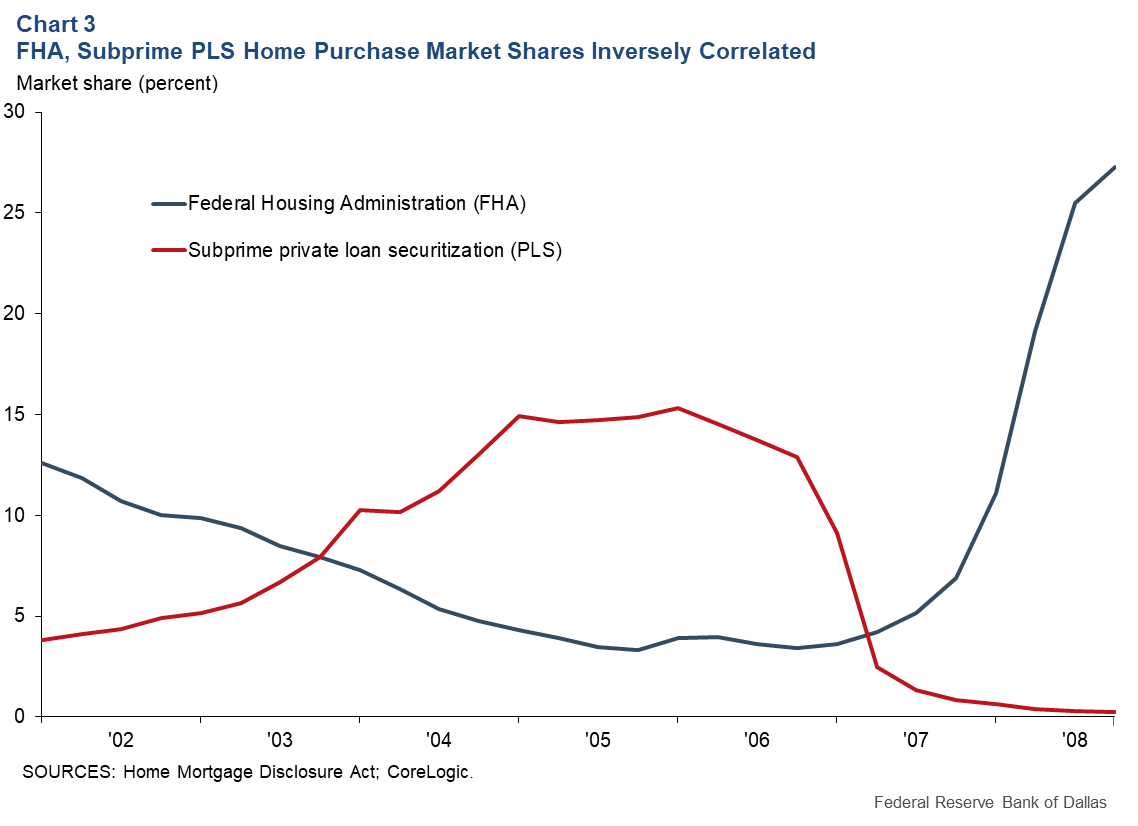
The FHA share began at just below 13 percent in early 2002 and dramatically declined over the course of the housing boom, bottoming out at just above 3 percent in late 2006. By contrast, the subprime PLS share of such mortgages was just below 4 percent in early 2002 but rose to more than 15 percent in 2006. These trends quickly reversed with the onset of the housing bust; the FHA share climbed to 27 percent by year-end 2008 and the subprime PLS share fell to effectively zero.
This inverse relationship was largely unaddressed by academics and policymakers. However, a Mortgage Bankers Association (MBA) member survey about the FHA program in 2006 indicated three reasons for the declining FHA market share:
- Fannie Mae and Freddie Mac had loosened underwriting standards for conventional-conforming mortgages, and subprime PLS loans had become popular.
- FHA lacked a zero-down-payment product.
- FHA’s origination costs were relatively expensive due to a labor-intensive process and longer processing times.
The accompanying report pointed to a factor that wasn’t part of the survey, suggesting that FHA loan limits may have played a role, especially in coastal areas where home price appreciation was extremely high. A 2007 U.S. Government Accountability Office (GAO) report is broadly consistent with the survey results.
Most subprime PLS mortgages were not FHA-eligible
The inverse relationship between the market shares of subprime PLS and FHA home-purchase mortgages during the 2000s is consistent not only with the MBA and GAO reports, but also with a simple substitution story. However, it turns out that a large fraction of the subprime PLS originations would have been ineligible for FHA insurance due to four factors.
First, FHA mortgage insurance is restricted by local area (county) loan limits outlined in the National Housing Act. During the 2000s housing boom, the limit for any given area was set at 95 percent of the median house price in that area. However, the FHA loan limit could neither exceed 87 percent of the Freddie Mac (conforming) loan limit nor be lower than 48 percent of that same limit. The 2007 GAO report found that the 2006 FHA loan limits fell between $200,160 and $362,790, with 82 percent of counties at the floor and 3 percent at the ceiling. (The 2008 Economic Stabilization Act substantially changed the calculation of these loan limits.)
Second, FHA mortgages require full documentation of borrower income and assets. However, “low documentation” mortgages were pervasive during the housing boom, particularly among those privately securitized. These loans were often used for the purchase of second homes or investment properties (although they were often reported as owner-occupied) and had shorter processing and closing times. Studies have shown that these loans defaulted at significantly higher rates even after controlling for other observable borrower and loan characteristics.
Third, FHA-insured mortgages largely carry fixed rates and 30-year amortization schedules, while subprime mortgages were more often variable rate and sometimes included nonstandard amortization, such as interest-only periods or balloon payments.
Finally, only owner-occupied homes are eligible for FHA mortgage insurance. The academic literature on the causes of the 2000s housing boom and bust has found that investor activity played an important role. While investor loans were mostly concentrated in a different segment of the PLS market (the low-documentation “Alt-A” space), they accounted for a considerable fraction of subprime PLS mortgages.
Chart 4 illustrates how the share of subprime PLS home-purchase mortgages is affected by applying the filters based on the four factors to make them comparable to FHA loans for home-purchase originations in 2002–06. The two most important categories were loans with less than full documentation and those with original balances above local FHA loan limits. Note that some mortgages have more than one impermissible characteristic, so the total percentage of subprime purchase originations ineligible for FHA insurance (solid black line) is beneath the tops of the annual bars.
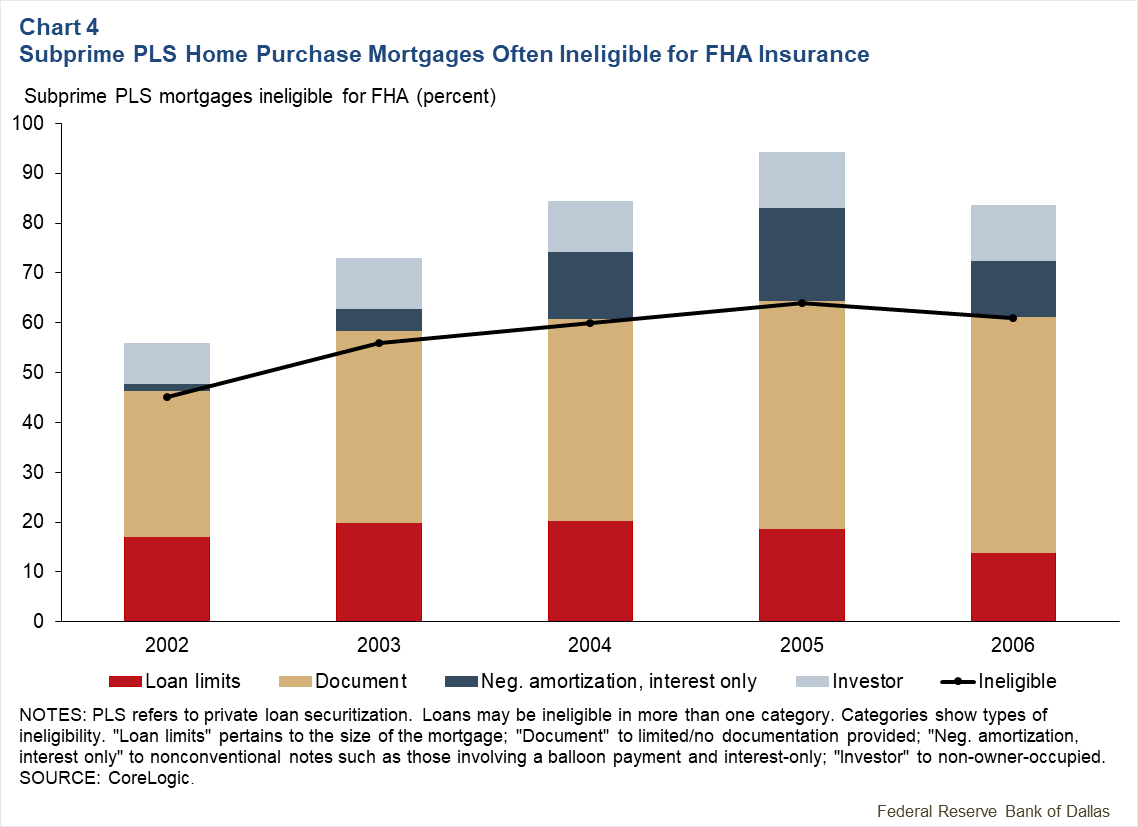
It’s unclear how best to interpret the percentages of subprime PLS mortgages ineligible for FHA insurance. On one hand, these loans should not be considered perfect substitutes for FHA originations due to the explicit violation of at least one requirement of FHA. On the other hand, it’s possible that had the subprime PLS market not existed, many of these borrowers would have taken a mortgage that met FHA parameters.
Chart 5 applies these restrictions on a quarterly basis and shows a significant reduction in subprime PLS home-purchase mortgages that would have been FHA eligible.
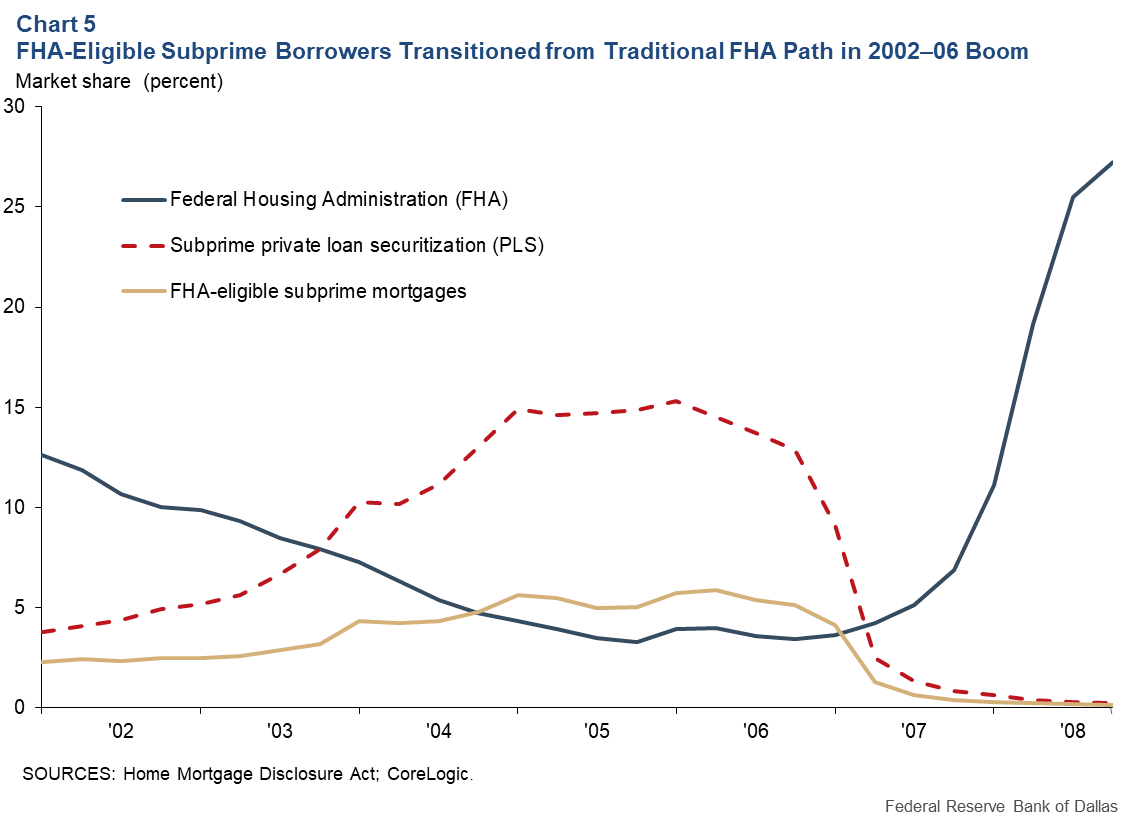
While this significantly lessens the inverse relationship, there seems to have been some residual substitution that occurred between the two origination channels for home-purchase loans. This could be related to the widespread availability of zero-down-payment subprime PLS mortgages during 2004–06. It could also result from relatively long FHA processing times.
Possible warning of financial instability
The significant inverse-market-share relationship between subprime PLS and FHA-insured mortgages during the 2000s housing boom has largely escaped academic and policy attention. While borrower credit quality across the two market segments was similar, the mortgage characteristics generally were not.
In fact, a large share of these subprime PLS originations violated at least one of the FHA’s underwriting restrictions. This is consistent with subprime PLS growth during the 2000s arising from a combination of relaxed underwriting standards by private lenders/investors and increased borrower demand for riskier mortgage products, such as low-documentation and interest-only loans. This may be indicative of borrowers and lenders becoming caught in a bubble mentality where “animal spirits,” in the form of optimistic house price expectations, reduced concern about increasing risk.
We are reluctant to draw too many policy implications from this analysis due to our inability to establish underlying causal relationships. However, it’s advisable that regulators monitor origination flows between government and private market segments given that large swings in market share could provide early warning of future financial instability.
About the Authors

W. Scott Frame
Frame is a vice president in the banking and finance group in the Research Department at the Federal Reserve Bank of Dallas.

Kristopher Gerardi
Gerardi is a financial economist in the Research Department at the Federal Reserve Bank of Atlanta.

Daniel Sexton
Sexton is a quantitative research analysis specialist in the Research Department at the Federal Reserve Bank of Atlanta.
The views expressed are those of the authors and should not be attributed to the Federal Reserve Bank of Dallas or the Federal Reserve System.