Real Wages Grew During Two Years of COVID-19 After Controlling for Workforce Composition
In a recent exchange on Twitter, noted economists Paul Krugman and Jason Furman drew very different conclusions about whether workers have experienced real (inflation-adjusted) wage gains during the pandemic after taking into account composition effects, which reflect changes in the makeup of the workforce.
We discuss an approach that allows us to look through these composition effects and find that, despite recent negative real wage growth, workers have experienced real wage gains over the two years of the pandemic.
To determine if workers have experienced real wage gains, we first need to select a gauge of wage growth. A popular measure is average hourly earnings (AHE)—aggregate payroll divided by aggregate hours—calculated from the Bureau of Labor Statistics’ monthly survey of business establishments.
Changes in Workforce Composition
As we noted in a previous article, AHE growth is indicative not only of the underlying wage growth for individuals but also of changes in the composition of the workforce. This composition effect reflects average wages of individuals who leave the workforce, compared with those who enter it over the period. When those departing tend to have higher wages than entrants over a specified period, this contributes to a negative composition effect, where measured AHE growth understates the wage growth of individuals.
In addition, for individuals who stay employed, the composition effect also reflects changes in the distribution of hours between high- and low-wage jobs. When individuals working in low-wage jobs gain hours relative to individuals in high-wage jobs, the situation contributes to a negative composition effect.
When composition effects change over time, particularly during periods of high labor market activity, it becomes more difficult to use AHE growth to measure the underlying strength of individual wage growth, as evidenced by the Twitter exchange between Krugman and Furman.
Measuring Composition Effects
We use the Current Population Survey (CPS)—or household survey—to estimate these composition effects. The CPS provides employment, hours and wages information on individuals that can be tracked over a 12-month period, provided that survey respondents don’t change residences. This allows us to measure wages for those departing and entering employment as well as changes in hours worked for individuals who didn’t move, thereby permitting us to estimate the composition effects on AHE growth. We use CPS data from 1982 to present to calculate an alternative AHE growth series that removes these estimated composition effects.
Chart 1 shows our quarterly estimates of the AHE composition effects from 2019 to present, using CPS data. The dashed red line indicates the average composition effect from 1982 to 2018. Over this 37-year period, composition effects have averaged −0.82 percent, lowering AHE growth by nearly a percentage point and understating individual wage growth by the same amount.
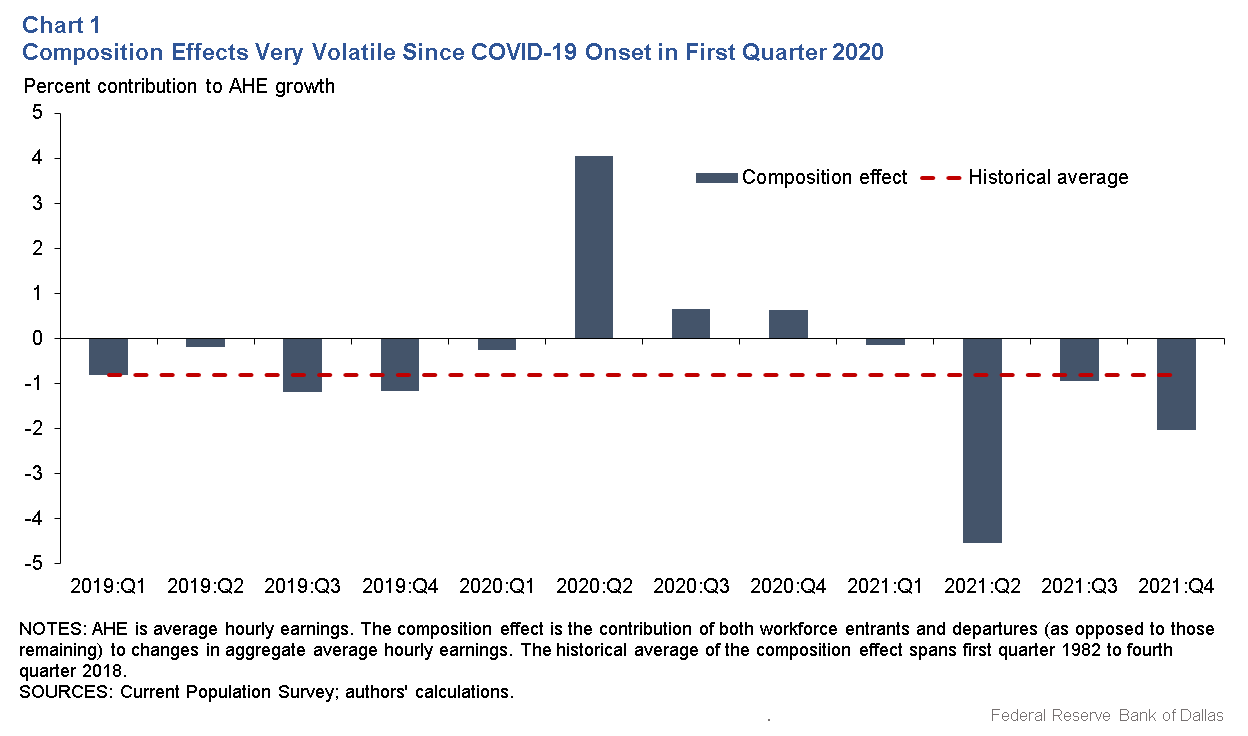
Public reaction to COVID–19 along with government policies aimed at reducing the spread of the virus caused a rapid rise in unemployment in second quarter 2020, creating a large positive composition effect of around 4 percentage points. This was because much of the high unemployment was concentrated in low-wage service sector jobs that were unsuitable for remote work.
Similarly, there was a large negative composition effect one year later as the economy began recovering and unemployment fell quickly as entrants to the labor force began filling low-wage service sector jobs. The composition effects for the second half of 2021 have remained negative but closer to the historical average.
How Unusual Were COVID–19 Impacts?
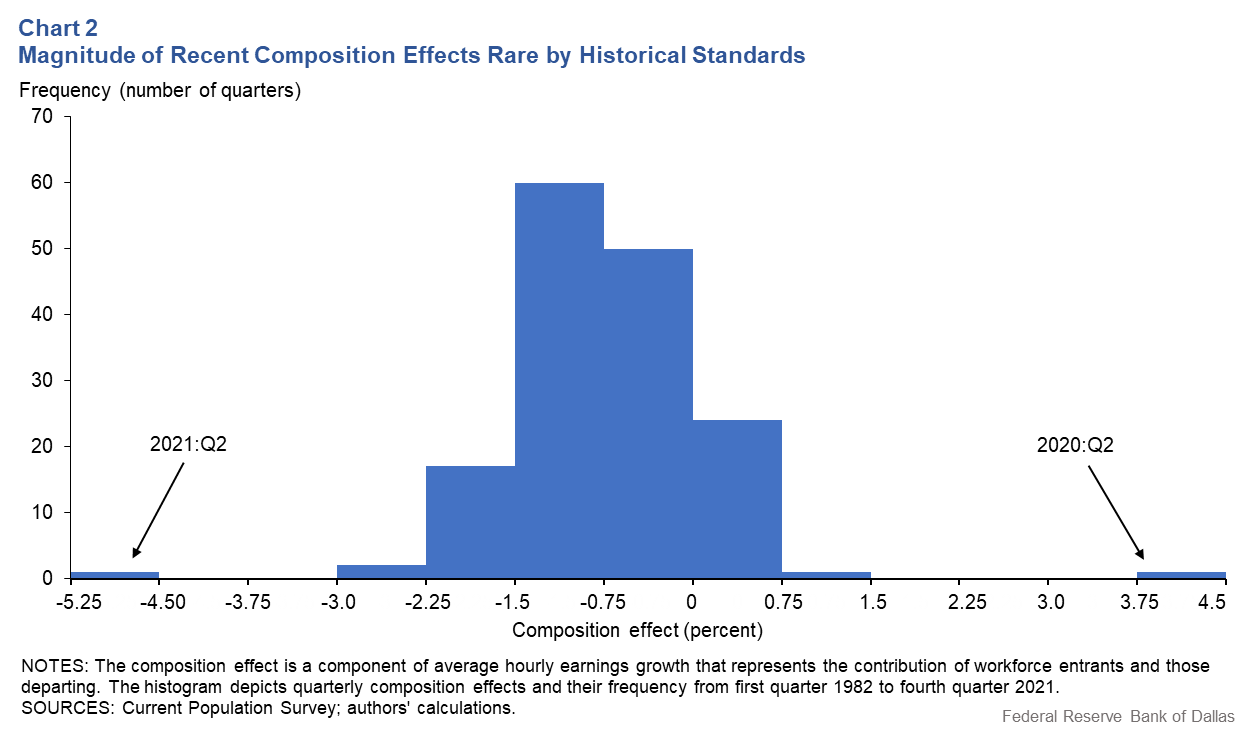
How unusual were the composition effects for second quarter 2020 and second quarter 2021? Chart 2 depicts the distribution of estimated composition effects, including from 1982 to 2019—a period when 88 percent were negative. In addition, the distribution indicates that the two large COVID-19 composition effects are unprecedented in the almost 40 years of CPS data. Consequently, these outsized composition effects impart a large distortion to the recent pattern of AHE growth.
To gain a clearer picture of wage growth during COVID-19, we need to “look through” these composition effects. To do this, we recalculate what recent nominal AHE growth would have been since 2019 if composition effects each quarter were held constant at their historical average value. Chart 3 contrasts actual AHE growth with our “composition-constant” nominal AHE growth series.
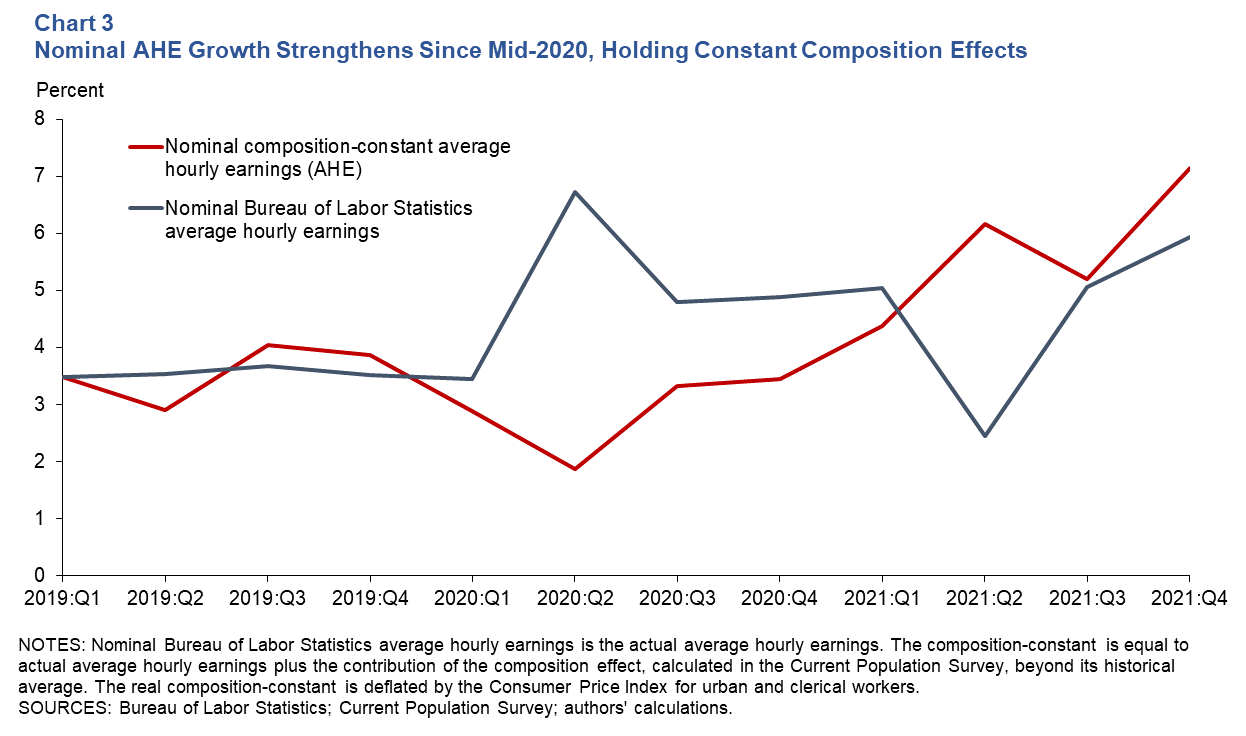
Controlling for the changing composition effects indicates that nominal AHE growth ranged 3 to 4 percent in 2019 before the onset of COVID–19. As the pandemic affected the U.S. economy in the first half of 2020, the composition-constant nominal AHE growth series slowed to around 1.8 percent. In the second half of 2020 as the recovery from COVID–19 gained momentum, the composition-constant nominal AHE growth series accelerated, reaching 7.2 percent by year-end 2021.
Tracking Changes in Real Wages over the Pandemic
Importantly, have the increases in composition-constant nominal AHE growth translated into real wage gains for workers? To answer this question, we use the CPI-W—the Consumer Price Index for urban wage earners and clerical workers—to construct the real composition-constant AHE growth series (Chart 4).
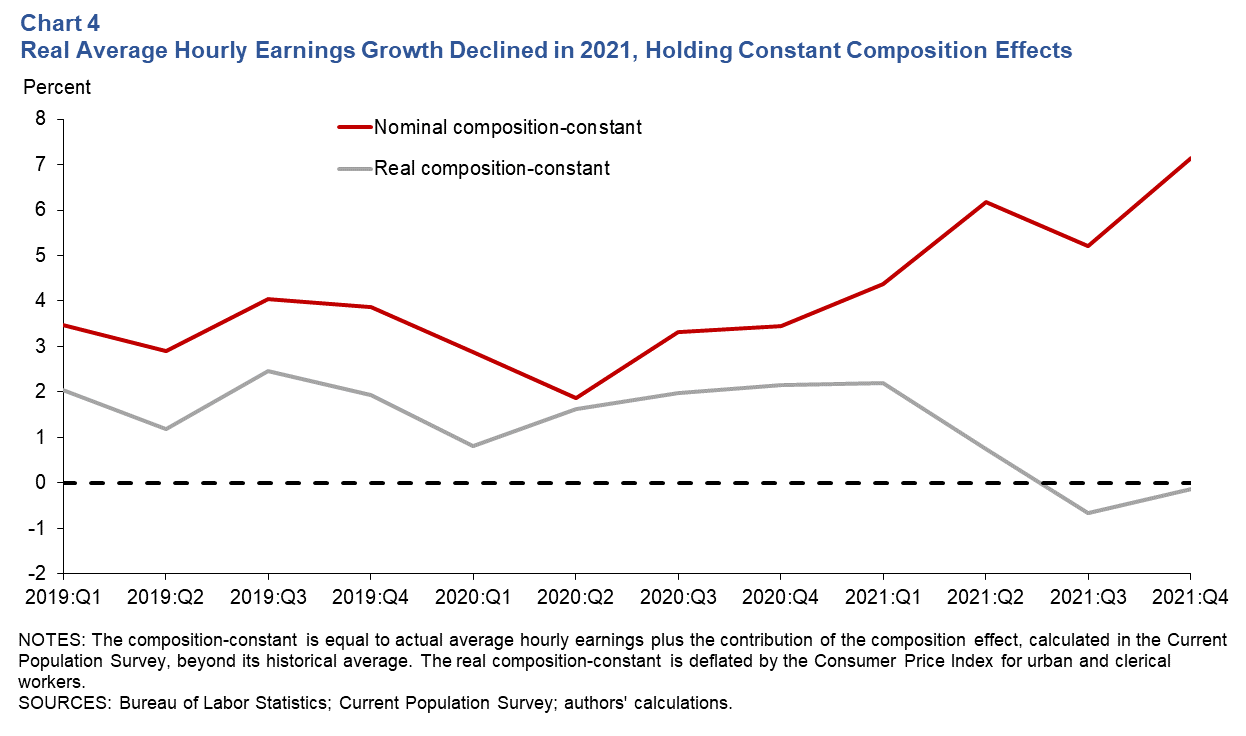
This measure of real wage growth averaged 1.9 percent in 2019. After a slowdown in first quarter 2020, real wage growth returned to around 2 percent over the remainder of 2020. Despite the ongoing strength in nominal composition-constant AHE growth in 2021, real composition-constant AHE growth slowed in the first half of 2021 and turned negative in the second half as inflation rapidly increased. On net, we find that holding composition effects constant, real AHE growth remained slightly positive over 2020 and 2021.
Average Hourly Earnings Volatility During the Pandemic
A popular measure of wage growth—AHE growth—has displayed marked volatility over 2020 and 2021 during the pandemic.
This is due to outsized composition effects reflecting significant changes in the makeup of the workforce over the past two years. Looking through these COVID–19 composition effects shows steady rising nominal wage growth during the second halves of 2020 and 2021 but negative real wage growth recently, as inflation overtook these wage gains.
On net, however, real AHE growth that controls for composition effects has remained slightly positive over the past two years.
About the Authors

Sean Howard
Howard was a research analyst in the Research Department at the Federal Reserve Bank of Dallas.

Robert Rich
Rich is a senior economic and policy advisor in the Research Department at the Federal Reserve Bank of Cleveland.

Joseph Tracy
Tracy is executive vice president and senior advisor in the Research Department at the Federal Reserve Bank of Dallas.
The views expressed are those of the authors and should not be attributed to the Federal Reserve Bank of Dallas or the Federal Reserve System.