Energy Indicators

An early January surge in tensions between Iran and the United States gave a transitory boost to oil prices. Oil and gas employment in the U.S. fell further toward the end of the year. Most Dallas Fed Energy Survey participants expect to be able to fund their capital expenditures from cash flow if recent prices hold. The industry was a drag on business investment in mid-2019, and fourth-quarter rig counts suggest that capital spending continued to erode through year-end.
Iran–U.S. tensions
Elevated geopolitical tensions between the United States and Iran were punctuated by the killing of Iranian General Qasem Soleimani by the U.S. in early January and a retaliatory strike by Iran on Iraqi military facilities that housed U.S. troops. In response, Brent crude prices rose from $66 to $69 a barrel in the days that followed. However, markets cooled by Jan. 8, and Brent returned to $66.
Sanctions imposed on Iran by the U.S. after the Trump administration withdrew the U.S. from the Joint Comprehensive Plan of Action (JCPOA)—commonly known as the Iran nuclear deal—are at the center of the current geopolitical tensions. As a result of the re-imposition of sanctions, Iranian crude oil production had fallen to 2 million barrels per day (mb/d) in fourth quarter 2019, down from over 3.8 mb/d in early 2018 (Chart 1).
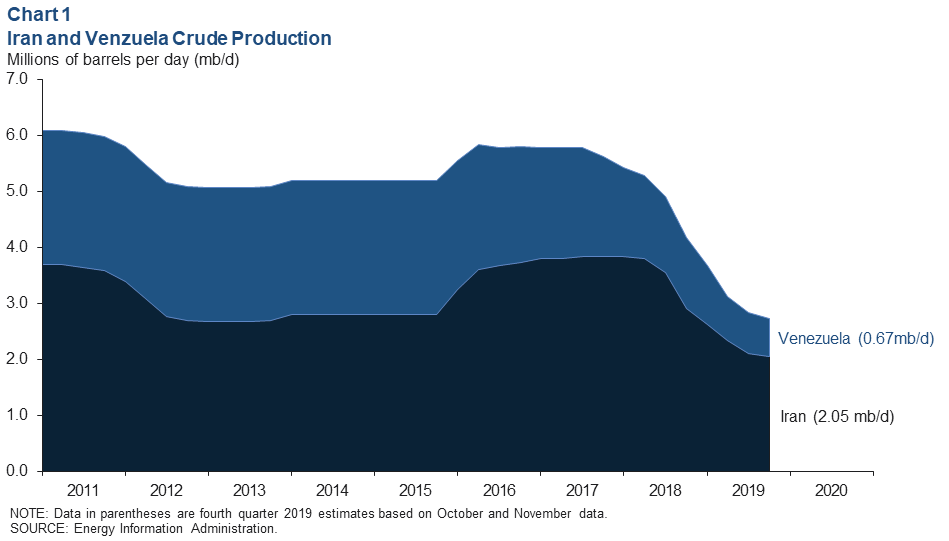
Eroding Venezuelan production—exacerbated by U.S. sanctions on the country—fell to 0.67 mb/d in fourth quarter 2019. U.S. firms operating in the country have relied on waivers to continue doing so; those are set to expire Jan. 22. Should those waivers fail to be extended, Venezuelan production could continue to erode in 2020. However, crews from other countries, such as Russia, may move to fill the void left by exiting U.S. firms and help maintain output.
U.S. employment in oil and gas
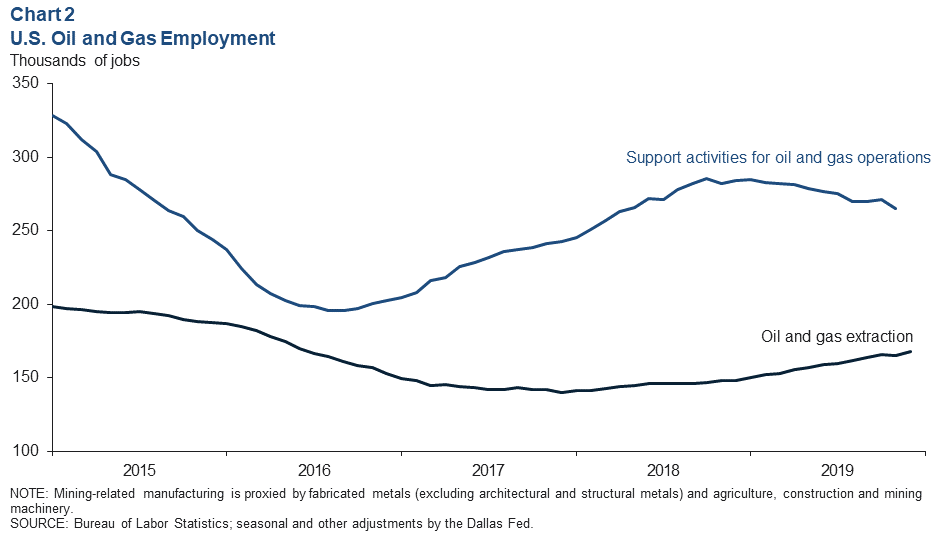
Oil and gas extraction added 2,500 jobs in December according to initial estimates (Chart 2). December job estimates for support activities for oil and gas lag the extraction sector and are not yet available. However, U.S. employment in both oil and gas extraction and support activities for oil and gas operations decreased in November. The two sectors combined lost 6,500 jobs, the biggest drop in oil and gas payrolls since June 2016. The most recent release also revised down October job growth in the mining sector. The worsening jobs numbers are consistent with the employment indexes in the fourth quarter survey, which indicated further declines in employment from the third quarter to the fourth quarter.
Crude oil prices
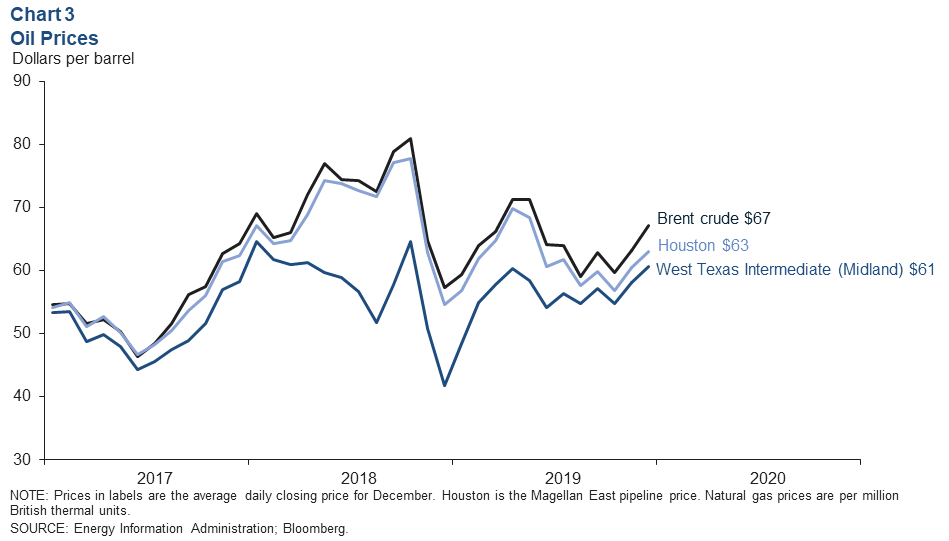
Crude oil prices ticked up from November to December. Prices got a temporary boost early in the month due to the agreement by OPEC, Russia and several other countries that they would lower production in 2020. A more sustained increased in crude prices followed news that the U.S. and Chinese trade war would not escalate further in 2020. The Phase One trade agreement prevented a substantial increase in tariffs, which were expected to put downward pressure on the global economy and crude oil demand growth in 2020. Brent crude averaged $67 dollars in December—$4 above the Houston price. West Texas Intermediate (WTI) crude priced in Midland—closer to the wellhead prices that Permian Basin producers receive—averaged $61 (Chart 3).
Recent crude prices sufficient for survey respondents’ budgets
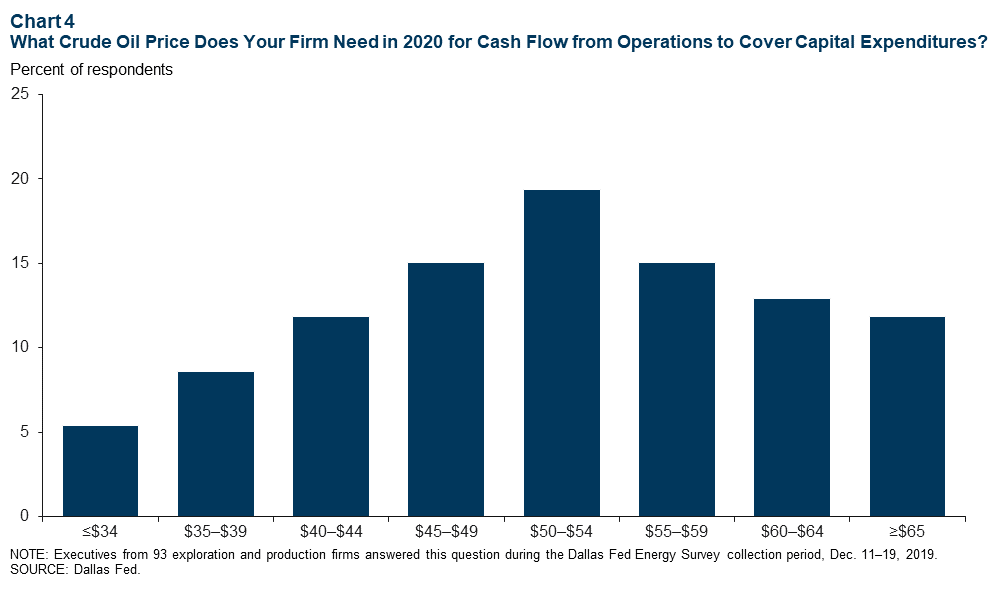
Seventy-four percent of respondents to the Dallas Fed Energy Survey are budgeting based on WTI averaging in the low $50s in 2020, and 65 percent of firms are budgeting for steady-to-declining year-over-year capital expenditures.
Recent prices for WTI near $60 should be sufficient for three-quarters of survey respondents to fund their planned 2020 capital expenditures with cash flow generated from production, rather than from debt or investor capital (Chart 4). However, tightening credit conditions and poor investor returns last year have led many industry contacts to suggest that crude prices would need to increase further and for an extended period of time before the industry would broadly consider increasing planned capital budgets in 2020.
Energy fixed investment
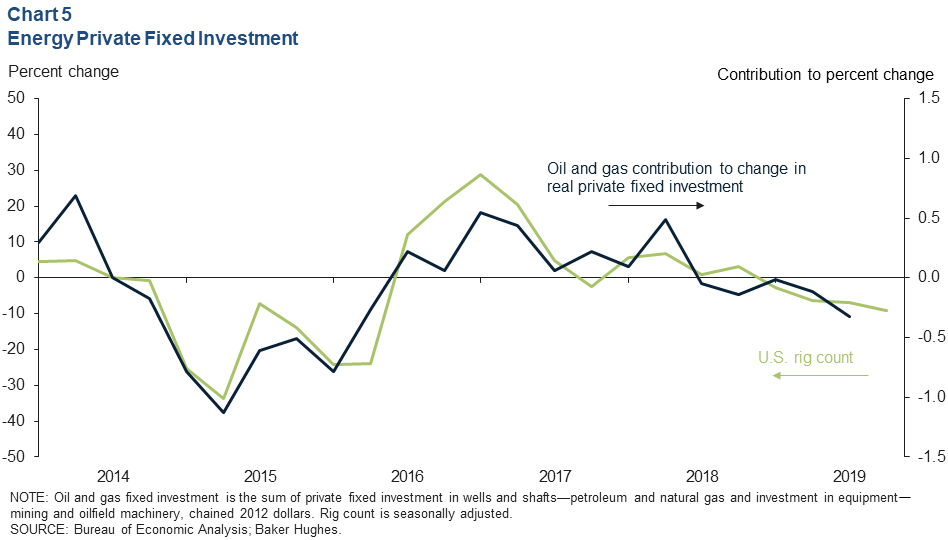
The oil and gas industry was a drag on U.S. real private fixed investment in 2019. The sector likely subtracted a third of a percentage point from third-quarter investment growth. Recent changes in the U.S. rig count imply the trend of declining investment continued in the fourth quarter (Chart 5). Most industry contacts believe that drilling activity is at or near a soft bottom. If that is the case, industry investment should stabilize in the first half of 2020.
About Energy Indicators
Questions can be addressed to Jesse Thompson at jesse.thompson@dal.frb.org. Energy Indicators is released monthly and can be received by signing up for an email alert. For additional energy-related research, please visit the Dallas Fed’s energy home page.