Austin Economic Indicators

The Austin economy remained healthy in May. The Austin Business-Cycle Index accelerated and remained above its long-term trend. Labor force growth remained restricted, though recent job growth was strong, particularly in the construction and mining and information sectors. Hourly wages declined further in May, while total construction permits rose.
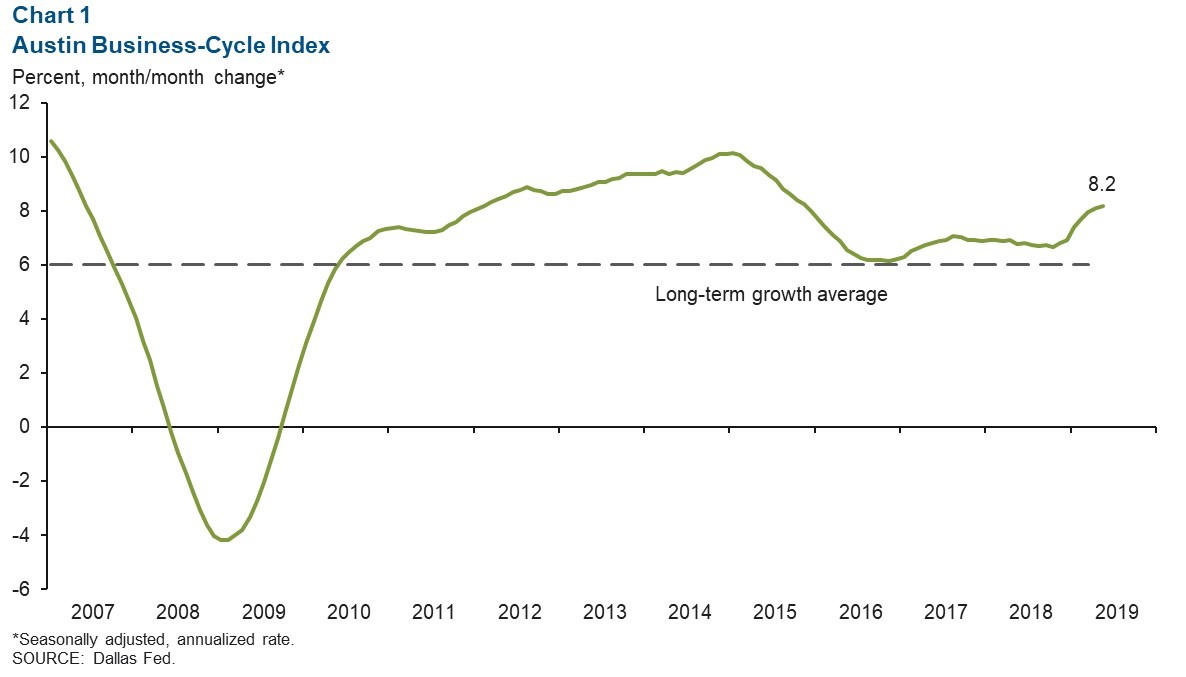
Business-Cycle Index
The Austin Business-Cycle Index accelerated to a robust annualized rate of 8.2 percent in May—the strongest expansion since November 2015 (Chart 1). The index was propelled by the declining unemployment rate and robust job growth.
Labor Market
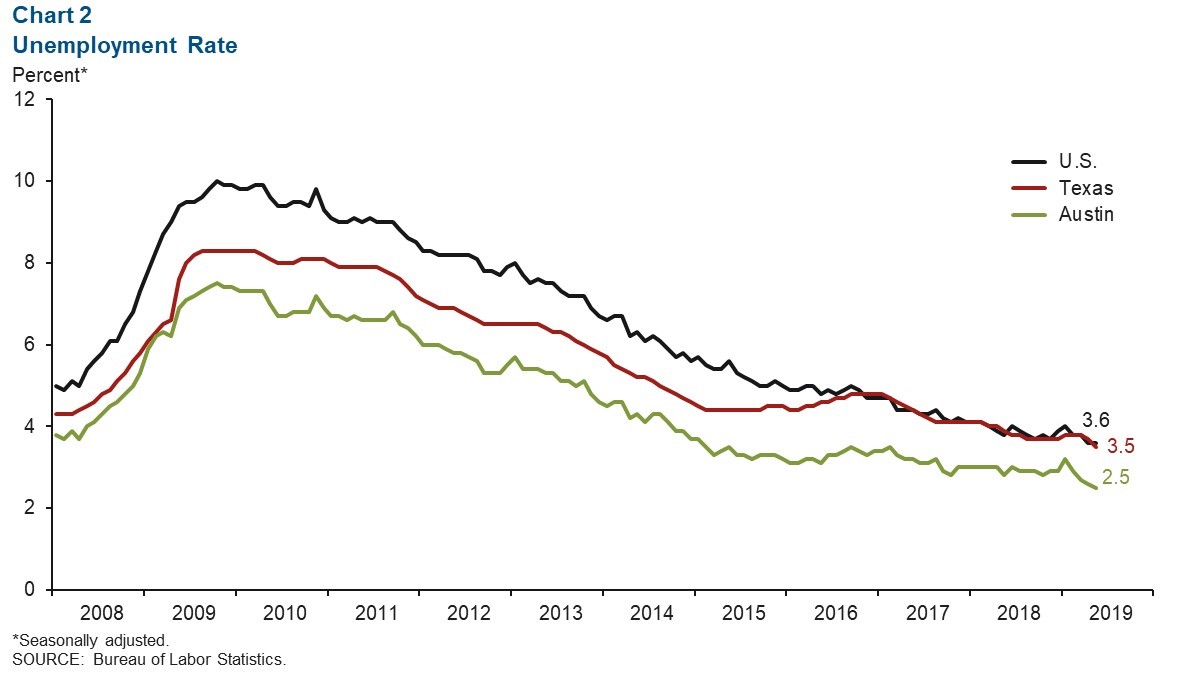
Unemployment Rate Remains Low
Austin’s unemployment rate declined from 2.6 percent in April to 2.5 percent in May, the lowest posting since December 1999 (Chart 2). The state unemployment rate declined from 3.7 in April to 3.5 in May, whereas the nation remained at 3.6 percent. Year to date, the metro’s labor force grew at an annualized rate of 0.4 percent; this compares with 3.6 percent in 2017 and 2.7 percent in 2018.
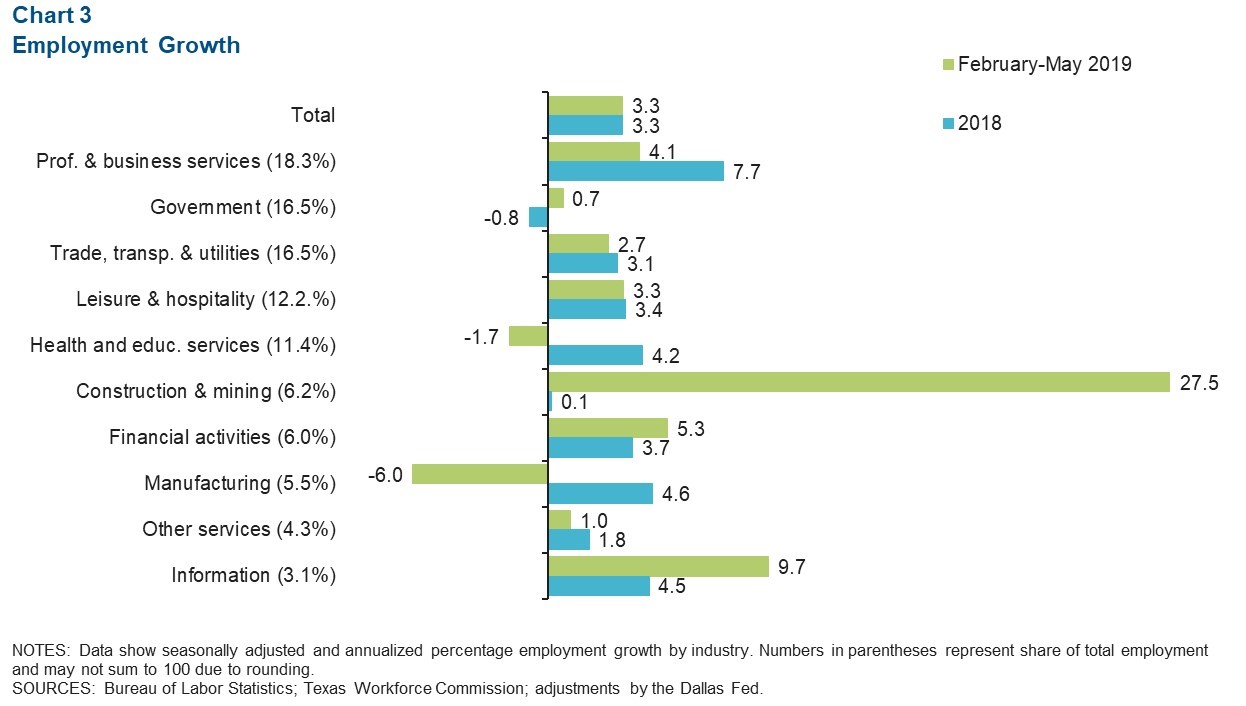
Job Growth Sees Upward Trend
The Austin metro saw a 3.3 annualized percent gain in jobs during the three months ending in May (Chart 3). Growth was led by the construction and mining sector, which swelled an annualized 27.5 percent, or a net 4,000 jobs. The information sector also experienced strong expansion with a growth of 9.7 percent, or 800 jobs. Financial activities, which saw considerable strength in employment related to finance and insurance, posted solid gains with an additional 850 jobs. An area of weakness was manufacturing, where net jobs contracted 6.0 percent (annualized), or 900 jobs.
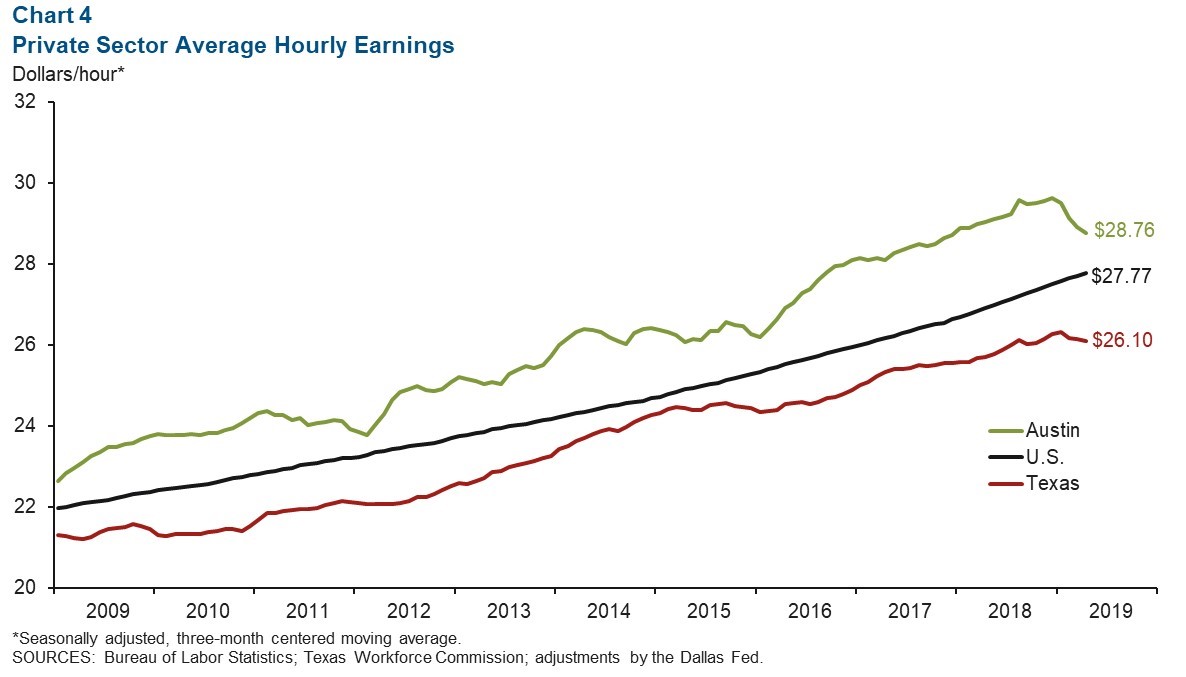
Hourly Wage Declines
The three-month moving average of private sector hourly wages for the metro area declined in May for the fourth consecutive month (Chart 4). The metro’s average wage of $28.76 remained above Texas and U.S. averages. Austin wages declined 1.6 percent year over year, while U.S. wages increased 3.1 percent and Texas wages increased 1.7 percent. Part of the decline in the metro’s average wage can be attributed to compositional effect, where the rapidly growing construction and mining sector drove down the average.
Real Estate
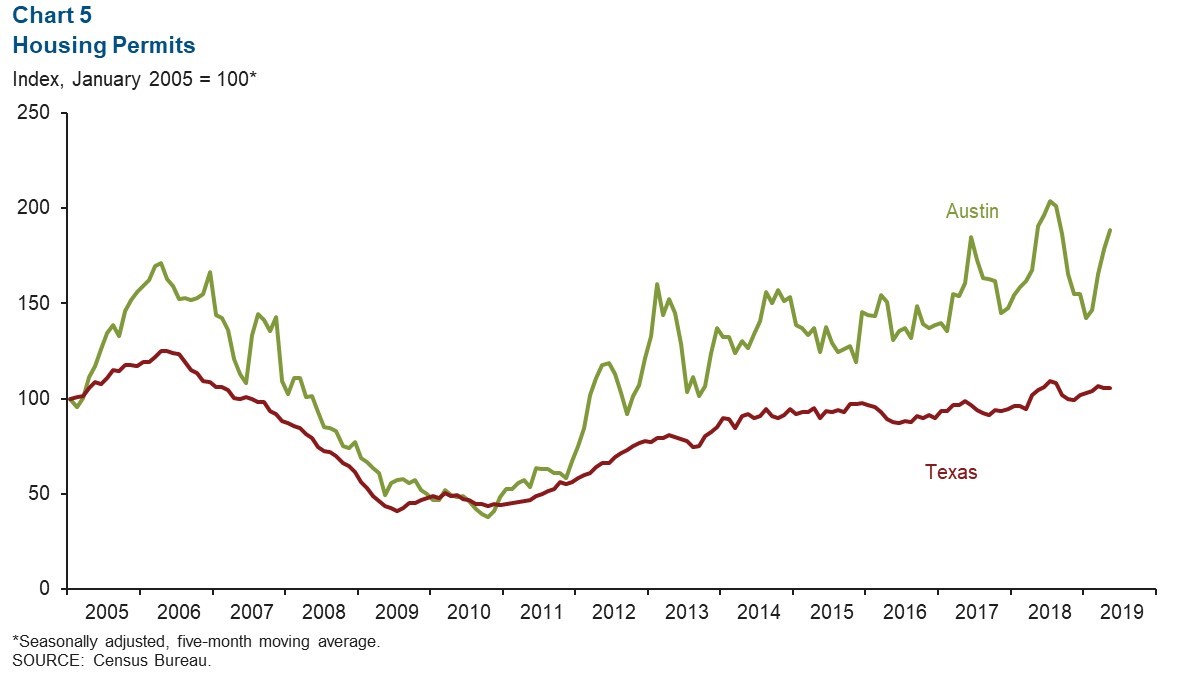
The five-month moving average for aggregate single and multifamily construction permits in Austin increased 5.7 percent in May, well above the state’s 0.1 percent decrease (Chart 5). Austin sales volumes increased 3.0 percent this year through May relative to the same period last year, whereas sales volumes for the state increased 1.1 percent. Meanwhile, housing affordability, the percentage of homes sold that the median-income household can afford, stood at 64.5 percent for the first quarter this year. Inventory ticked up to 2.5 months in May, well below the six months considered a balanced market.
Austin Purchasing Managers Index
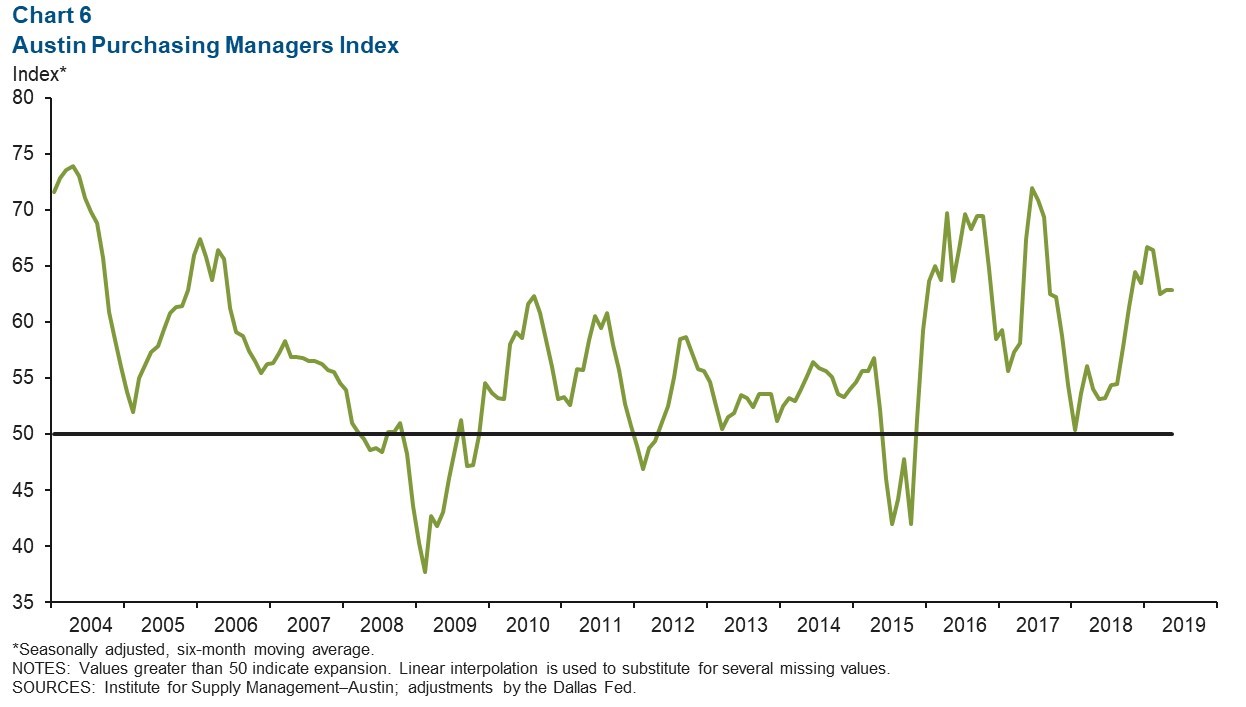
The Austin Purchasing Managers Index suggested solid expansion in the area’s manufacturing sector in May. The six-month moving average of the headline index remained at 62.9, well above the postrecession average of 56.6 (Chart 6). The production, inventory, employment, supplier and prices indexes signaled growth in May, and the new orders and order backlog indexes were unchanged.
NOTE: Data may not match previously published numbers due to revisions.
About Austin Economic Indicators
Questions can be addressed to Judy Teng at judy.teng@dal.frb.org. Austin Economic Indicators is released on the first Thursday of every month.