El Paso Economic Indicators

El Paso’s robust labor market has placed pressure on average weekly wages. Home sales and single-family housing permits are expanding, although the median home price remains steady. Maquiladoras continue to add jobs, while trade through the El Paso port of entry remains nearly unchanged.
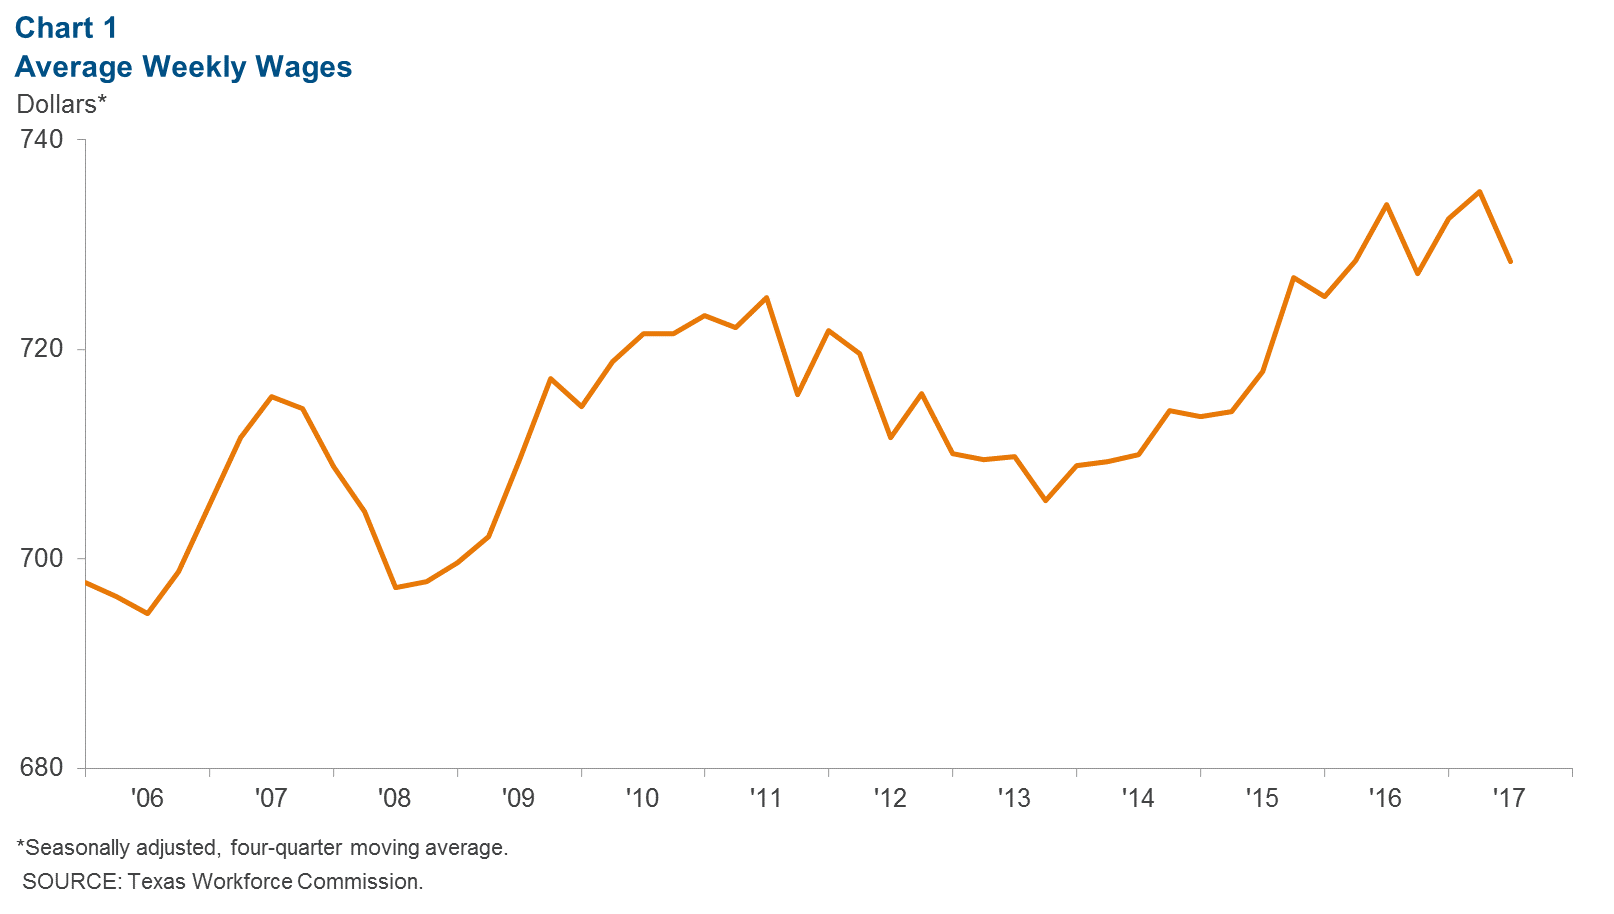
Wages
As the labor market in El Paso has tightened, wages have increased (Chart 1). The unemployment rate averaged 4.4 percent in 2017, down from 4.9 in 2016, 5.1 in 2015 and 6.4 in 2014. At the same time, average weekly wages inched up from $711 in 2014 to $718 in 2015 to $729 in 2016. Average weekly wages in third quarter 2017 were $728 (latest data available), down from the second quarter but similar to year-end 2016. Although wages have been trending up in El Paso, they still lag Texas wages, which stood at $1,069 in third quarter 2017.
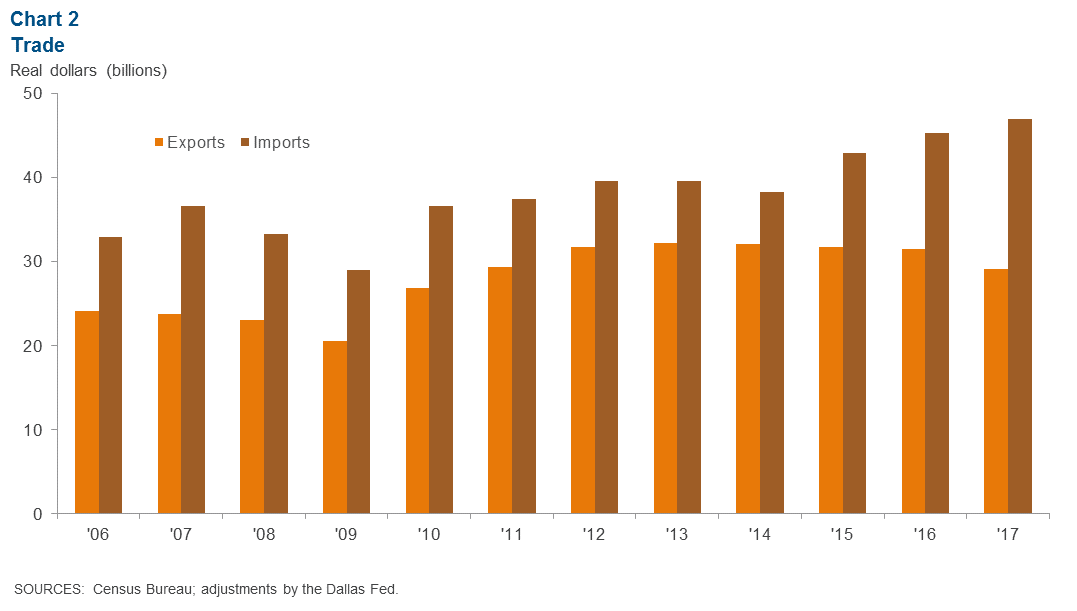
Total Trade
El Paso trade totaled $76.1 billion in 2017, down slightly from $76.8 billion in 2016 (Chart 2). The decline in annual trade was driven by lower exports. Exports totaled $29.1 billion in 2017, a 7.6 percent reduction from 2016 exports. On the other hand, imports rose 3.7 percent from a year earlier and totaled $46.9 billion in 2017.
Housing Market
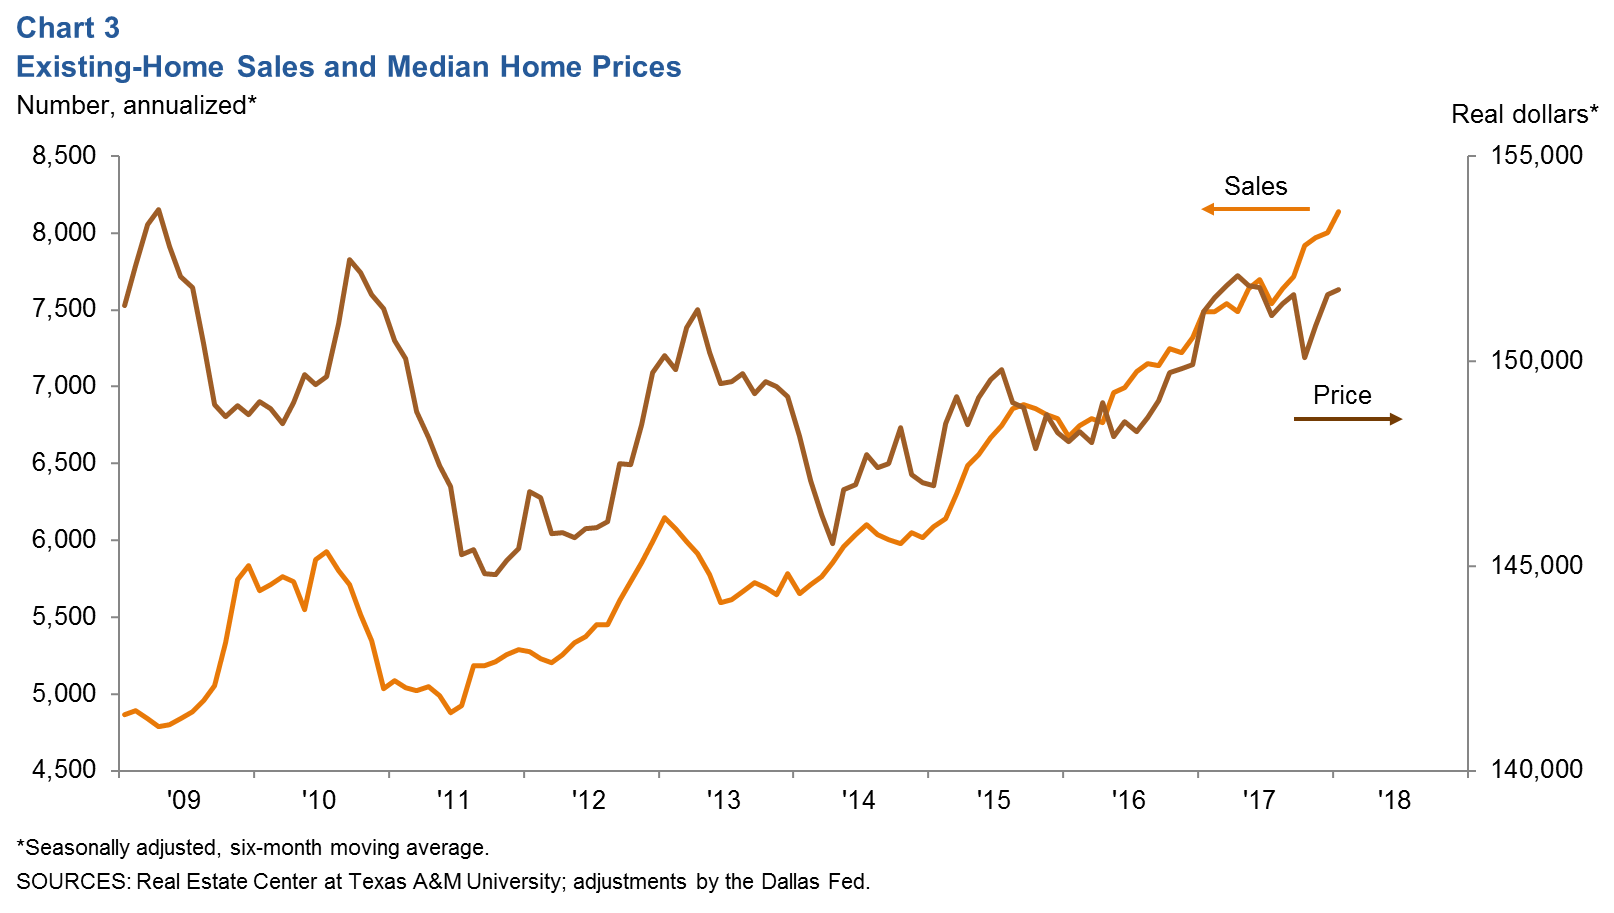
Home Sales Remain Strong, Prices Stable
Home sales in El Paso totaled an annualized 8,138 units in January, up 8.7 percent over the same month in 2017 (Chart 3). Home sales have been on an upward trend since 2011 when annual sales totaled 5,084.
In January, the median home price stood at $151,736, nearly unchanged from the previous year’s price of $151,206.
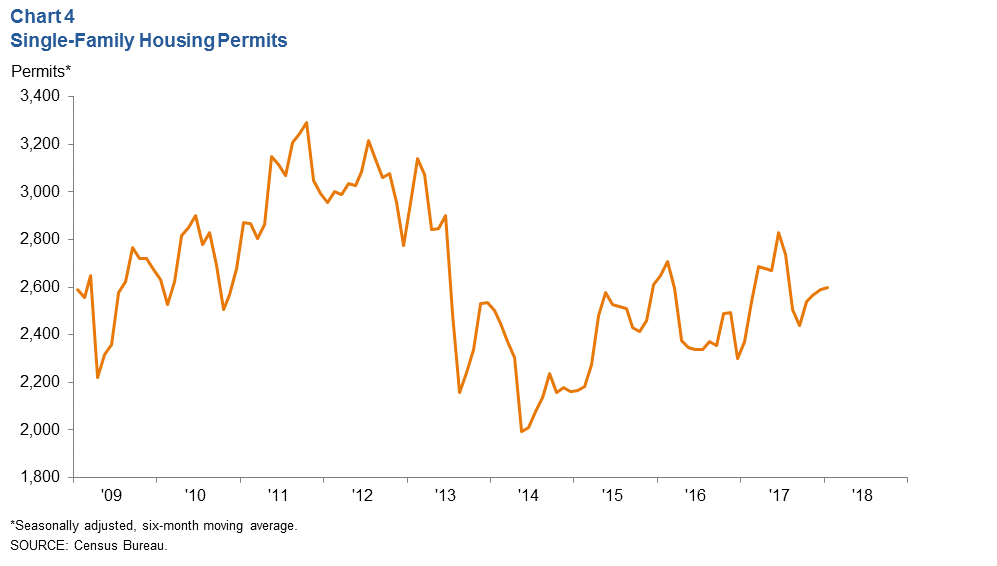
Single-Family Construction Strengthens
Healthy home sales have boosted homebuilding in El Paso. Single-family housing permits totaled 2,678 in 2017, up 15.9 percent from 2,310 in 2016. Annualized single-family permits in January totaled 2,599 (Chart 4). Strong demand for housing coupled with the declining supply of houses on the market suggest permits will continue to rise in the near term.
Juárez Maquiladora Activity
The U.S. industrial sector continues to post growth, a good sign for Ciudad Juárez manufacturing (Chart 5). U.S. industrial production rose 3.7 percent year over year in January.
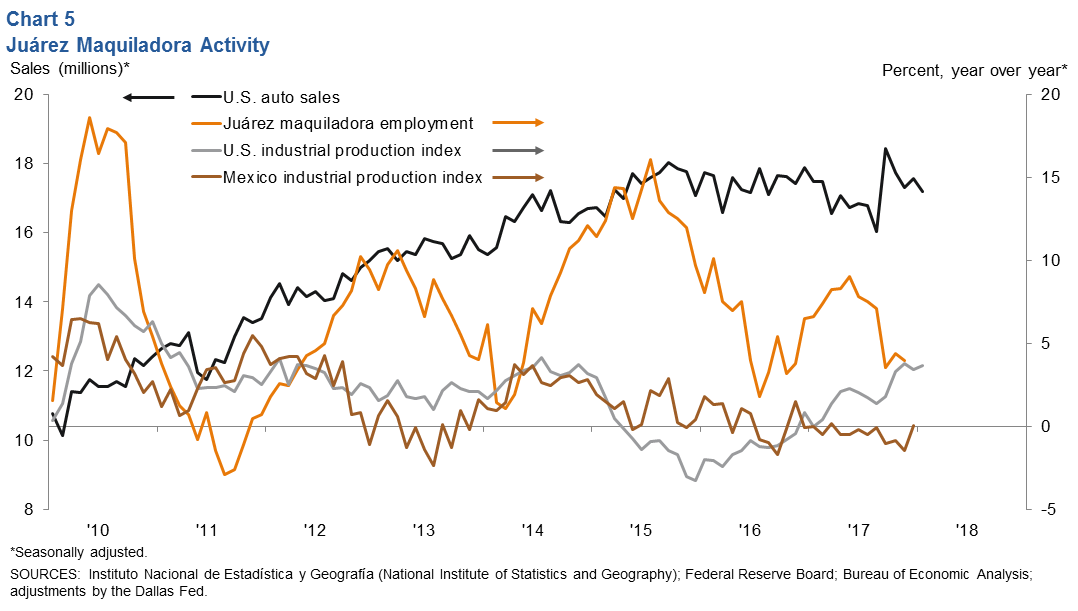
According to Mexico’s IMMEX series, Juárez manufacturing employment totaled over 273,300 in November, up 4.0 percent from a year earlier.
U.S. auto and light-truck production inched up to 11.1 million in January from 10.9 million in December. However, auto sales edged down to 17.2 million in January from 17.6 million in December. Auto sales are closely linked to the local economy because roughly half of maquiladoras in Juárez are auto related.
NOTE: Data may not match previously published numbers due to revisions. The El Paso metropolitan statistical area includes El Paso and Hudspeth counties.
About El Paso Economic Indicators
Questions can be addressed to Marycruz De León at marycruz.deleon@dal.frb.org. El Paso Economic Indicators is released on the fourth Wednesday of every month.