Houston Economic Indicators

April 14, 2020
Note: Some of the data included in this release precede the coronavirus (COVID-19) outbreak in the U.S.
Houston had strong employment numbers in February, including above-average health care growth, and increases in exports from the Houston–Galveston customs district. However, leading economic data looked tepid. Manufacturing activity declined for Houston’s trade partners in March, and initial claims for unemployment insurance in Houston surpassed levels seen after Hurricane Harvey. Retail motor fuel prices were down sharply in the region at the start of April, along with the price of oil.
Employment
Jobs Increase, Leading Index Declines Slightly
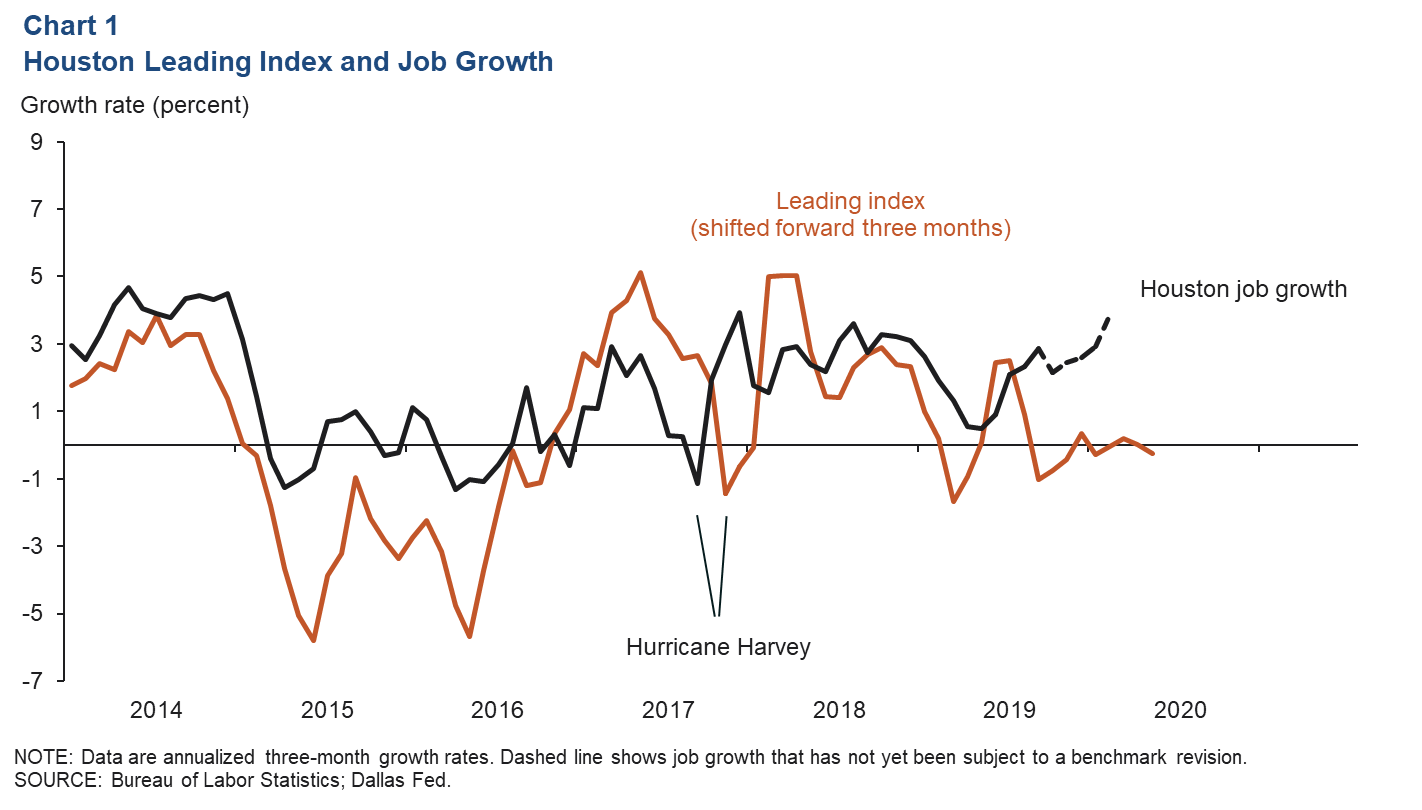
Initial estimates for Houston job growth in February show the metro area added jobs at a 3.8 percent pace. Prior to the impact of the coronavirus, the Houston Leading Index declined only slightly over the three months ending in February (Chart 1). This would have been consistent with moderate job growth over the next several months.
Health Care Jobs See Strong Growth
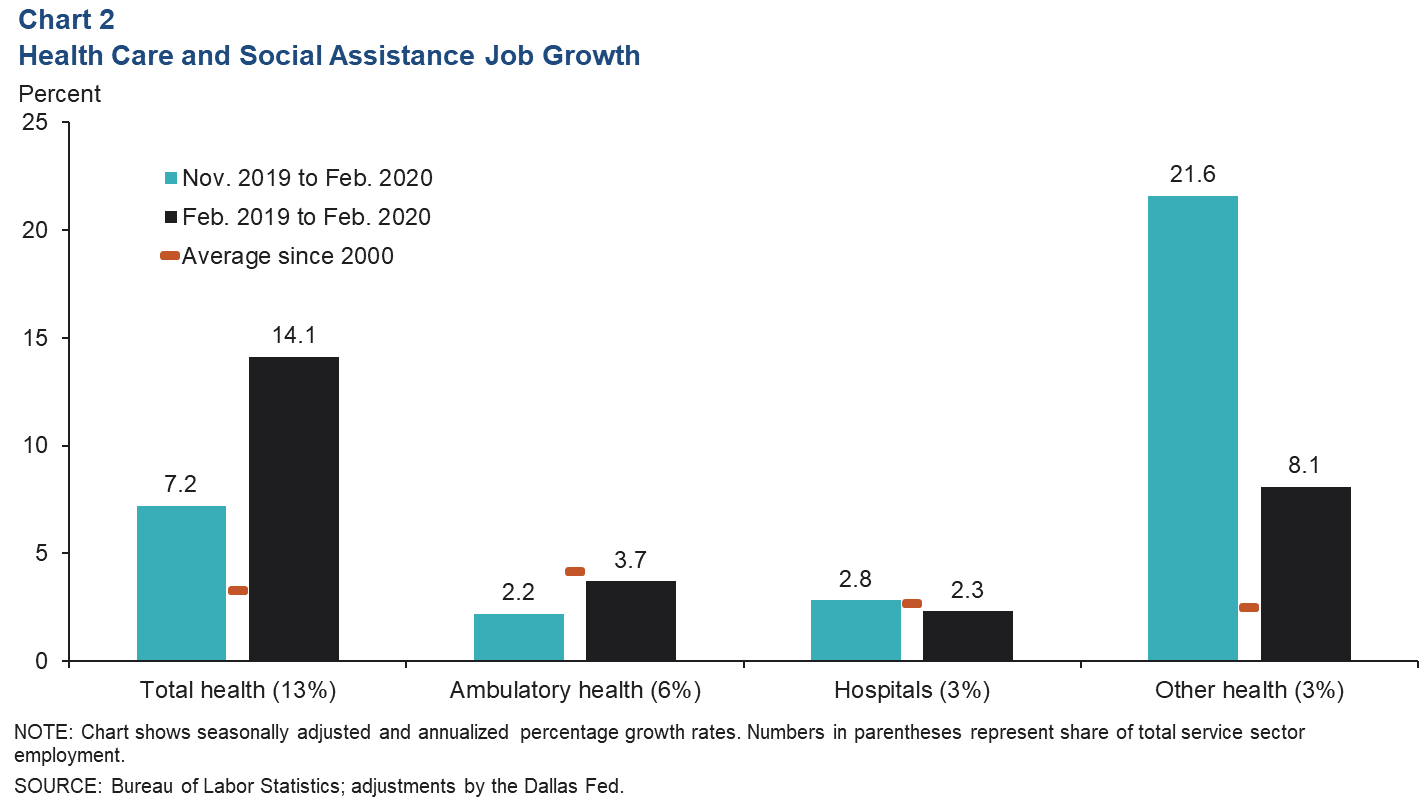
Health care and social assistance jobs expanded 7.2 percent (6,100 jobs) over the three months ending in February 2020 (Chart 2). The bulk of that growth (4,500) came from “other” health, such as retirement facilities, chiropractors and physical therapists. However, this subsector is relatively volatile and subject to substantial revisions. Ambulatory health, such as physicians’ offices, added 900 jobs over that time, and hospitals added 600.
Unemployment Insurance Claims Jump
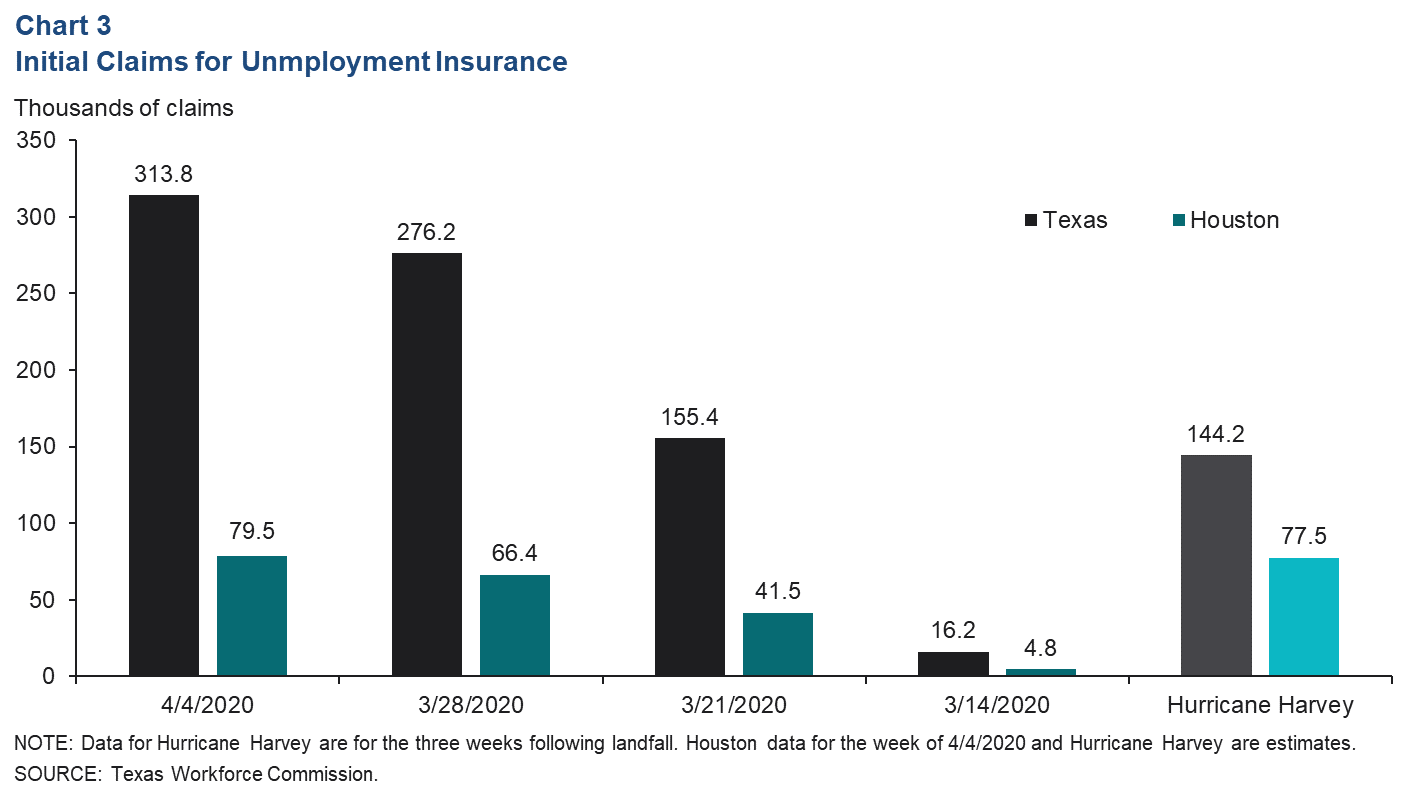
Texans filed 745,443 initial claims for unemployment insurance over the three record-setting weeks ending April 4 (not seasonally adjusted) (Chart 3). The Houston metro area (about a quarter of the state’s population) accounted for 26 percent of the state’s claims over the same period with more than 186,294. This surpasses levels seen in the wake of Hurricane Harvey, which significantly impacted coastal Texas in August 2017 and resulted in nearly 144,200 filings statewide in the three weeks following that storm.
Fuel Prices
Motor fuels are globally traded commodities, and retail fuel prices have dropped the past few months as efforts to contain the COVID-19 pandemic curtailed world demand and a Russia–Saudi price war drove up crude oil supplies (Chart 4). On-highway diesel priced on the U.S. Gulf Coast fell 16.2 percent from the end of January to $2.33 per gallon the first week of April. Retail regular gasoline in Houston slipped to $1.72 per gallon, a 21 percent decline.
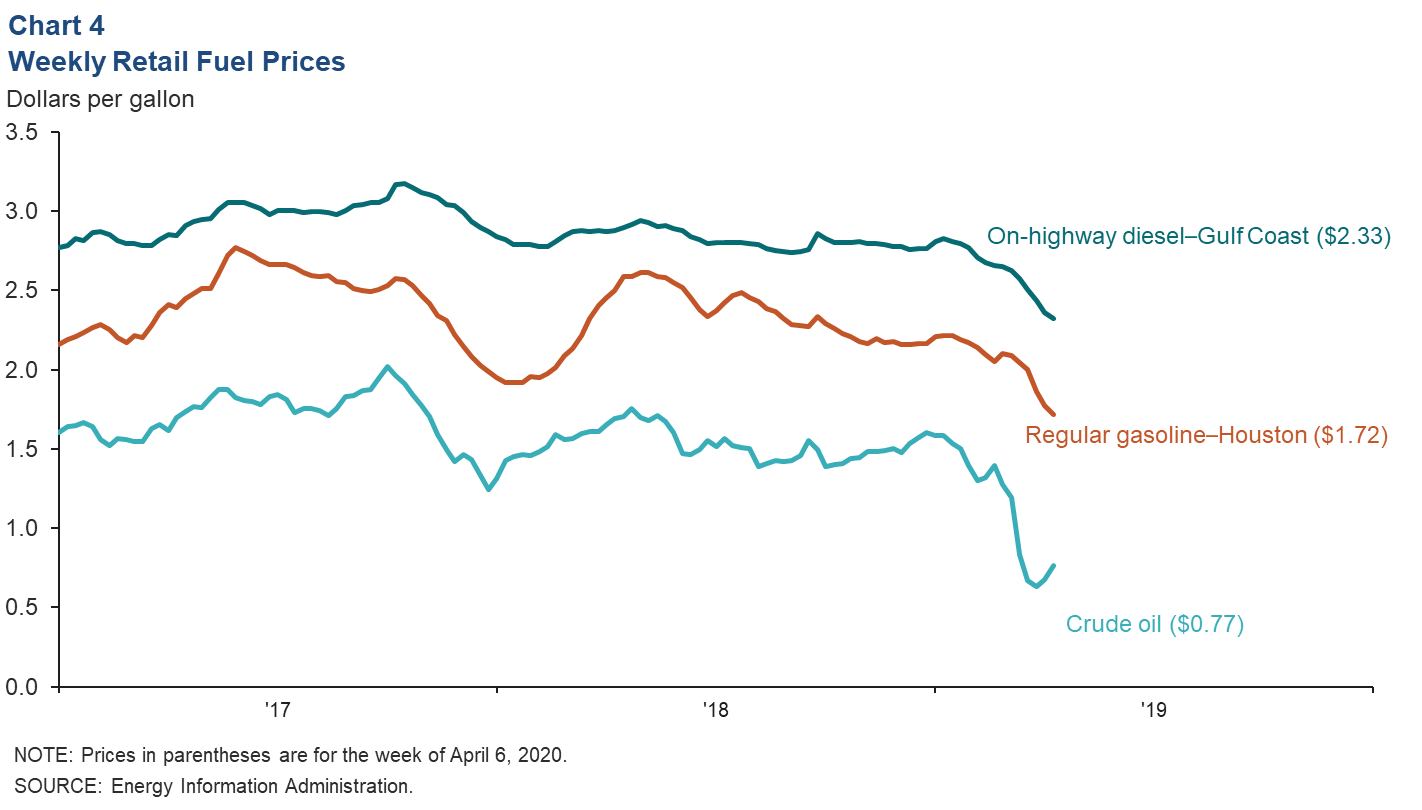
Retail motor fuel prices tend to shift with oil market supply and demand, but they are also influenced by biofuel blends, taxes and other blending components whose prices do not fluctuate as much as those for crude oil. From the end of January to the first week of April, Brent crude oil fell 44.9 percent to $0.77 per gallon ($32 per barrel)—a much steeper decline than observed in retail fuels.
Trade
Exports Continue to Grow
Exports through the Houston‒Galveston customs district continued to rise in February (Chart 5). Total tonnage expanded 8.2 percent over the two months ending in February and by nearly one-third year over year. The growth in both tonnage and the nominal value of exports was still driven primarily by crude oil and natural gas. Refined petroleum products and chemicals exports—mainly basic chemicals such as polyethylene resins—were also significant contributors to growth.
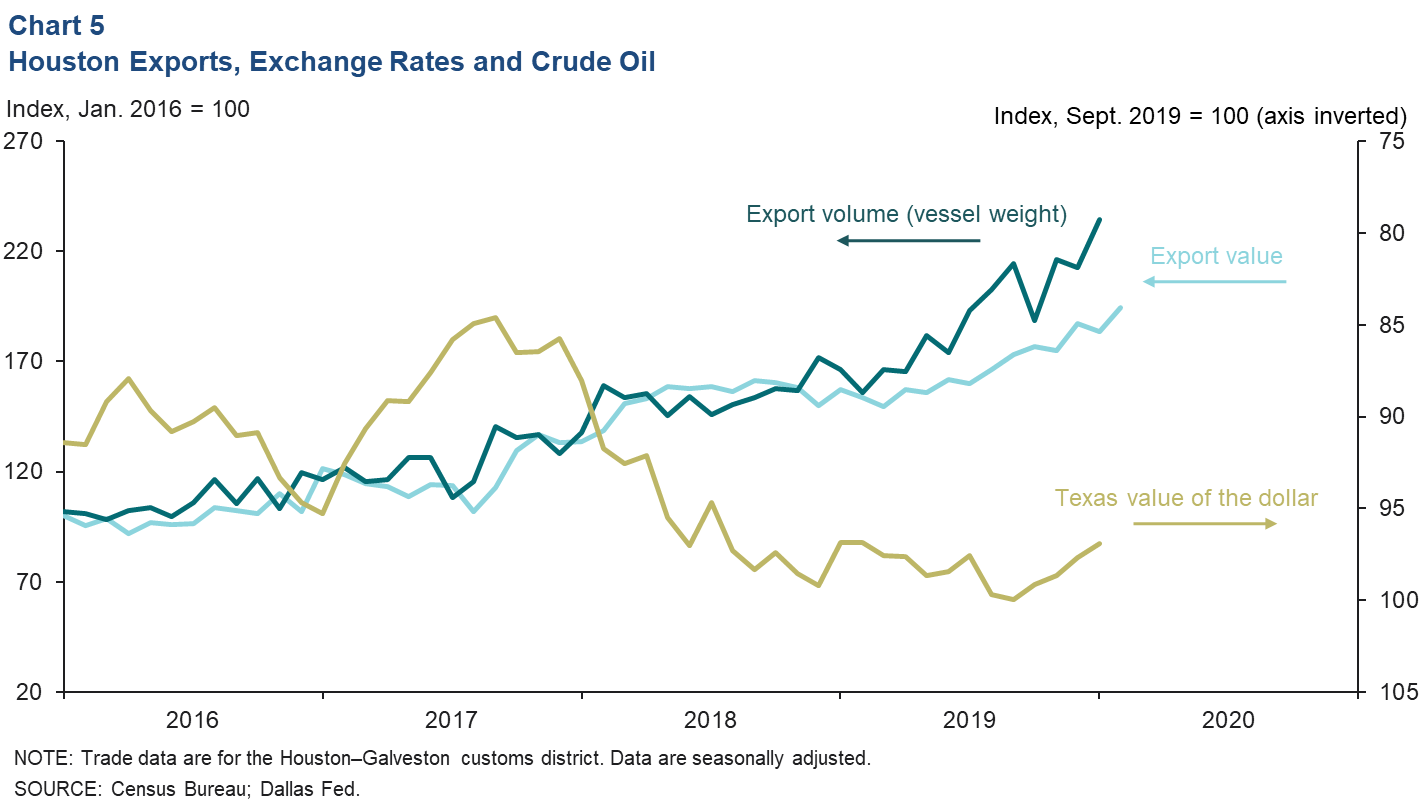
Exports and export-related employment are affected by fluctuations in the exchange value of the U.S. dollar. When the dollar appreciates against foreign currencies, it makes U.S. exports less competitive and vice versa. The Texas trade-weighted value of the dollar appreciated markedly from 2017 through 2019, acting as a headwind to exports through the port of Houston (see inverted axis in Chart 5). However, the effect was swamped by surging oil, natural gas and natural gas liquids production in search of foreign consumers. The Texas value of the dollar reversed course starting in September 2019, falling 3.1 percent by January 2020.
Manufacturing in Houston Export Markets Down in March
Global purchasing managers indexes (PMI)—one of the most-timely barometers of manufacturing activity abroad—fell below 50 in February (Chart 6). This indicates that manufacturing activity was declining sharply due to the effects of the global pandemic. Emerging-market manufacturing PMIs (led by China) fell to 44.6 in February 2020 but contracted less in March with an index value of 49. This implies manufacturing output in the emerging world was leveling off in March.
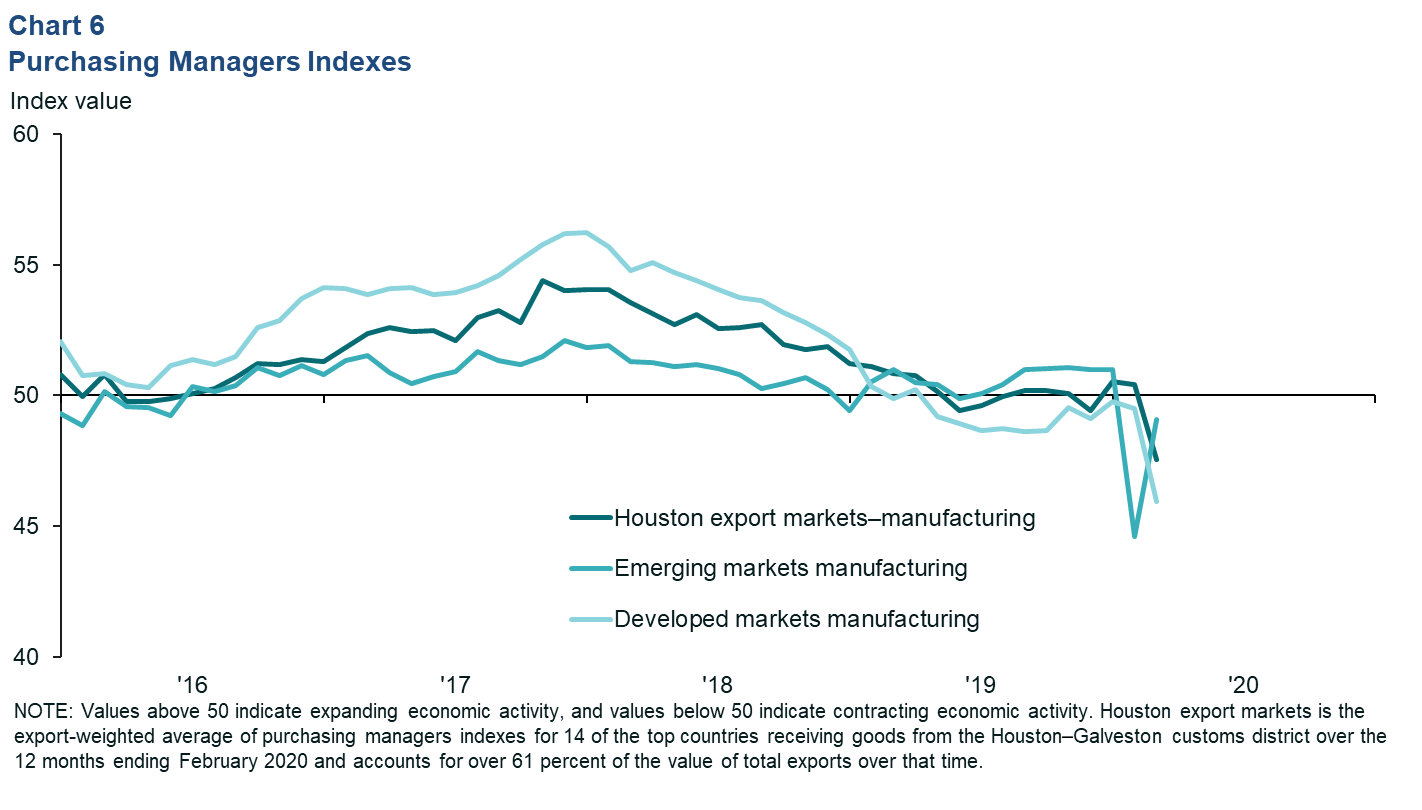
Manufacturing in advanced economies had already spent 2019 in modest contraction, led by weakness in Europe, but in March 2020, the index plunged to just under 46. Fluctuations in global manufacturing are highly correlated with growth in global trade.
To put global manufacturing in a local context, a trade-weighted index of manufacturing PMIs suggests that Houston export markets so far have been less affected by COVID-19 than markets in the rest of the world. The Houston region exports many intermediate goods (energy, petrochemicals, machinery, electrical components, etc.) that feed into global supply chains. Manufacturing output increased in January and February but fell to 47.6 on the index in March. The index is an export-weighted average of PMI data from 14 countries that accounted for over 61 percent of the value of exports through the customs district over the past 12 months.NOTE: Data may not match previously published numbers due to revisions.
About Houston Economic Indicators
Questions can be addressed to Jesse Thompson at jesse.thompson@dal.frb.org. Houston Economic Indicators is posted on the second Monday after monthly Houston-area employment data are released.