Permian Basin Economic Indicators

Employment increased in the Permian Basin during March while the unemployment rate continued to fall. Oil indicators (rig count, spot price and production) are showing strength. Housing supply remains tight, and growth in home sales slowed.
Labor Market
Nonfarm employment increased to 174,300 in March 2018—up 2,500 since December 2017 (Chart 1). Employment has climbed 8 percent over the past year. According to the Dallas Fed Energy Survey, energy companies increased employment, employee hours, and wages and benefits between fourth quarter 2017 and first quarter 2018. Most of the gains came from oilfield services firms.
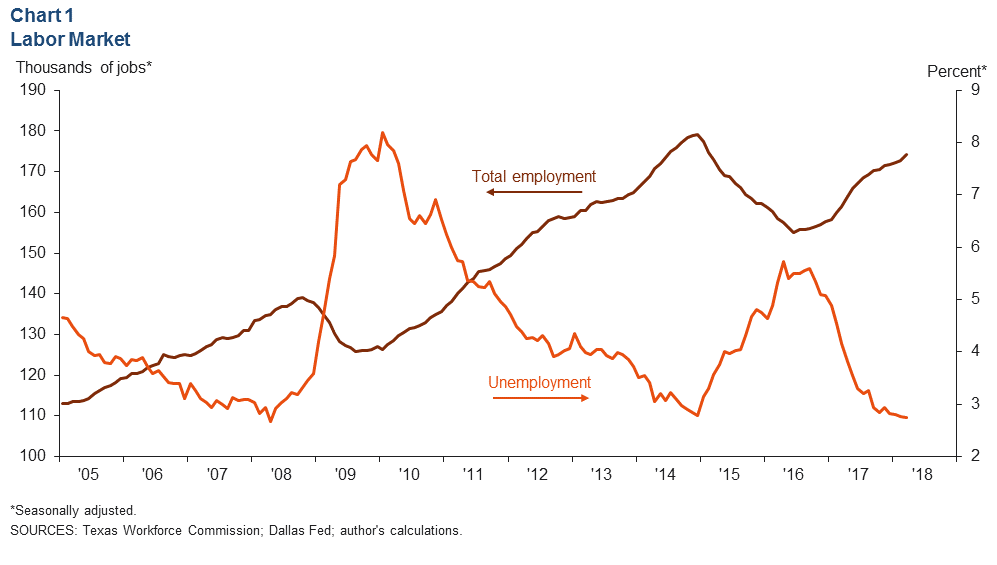
The Permian Basin’s unemployment rate fell to 2.7 percent in March, down from 2.8 percent in February. This is the lowest rate since April 2008, and it comes as the labor force has been steadily making its way toward its December 2014 peak.
Energy
Rig Count and Production Push Forward
The Permian’s oil rig count increased to 463 in the first two weeks of May, up 11 rigs from the end of March (Chart 2). This is the highest reading since January 2015. The U.S. total rig count rose to 844 in the first half of May—the highest level in three years.
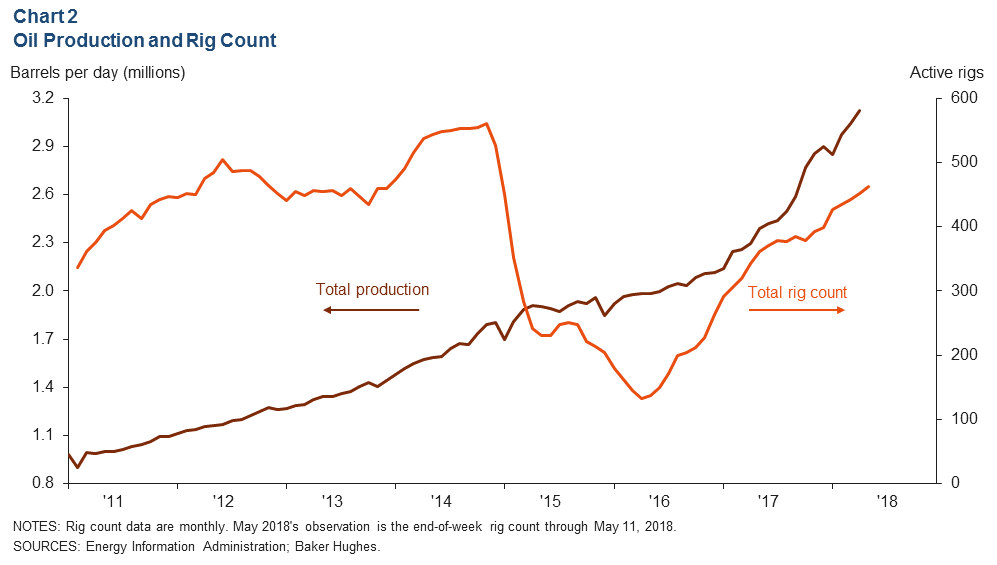
Production grew by about 80,000 barrels per day (b/d) to 3.1 million b/d between March and April. This is the largest increase since November 2017, and the Energy Information Administration expects production to increase to just under 3.2 million b/d during May. While increased production is often a good sign for the Midland–Odessa economy, the Permian Basin is steadily approaching takeaway capacity and could overrun it by early 2019, as reported in the Dallas Fed’s May 2018 Energy Indicators.
Price of West Texas Intermediate Accelerates
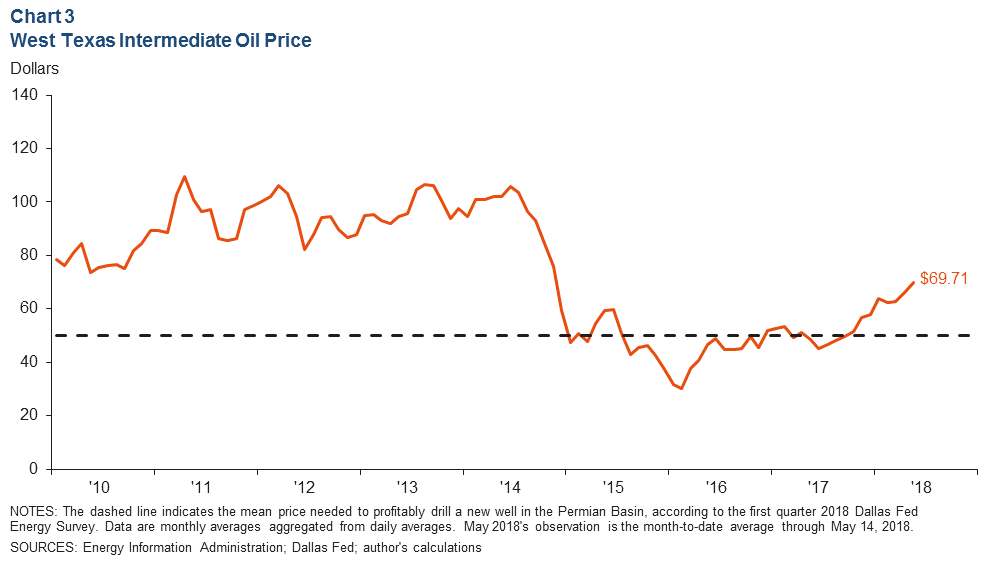
The WTI spot price has averaged just under $70 per barrel during the first half of May (Chart 3). The spot price averaged $66.25 per barrel in April, up from about $62.72 in March. Prices have continued to increase in May as geopolitical forces (the Iran nuclear deal, Venezuela, etc.) support crude oil prices.
Drilled but Uncompleted Wells Fall in Areas Outside Permian
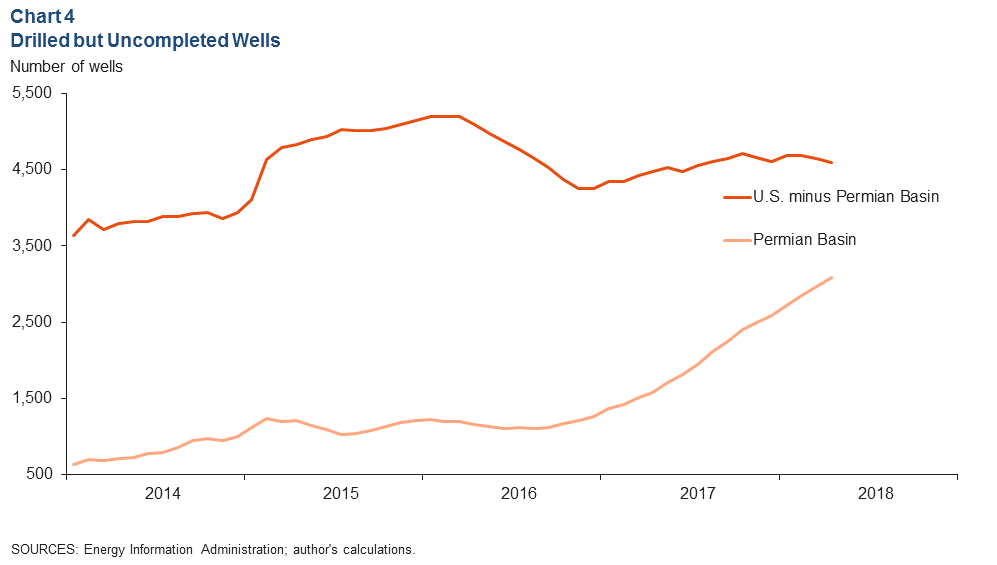
The number of drilled but uncompleted wells (DUCs) in the Permian Basin grew to 3,086 between March and April (Chart 4). While the Permian has been steadily adding DUCs, the DUC count in the rest of the U.S. has been decreasing. That count came in at 4,591 in April—123 lower than the recent peak in November 2017.
Housing
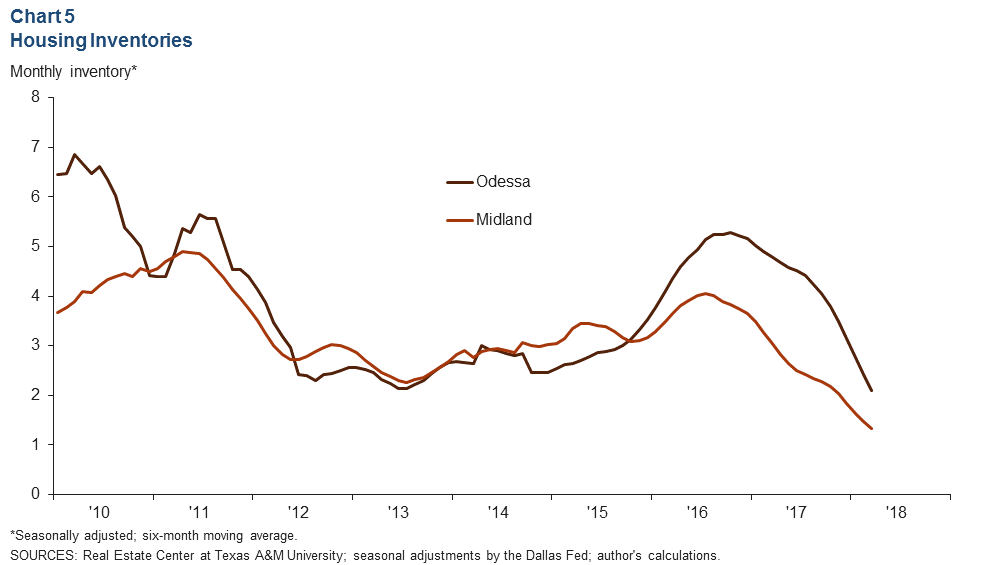
Home Inventories Fall Again
Midland and Odessa’s supply of existing homes continued to decline in March. Midland had 1.3 months of supply, while Odessa had 2.1 months (Chart 5). Odessa’s supply fell by over one month in first quarter 2018. Total listings have fallen by slightly less than half and were at 543 in March.
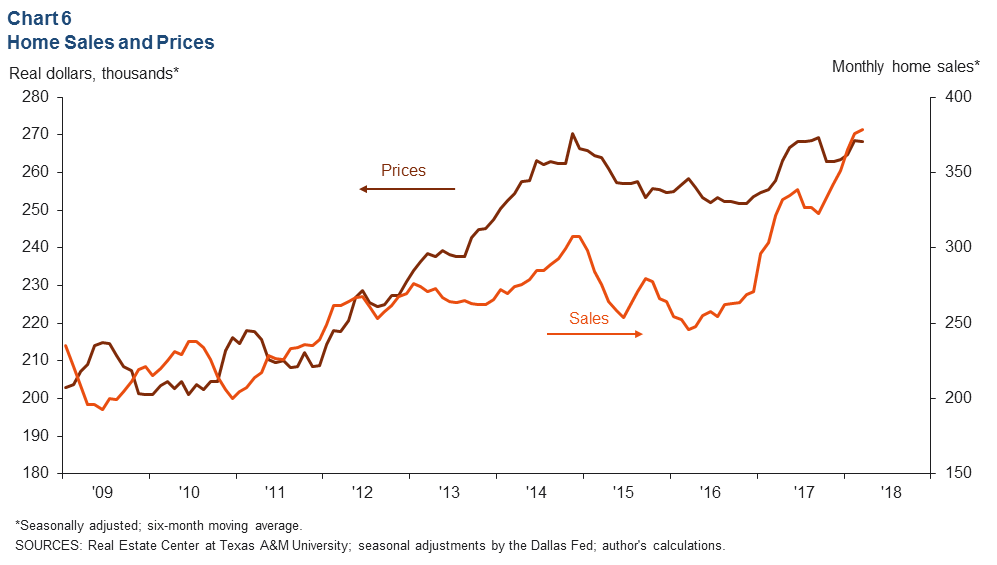
Home Sales Increase with No Change in Price
The six-month moving average for home sales rose slightly to 378 in March—an increase of 18 percent year over year (Chart 6). Prices were essentially unchanged between February and March and stood just above $268,000. It was the first month without an existing-home price increase since November 2017.
NOTES: Data are for the Midland–Odessa metropolitan statistical area (Martin, Midland and Ector counties), except for energy data, which cover the 55 counties in West Texas and southern New Mexico that make up the Permian Basin region. Data may not match previously published numbers due to revisions.
About Permian Basin Economic Indicators
Questions can be addressed to Dylan Szeto at Dylan.Szeto@dal.frb.org. Permian Basin Economic Indicators is released on the third Wednesday of every month.