Southern New Mexico Economic Indicators

New Mexico continues to post robust job gains, while Las Cruces payrolls are stagnant. The labor market is mixed in southern New Mexico, with some counties reporting very tight labor markets and others posting unemployment rates in the double digits. Population growth in the Las Cruces metro slowed in 2018 but still exceeded statewide growth. New Mexico oil production continues to rise, reaching a new high, while the rig count inched down.
Labor Market
New Mexico Posts Solid Job Gains, While Las Cruces Holds Steady
The Las Cruces jobs market has been stagnant in 2019. While some sectors such as government, leisure and hospitality, and construction and mining added jobs, the gains were offset by declines in other sectors, and 200 jobs were lost on net (Chart 1).
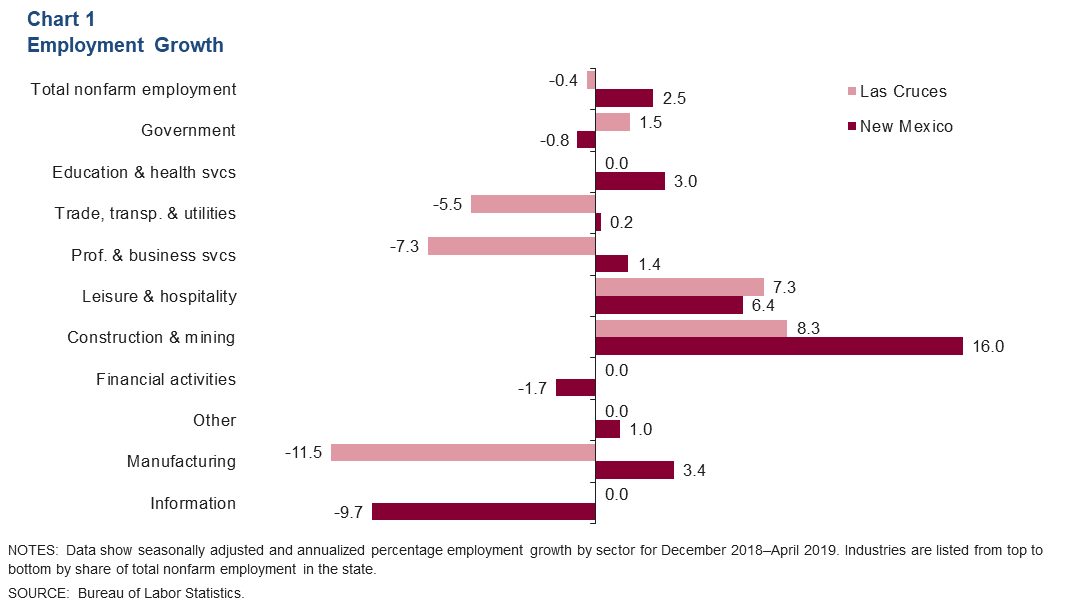
While employment in Las Cruces has barely budged over the year, the state’s growth remains solid. New Mexico jobs grew 2.5 percent, and state payroll gains were broad based, with the majority of sectors expanding. Year to date, construction and mining has added 3,700 jobs, accounting for over half of the total gains.
Southern New Mexico Unemployment Rate Falls in 2019
Robust job gains in southern New Mexico have placed downward pressure on the unemployment rate. In April, the southern New Mexico jobless rate was 4.8 percent (Chart 2). Eddy County had the lowest unemployment rate in southern New Mexico (3.0 percent), while Luna County continued to post the highest rate (12.0 percent).
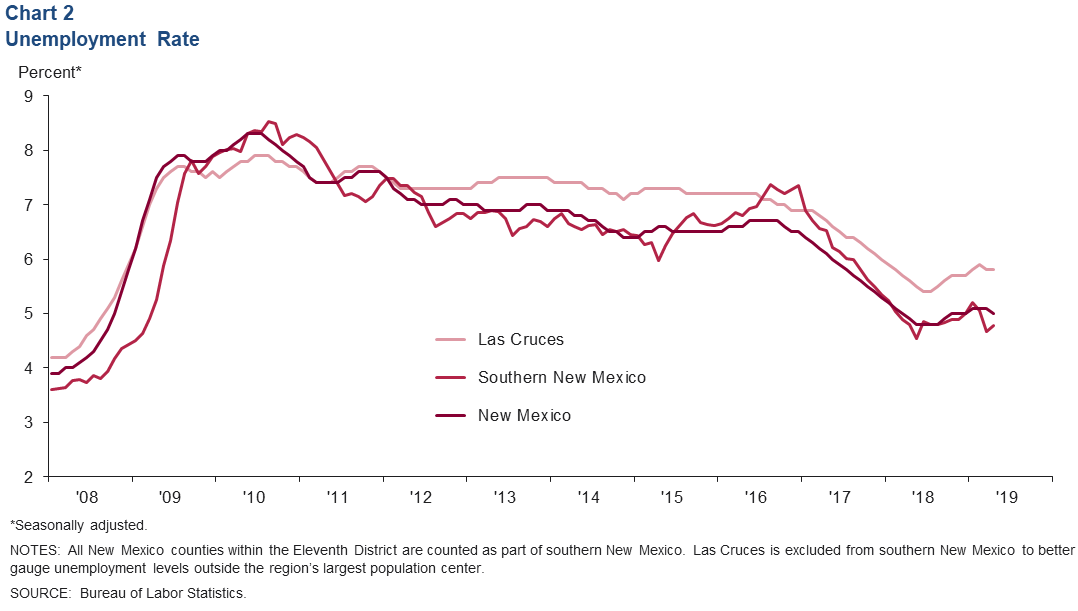
In April, the Las Cruces metro jobless rate of 5.8 percent was above both the southern New Mexico average and the state unemployment rate of 5.0 percent.
Population
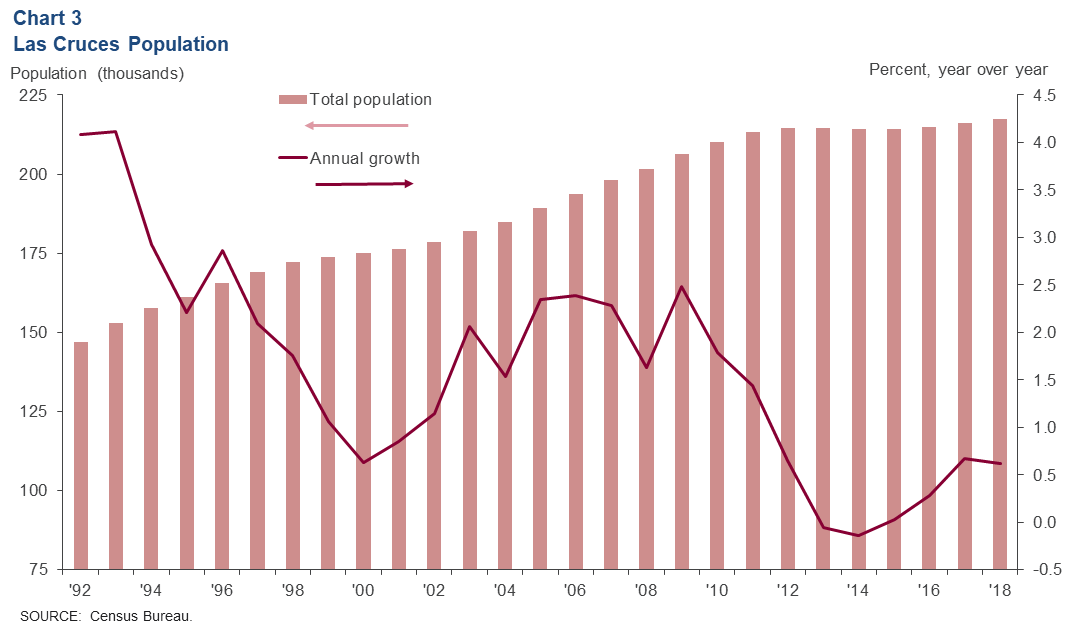
Recently released Census Bureau estimates place the Las Cruces metro area’s 2018 population at 217,522—only 0.6 percent above the 2017 population (Chart 3). The slow population growth was driven in large part by negative net migration. However, slow growth in the metro still outpaced the state’s increase of 0.1 percent.
Santa Teresa Port Trade
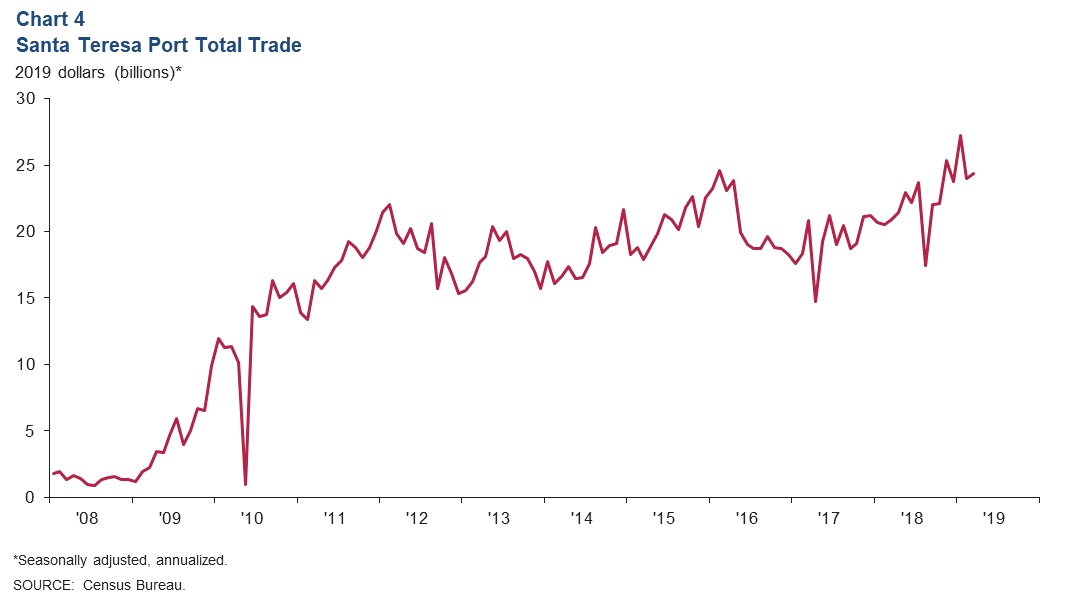
Trade through the Port of Santa Teresa totaled $24.4 billion (annualized) in March, up 16.7 percent from a year earlier (Chart 4). Imports rose 10.4 percent to $12.9 billion, while exports rose 24.7 percent to $11.4 billion. Trade through the Port of Santa Teresa is dominated by shipments of electrical equipment.
Commodity Markets
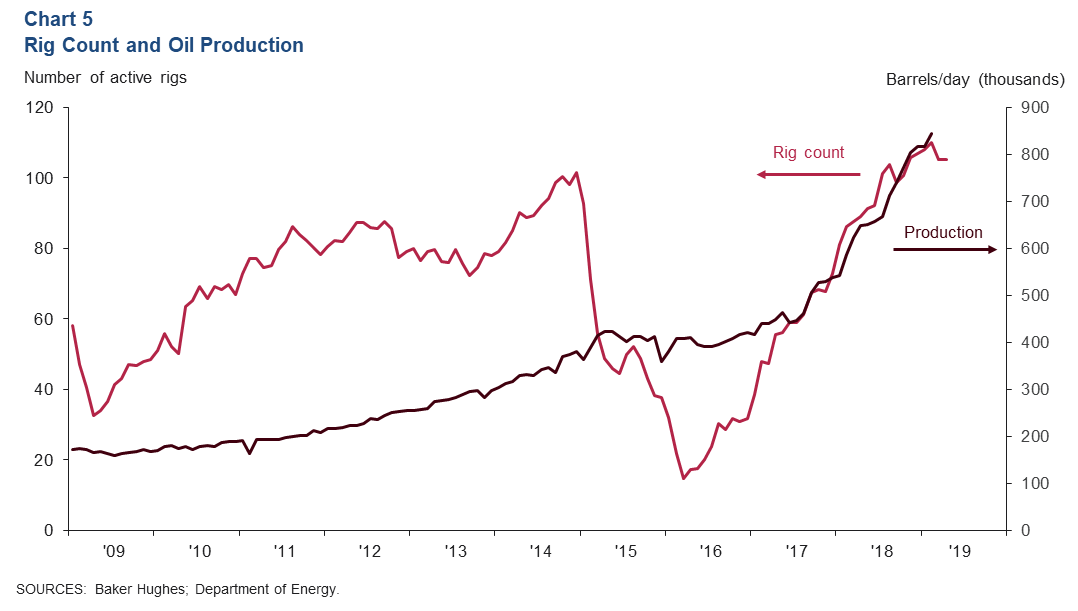
New Mexico Oil Production Hits New High
Oil production continues to rise in New Mexico and climbed to an all-time high of 843,000 barrels per day in February (Chart 5). Rig counts have dipped in the U.S., and New Mexico is not an exception. The state’s rig count was 105 in April, down from its recent peak of 110 in February.
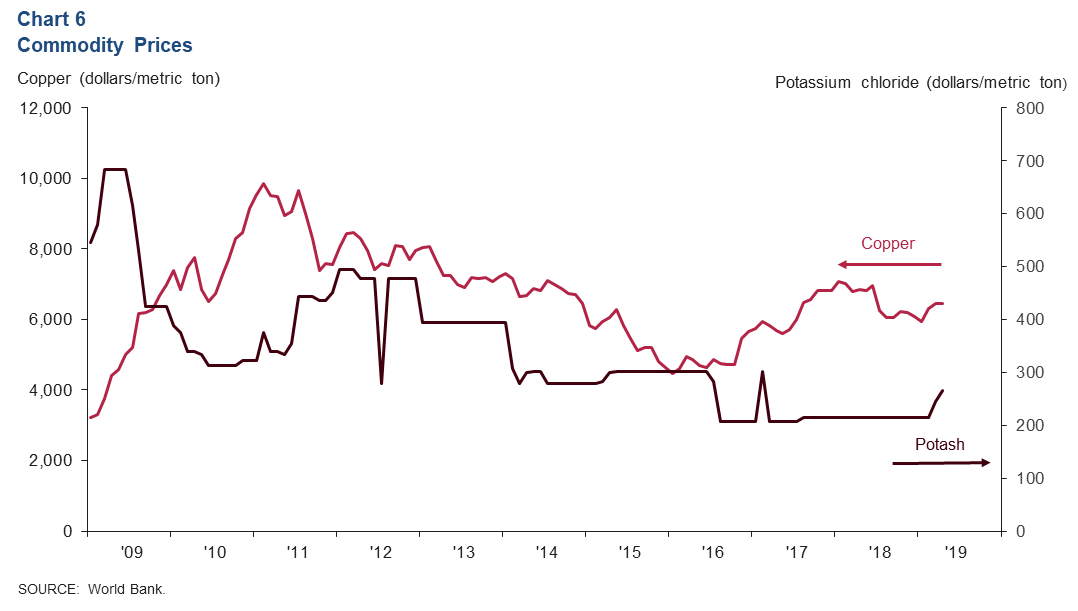
Copper Prices Fall, Potash on the Rise
In addition to oil and natural gas, southern New Mexico's economy is dependent on other commodities, such as potash, copper and silver. According to the New Mexico Energy, Minerals and Natural Resources Department, the state ranked first in the U.S. in domestic potash production and third in copper production in 2017. Potash prices had been stable since mid-2017 at $216 per metric ton but have been rising over the last couple of months (Chart 6). In April, potash prices were $266 per metric ton. On the other hand, copper prices have inched down after rising in early 2019. In April, copper was $6,438 per metric ton, down from $6,439 in March.
NOTES: Data may not match previously published numbers due to revisions. All New Mexico counties within the Federal Reserve’s Eleventh District are counted as part of southern New Mexico. Las Cruces is excluded from southern New Mexico to better gauge unemployment levels outside the region’s largest population center.
About Southern New Mexico Economic Indicators
Questions can be addressed to Marycruz De León at marycruz.deleon@dal.frb.org. Southern New Mexico Economic Indicators is released quarterly.