Southern New Mexico Economic Indicators

First Quarter 2020
Las Cruces payrolls grew modestly in 2019, while New Mexico overall posted solid employment gains. Southern New Mexico employment also expanded, driven by robust growth in Lea and Eddy counties. Housing sales slowed in Las Cruces, and the median home price ticked up. Trade through the Santa Teresa port and oil production both reached new highs in 2019.
Labor Market
Las Cruces Lags State Employment Growth
In 2019, Las Cruces employment rose 0.5 percent, down from 2018’s gain of 1.7 percent. Job growth in the metro was mixed. While sectors including government and education and health services added jobs, the gains were mostly offset by declines in sectors such as financial activities and information. Overall, the metro added 400 jobs (Chart 1).
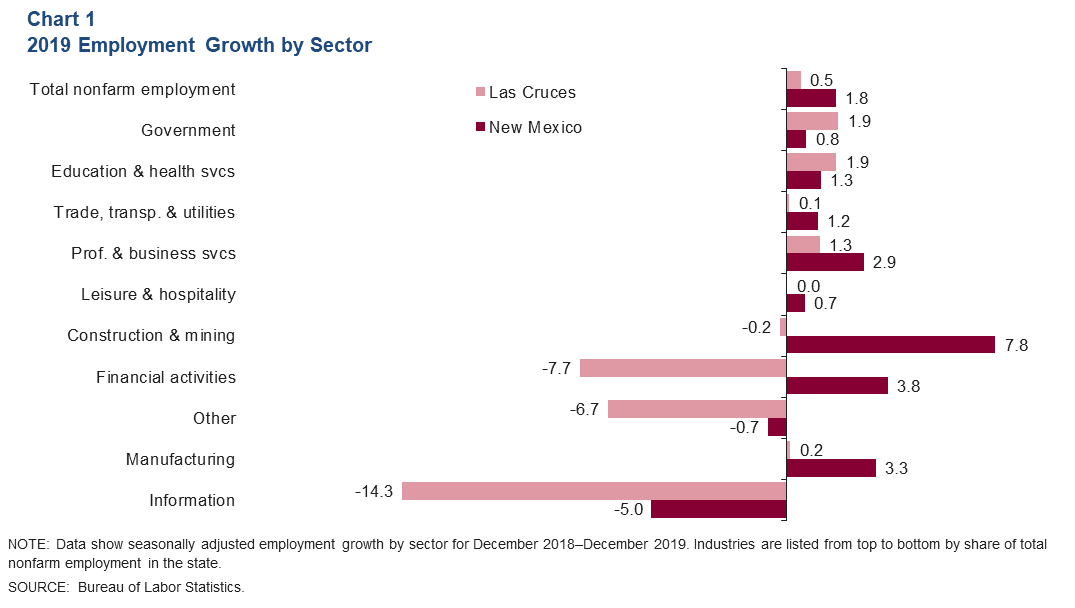
Meanwhile, the state posted solid job growth in 2019. Payrolls expanded 1.8 percent in 2019, stronger than the 1.2 percent in 2018. Nearly all sectors posted gains, and the state added over 15,600 jobs. The fastest-growing sector was construction and mining, which rose 7.8 percent and added 5,700 jobs. Job gains in southern New Mexico have been strong, with employment growing 3.1 percent in 2019.
Unemployment Trends Down in Southern New Mexico
In December 2019, the southern New Mexico unemployment rate stood at 4.6 percent, down from 5.0 percent a year earlier (Chart 2). Eddy County had the lowest unemployment rate in the region at 2.9 percent.
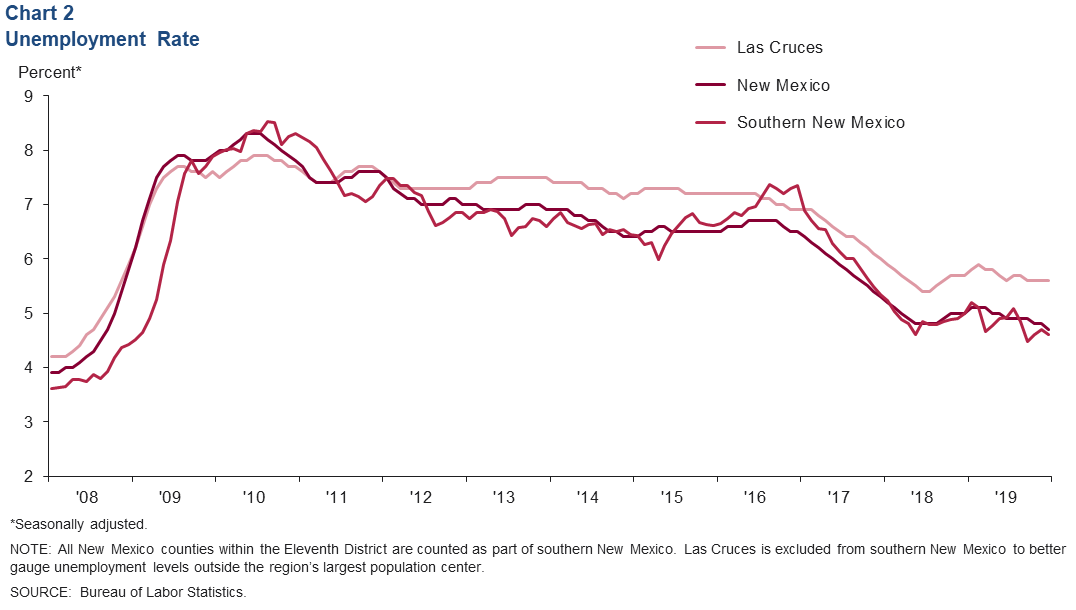
The Las Cruces unemployment rate was steady in the last half of 2019. The rate stood at 5.6 percent in December, well above the southern New Mexico rate and the state rate of 4.7 percent.
Housing
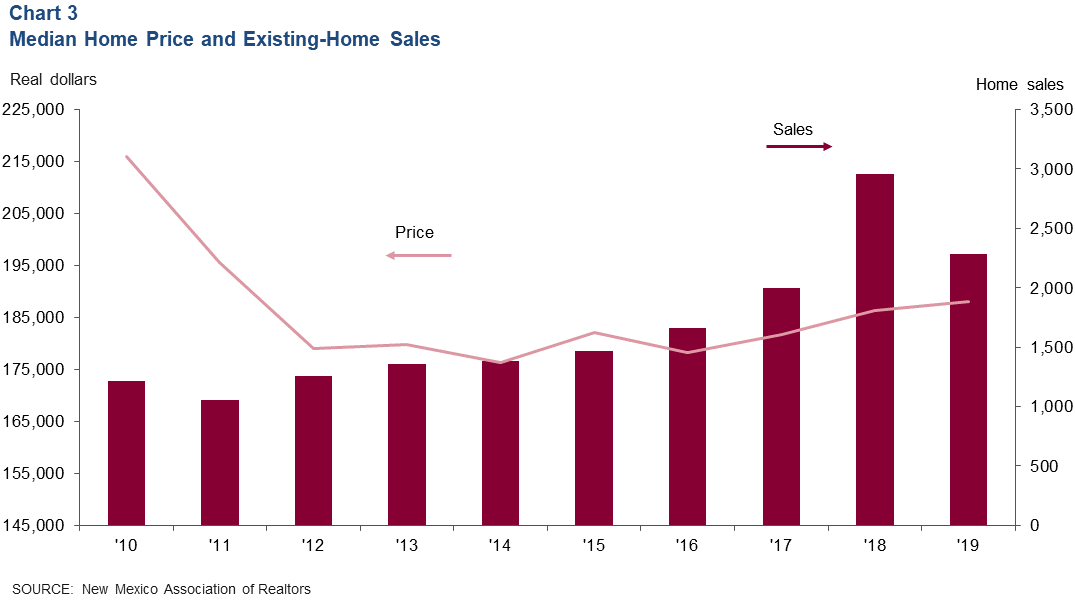
Existing-home sales in Las Cruces fell 22.7 percent, from 2,995 in 2018 to 2,283 in 2019 (Chart 3). While sales declined steeply, the 2019 level was in line with the long-term trend. The median home price inched up to $188,000 in 2019 from $183,000 the previous year.
Santa Teresa Port Trade
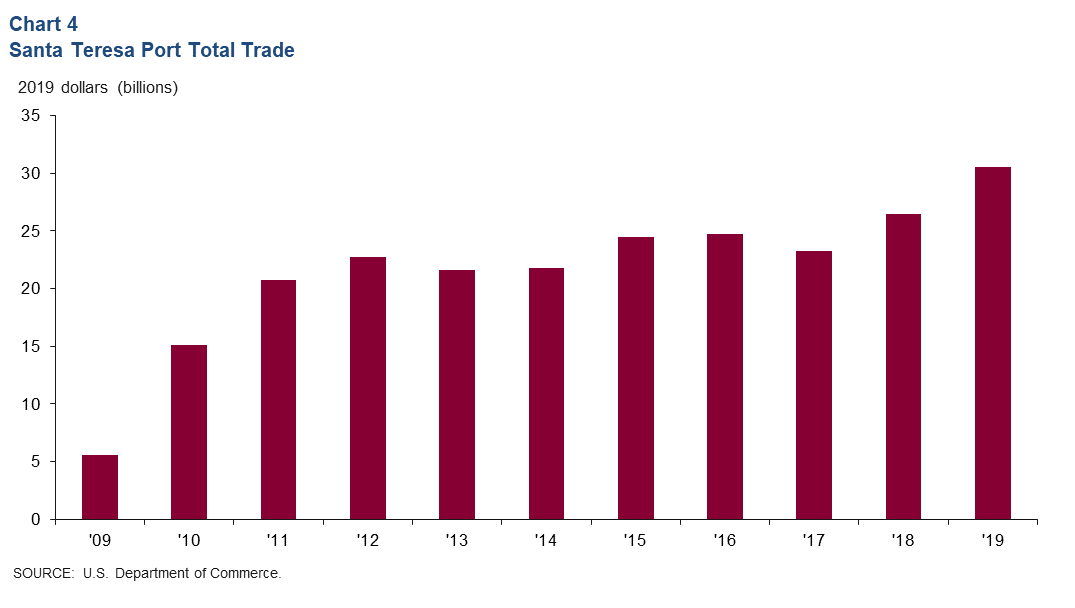
Trade through the Santa Teresa Port of Entry surpassed $30 billion for the first time (Chart 4). Total trade summed to $30.5 billion in 2019, up 15.3 percent from 2018. Imports rose 12.4 percent to $16.4 billion, and exports rose 18.8 percent to $14.1 billion.
Commodity Markets
Oil Production Still on the Rise
Growth in the rig count flattened during 2019, with the number of rigs hovering slightly above 100 (Chart 5). However, production continues to grow strongly. In November 2019, production was estimated at an all-time high of 1.063 million barrels per day.
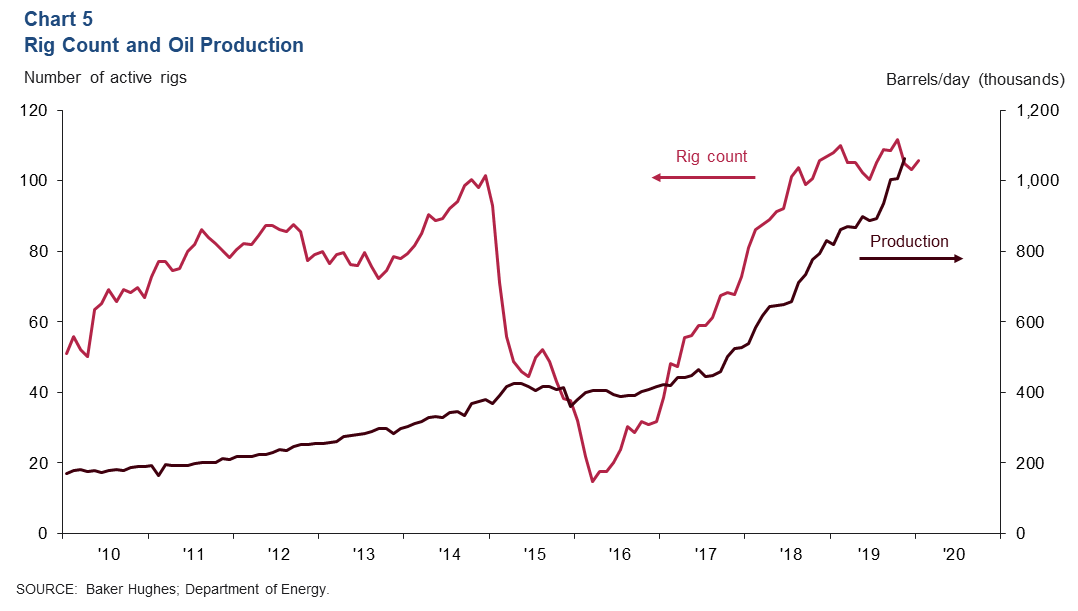
Growth in the oil industry is expected to be softer in 2020 as global oil demand is forecast to slow and capital spending is expected to fall.
Copper and Potash Prices Dip
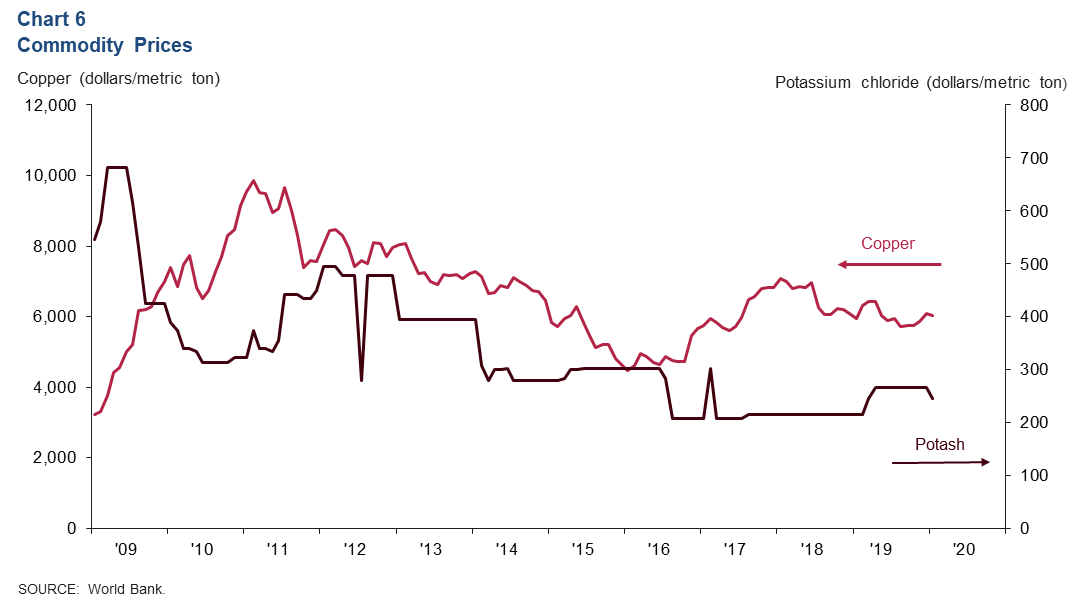
In addition to oil and natural gas, southern New Mexico's economy is dependent on other commodities, such as potash, copper and silver. The state ranked first among the states in domestic potash production and third in copper production in 2018, according to the New Mexico Energy, Minerals and Natural Resources Department. Potash prices fell in January to $245 per metric ton, down from $265.50 in December (Chart 6). Copper prices also inched down $6,077 per metric ton in December to $6,031 in January.
NOTES: Data may not match previously published numbers due to revisions. All New Mexico counties within the Federal Reserve’s Eleventh District are counted as part of southern New Mexico. Las Cruces is excluded from southern New Mexico to better gauge unemployment levels outside the region’s largest population center.
About Southern New Mexico Economic Indicators
Questions can be addressed to Marycruz De León at marycruz.deleon@dal.frb.org. Southern New Mexico Economic Indicators is released quarterly.