Southern New Mexico Economic Indicators

Second Quarter 2020
Las Cruces and New Mexico payrolls saw unprecedented monthly contractions in April, driven by the COVID-19 pandemic disruptions. Housing sales slowed in Las Cruces, while the median home price reached a 10-year high. Trade through the Santa Teresa port faltered, and commodity prices weakened.
Labor Market
Las Cruces Employment Sees Broad-Based Declines
Las Cruces payroll employment fell an annualized 75.2 percent (-11.0 percent non-annualized, or -8,156 jobs) from March to April (Chart 1). Jobs losses were widespread and led by declines in leisure and hospitality (-4,225 jobs non-annualized) and education and health services (-1,175 jobs non-annualized). Year to date, payrolls contracted an annualized 28.7 percent (-10.7 percent non-annualized, or -7,906 jobs) in the metro.
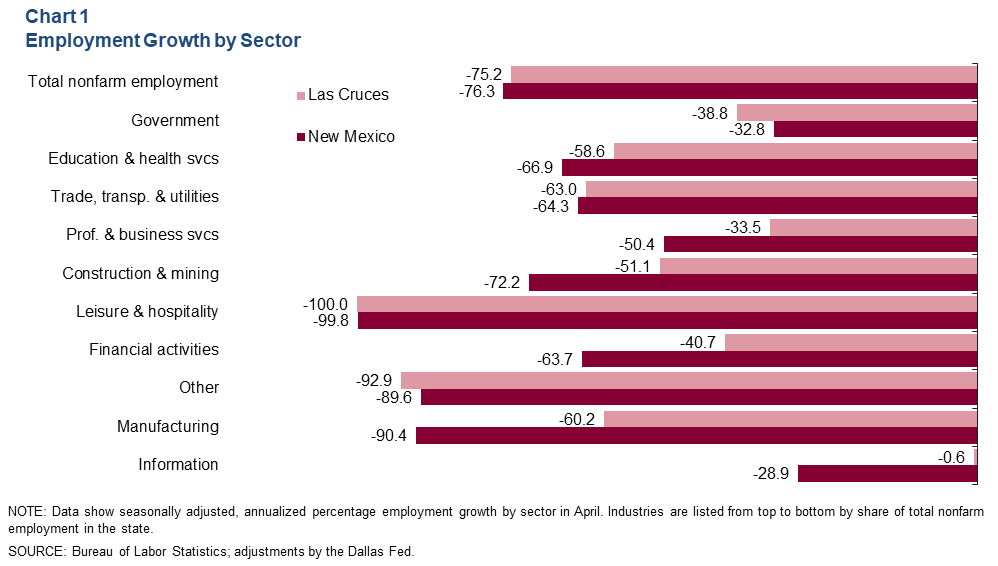
Similarly, the state labor market shrank 76.3 percent in April (-11.3 percent non-annualized, or -97,600 jobs). Declines in New Mexico employment were led by leisure and hospitality (-40,000 jobs non-annualized), education and health services (-12,600 jobs non-annualized) and trade, transportation and utilities (-11,400 jobs non-annualized). Since the beginning of 2020, payrolls have contracted an annualized 30.0 percent (-11.2 percent non-annualized, or -96,500 jobs) in the state.
Unemployment Climbs
Payroll reductions have pushed up the unemployment rate. In April, southern New Mexico’s jobless rate was 9.9 percent, up from 6.4 percent in March (Chart 2). Luna County’s unemployment rate was the highest in southern New Mexico at 14.9 percent.
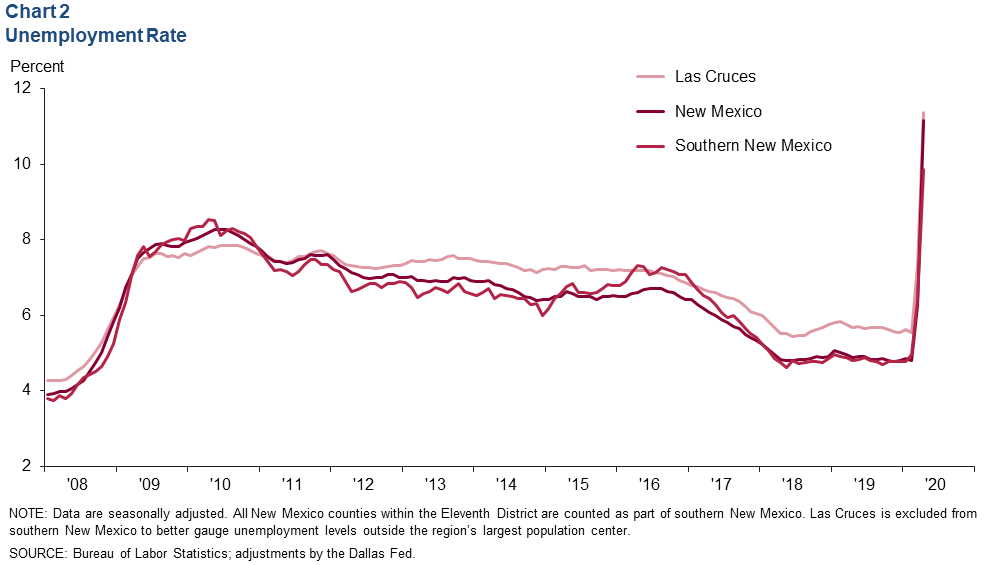
Meanwhile, the unemployment rate in Las Cruces increased from 7.4 percent in March to 11.4 percent in April. New Mexico’s monthly unemployment rate also increased from 6.2 percent to 11.2 percent in April.
Housing
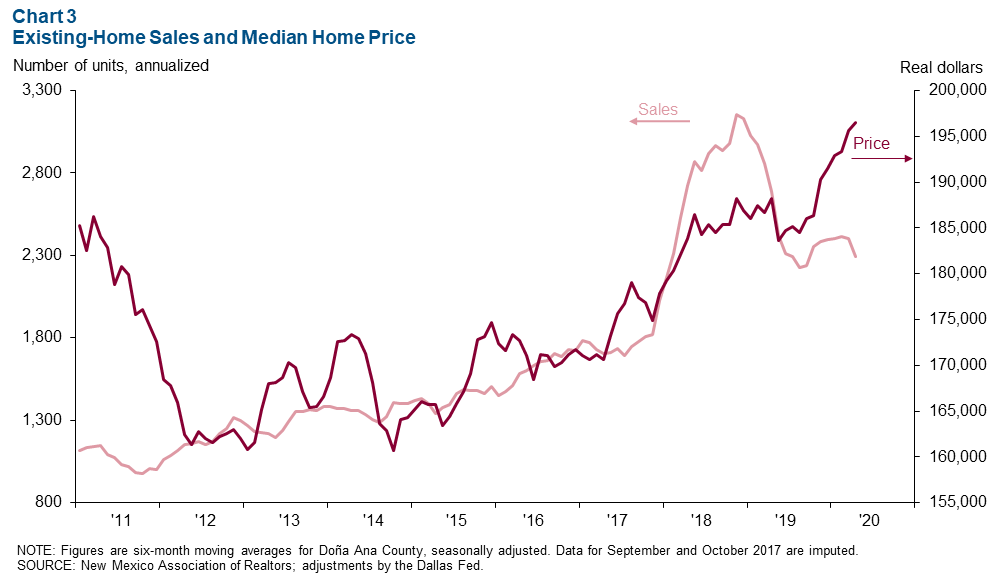
Annualized existing-home sales in Las Cruces fell 14.7 percent to 2,295 in April (Chart 3). The median price of homes sold in Las Cruces reached a 10-year high at $196,521, or a year-over-year increase of 4.4 percent.
Santa Teresa Port Trade
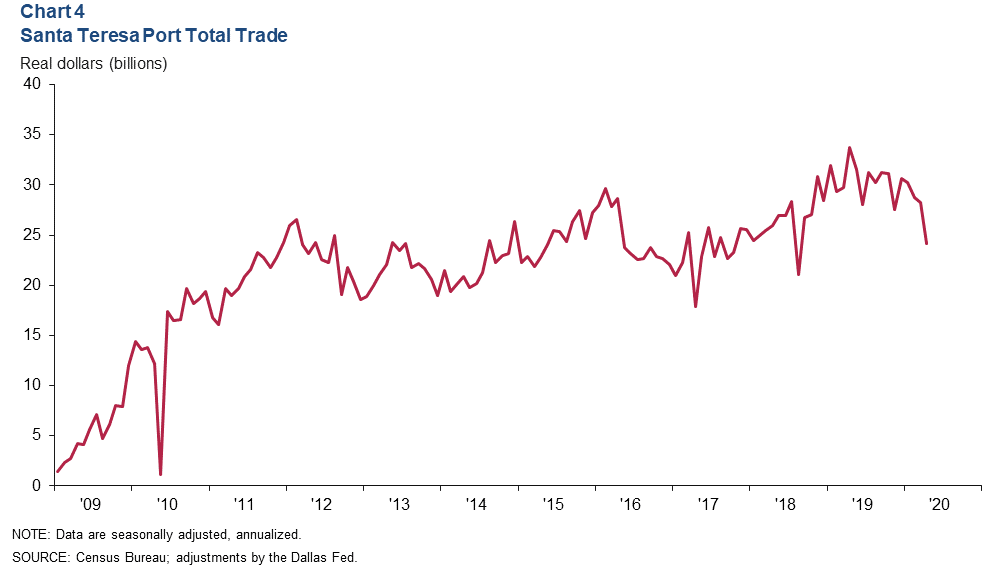
Annualized total trade through the Santa Teresa Port of Entry was $24.2 billion in April, down 28.5 percent from a year prior (Chart 4). The drop in total trade was driven by a 32.3 percent decline in exports and a 25.4 percent decline in imports year over year. Imports totaled $13.9 billion in April, and exports equaled $10.3 billion.
Commodity Markets
Rig Count Plunges
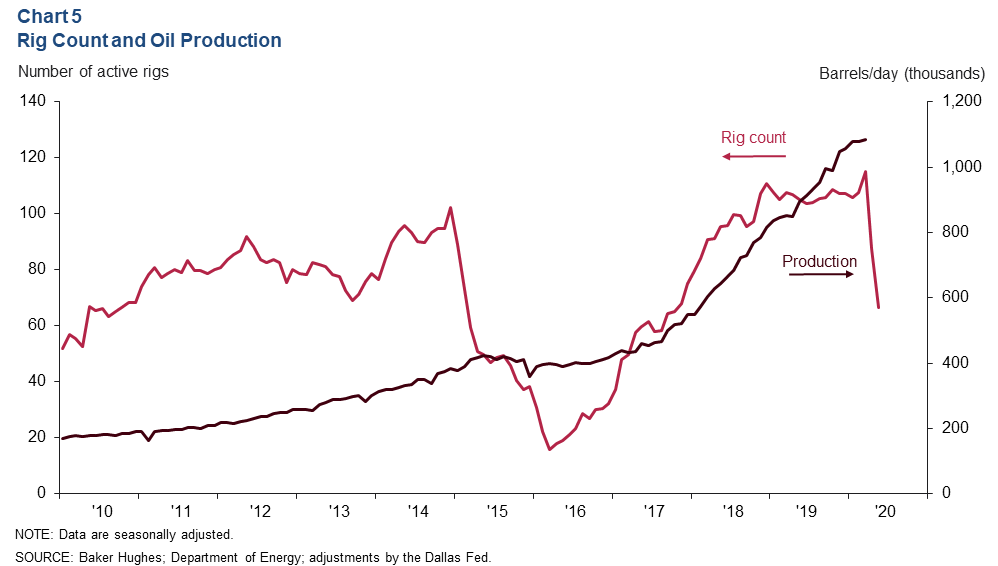
The rig count took a nosedive in May, falling 24.0 percent to 67 rigs (Chart 5). This is the lowest rig count since late 2017. However, the latest oil production figures available indicated growth. In March, oil production recorded a 15-year high of nearly 1.1 million barrels per day.
Copper Prices Tick Up, Potash Falls
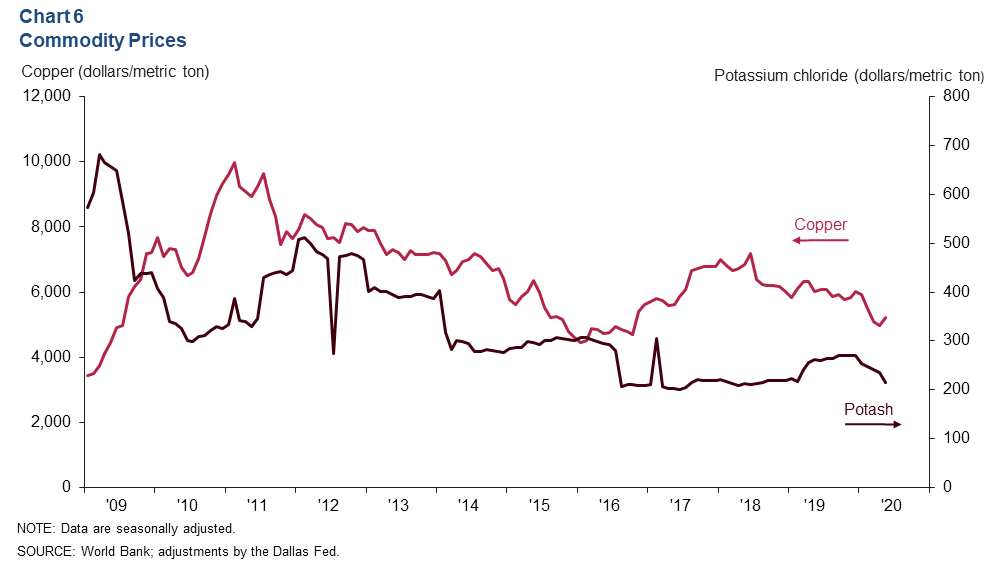
In addition to oil and natural gas, southern New Mexico's economy is dependent on other commodities, such as potash, copper and silver. Potash prices fell in May to $213.64 per metric ton, down from $262.08 a year ago (Chart 6). Copper prices ticked up to $5,214 per metric ton from April to May of this year but were down from $6,004 per metric ton in May 2019.
NOTES: Data may not match previously published numbers due to revisions. All New Mexico counties within the Federal Reserve’s Eleventh District are counted as part of southern New Mexico. Las Cruces is excluded from southern New Mexico to better gauge unemployment levels outside the region’s largest population center.
About Southern New Mexico Economic Indicators
Questions can be addressed to Keighton Allen at Keighton.Allen@dal.frb.org. Southern New Mexico Economic Indicators is released quarterly.