Texas Economic Indicators

August 25, 2021
Texas’ economic recovery continued in July as payrolls grew strongly and the unemployment rate declined. Texas Business Outlook Surveys (TBOS) indicated robust expansion in manufacturing and services but stagnant retail sales activity. Oil prices slipped, but the rig count grew in the week ending Aug. 20. The Texas Leading Index fell in July, while the Texas Business-Cycle Index continued to rise but at a decelerating rate.
Labor market
Texas employment growth continues
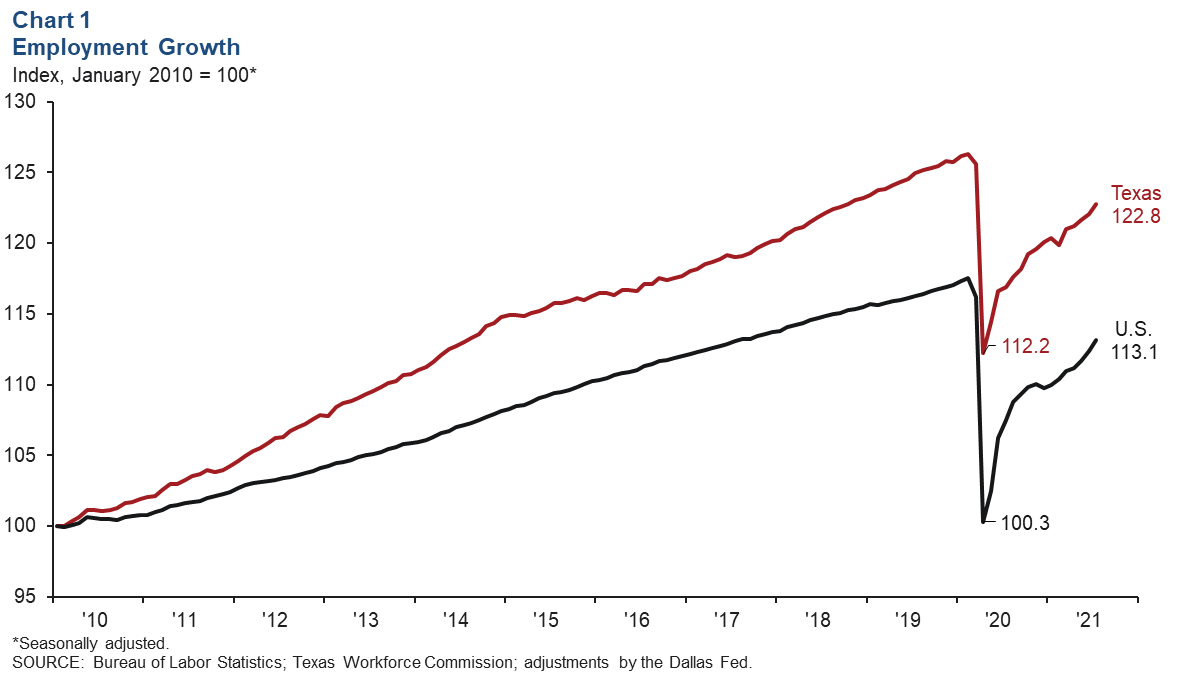
Texas employment expanded an annualized 7.1 percent in July after growing an upwardly revised 4.3 percent in June (Chart 1). Leisure and hospitality led the expansion, increasing an annualized 21.8 percent. Through July, employment rose an annualized 3.9 percent statewide, slower than the nation’s 5.3 percent increase. The Dallas Fed’s Texas Employment Forecast is for 4.3 percent growth this year (December/December), down from its estimate of 5.6 percent in July.
Texas unemployment dips
The Texas unemployment rate declined from 6.5 percent in June to 6.2 percent in July (Chart 2). Meanwhile, the U.S. jobless rate declined from 5.9 percent to 5.4 percent. Since April, the statewide unemployment rate has steadily decreased and is at its lowest level since April 2020.
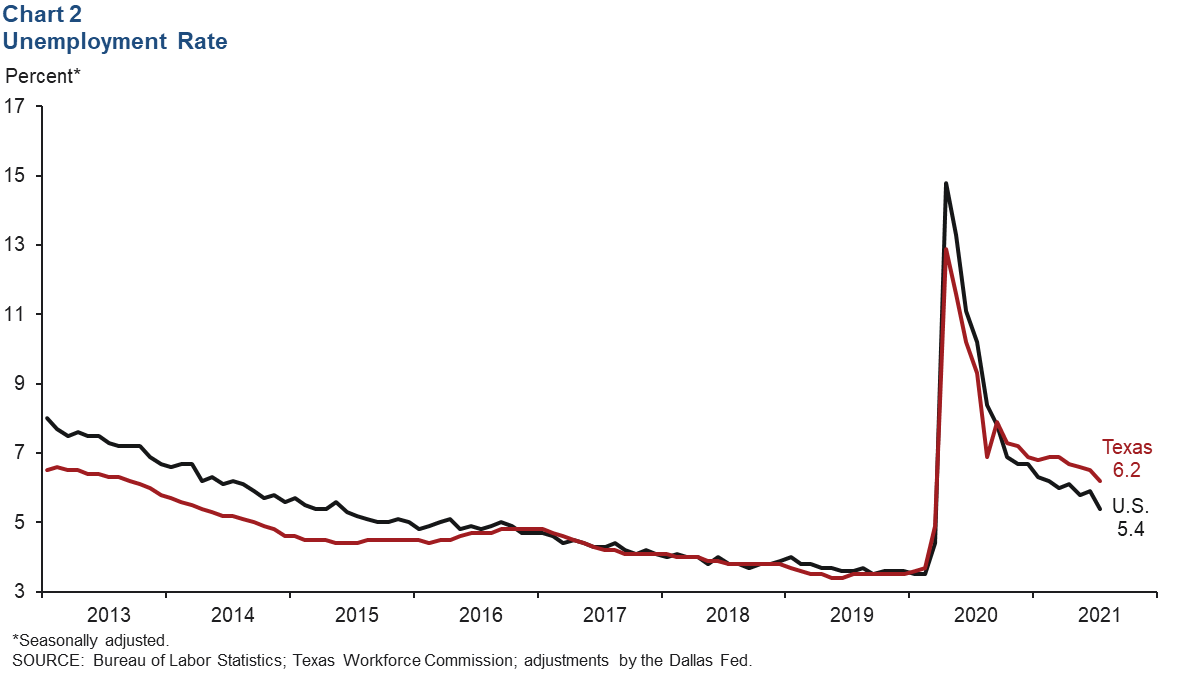
The unemployment rates in all major Texas metros fell in July. The steepest drop was in McAllen, where the rate fell 0.8 percentage points to 9.5 percent, still the highest among the major Texas metros ahead of Houston at 6.5 percent. San Antonio had a 0.5 percentage-point dip to 5.0 percent. Dallas saw the smallest decline in July at 0.3 percentage points, and its rate also stood at 5.0 percent.
Texas Business Outlook Surveys
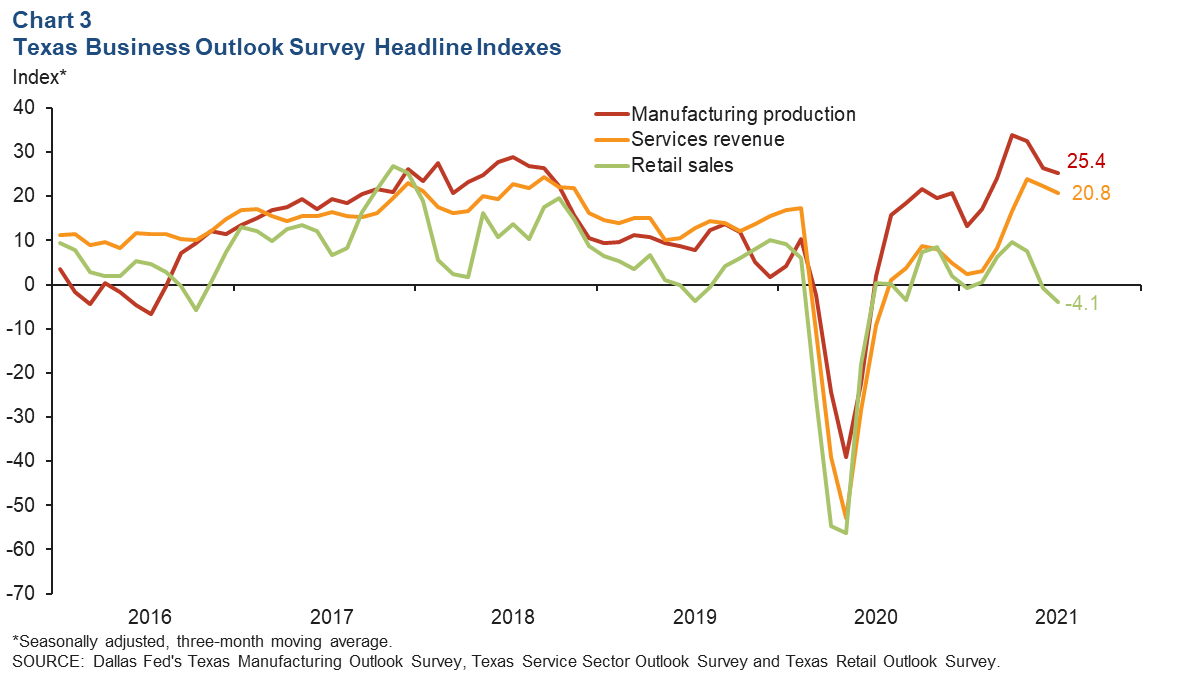
In July, the three-month moving averages of all TBOS headline indexes fell (Chart 3). The smoothed retail index remained below zero, though manufacturing and service sector indexes reflected continued robust expansion. The manufacturing survey’s production index remains well above average, and the service sector has seen continued growth in the revenue, employment and hours worked indexes. Expectations regarding general business conditions six months ahead remain high, indicating continued optimism for future business activity amid the COVID-19 pandemic.
Texas leading index
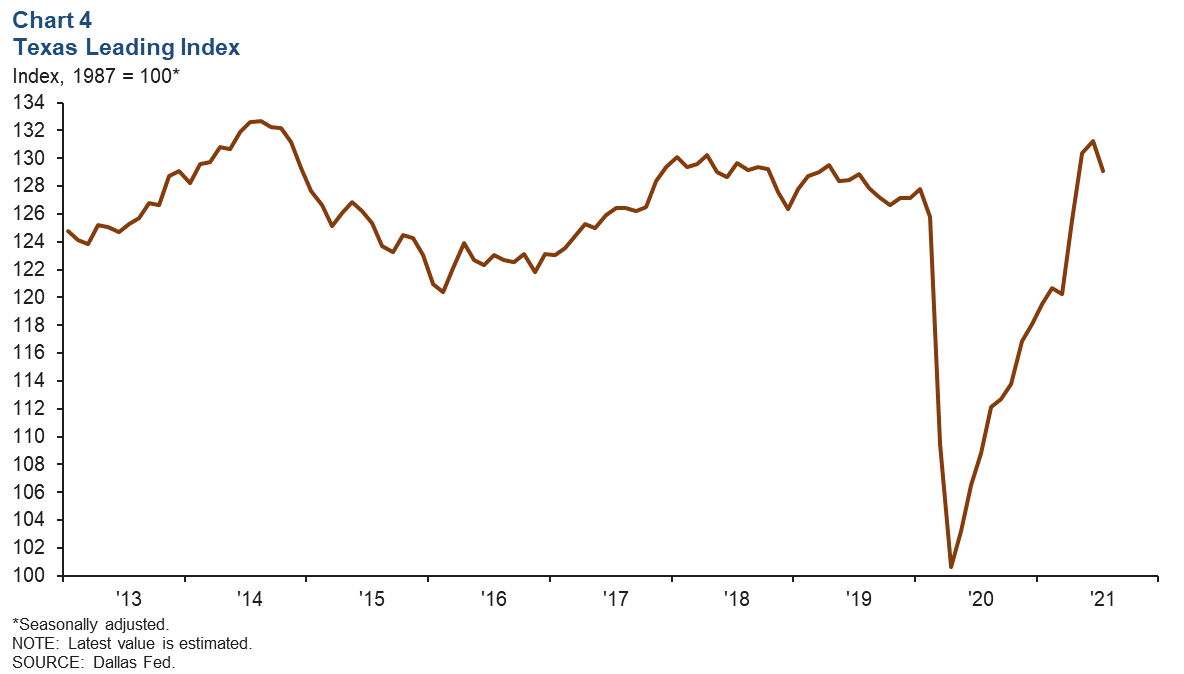
The Texas Leading Index is a composite of eight leading indicators that sheds light on the future of the state’s economy. In July, the index decreased 1.6 percent largely due to a rise in initial claims for unemployment (Chart 4). However, the three-month change remains positive, suggesting growth over the next three to six months.
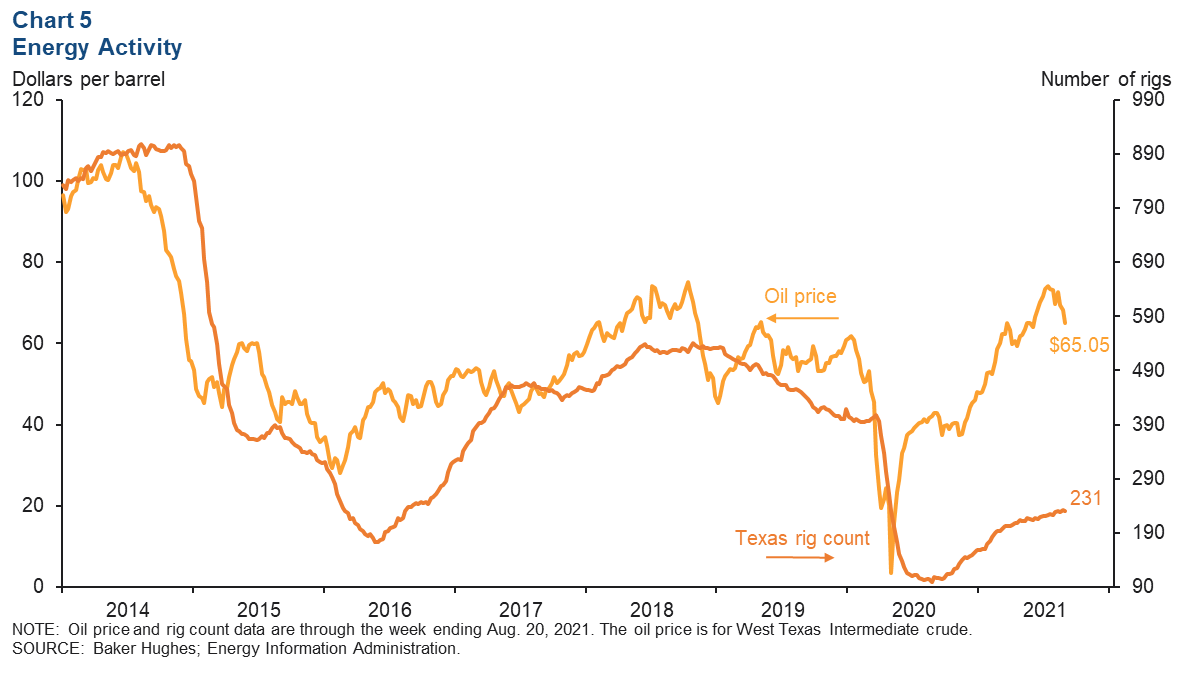
Energy
In the first half of August, the rig count steadily increased but remained far below prepandemic levels (Chart 5). Oil prices have surpassed levels seen in February 2020 and were at $65.05 as of the week ending Aug. 20.
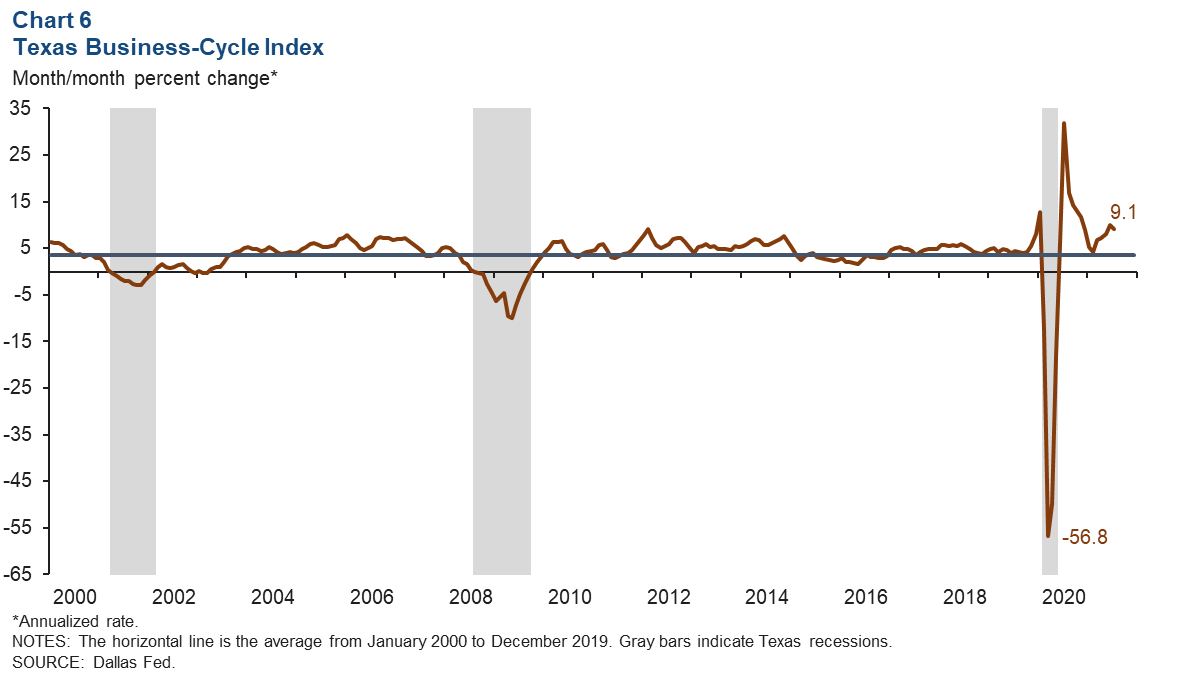
Business-cycle index
The Texas Business-Cycle Index, a composite of the unemployment rate, state payroll employment and gross state product, measures underlying economic activity in the state. In July, the index rose an annualized 9.1 percent, marking the 14th straight month of growth (Chart 6). Despite the continued recovery, the July index reading remains 2.5 percent below prepandemic levels in February 2020.
NOTE: Data may not match previously published numbers due to revisions.
About Texas Economic Indicators
Questions can be addressed to Laila Assanie at Laila.Assanie@dal.frb.org. Texas Economic Indicators is published every month during the week after state and metro employment data are released.