Agricultural Survey

Third Quarter 2020
Third Quarter 2020
Survey Highlights
Bankers responding to the third-quarter survey reported overall weaker conditions across most regions of the Eleventh District. They noted that drought conditions along with low commodity prices continue to have producers concerned about 2020. “We have seen an impact from COVID-19 on our ag customers in the form of lower commodity prices,” a survey participant said. Some regions have seen an influx of people interested in moving to rural areas from larger cities, which has benefited land prices.
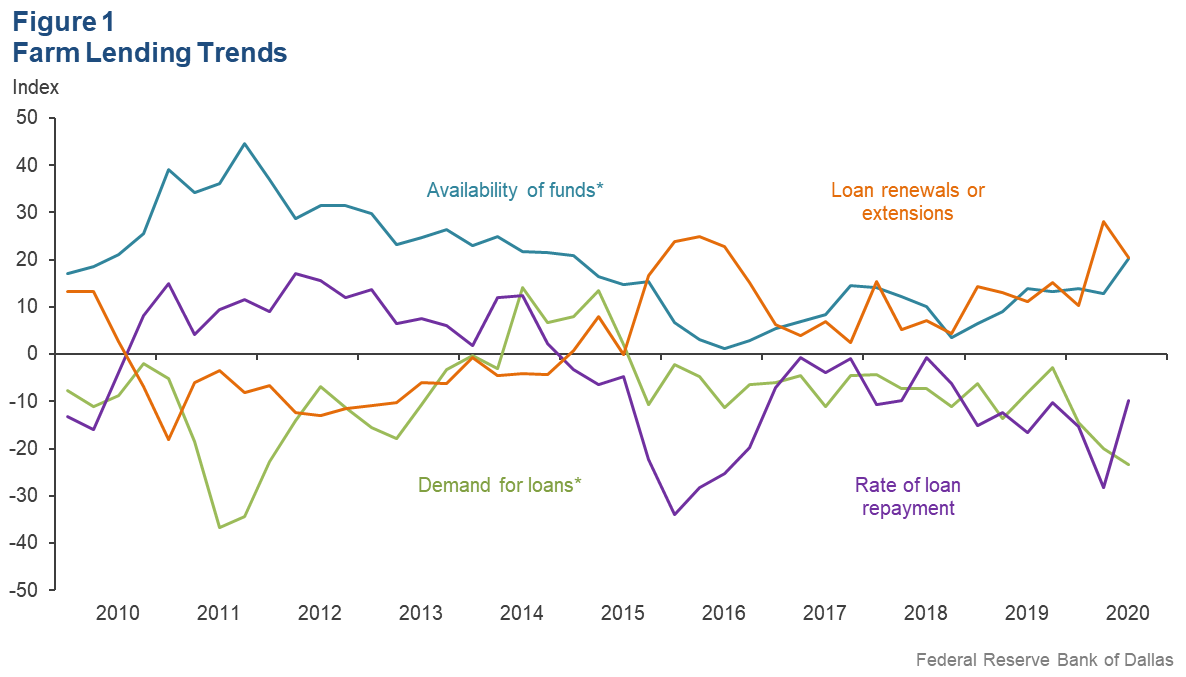
Demand for agricultural loans continued to decline, with the loan demand index registering its 20th quarter in negative territory. Loan renewals or extensions increased this quarter while the rate of loan repayment continued to decline. Loan volume decreased across all major categories compared with a year ago (Figure 1).
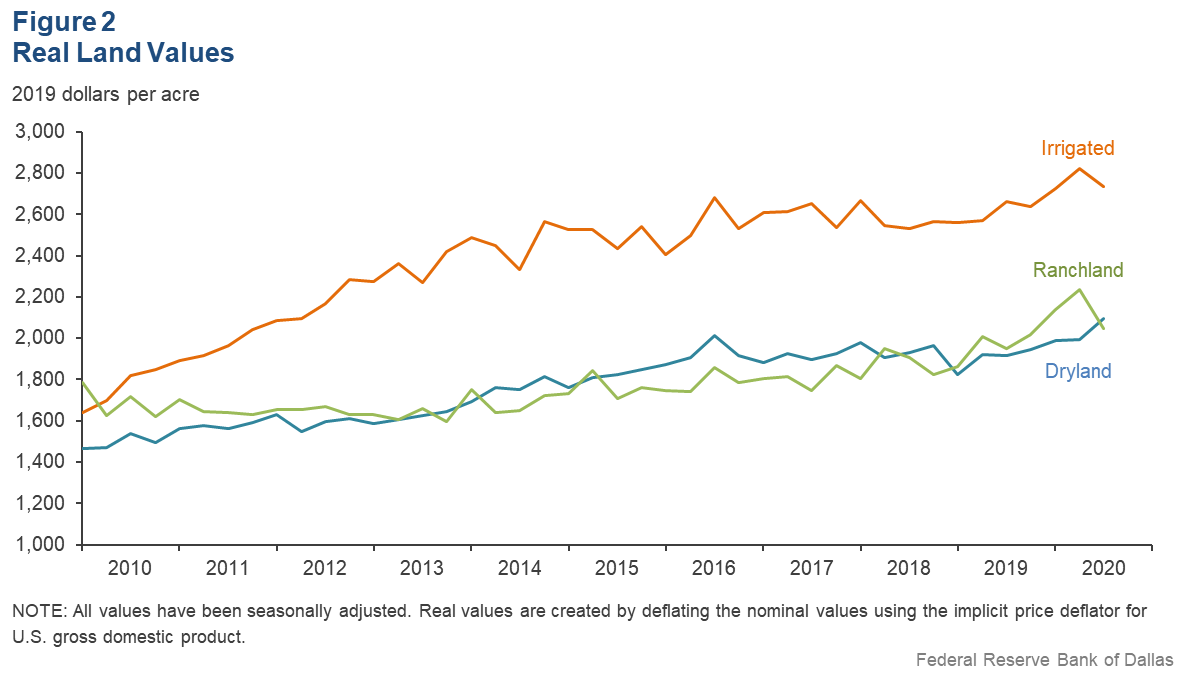
Irrigated and ranchland values fell this quarter, while dryland values increased (Figure 2). According to bankers who responded in both this quarter and third quarter 2019, nominal dry and irrigated cropland and ranchland values increased year over year in Texas and southern New Mexico (Table 1).
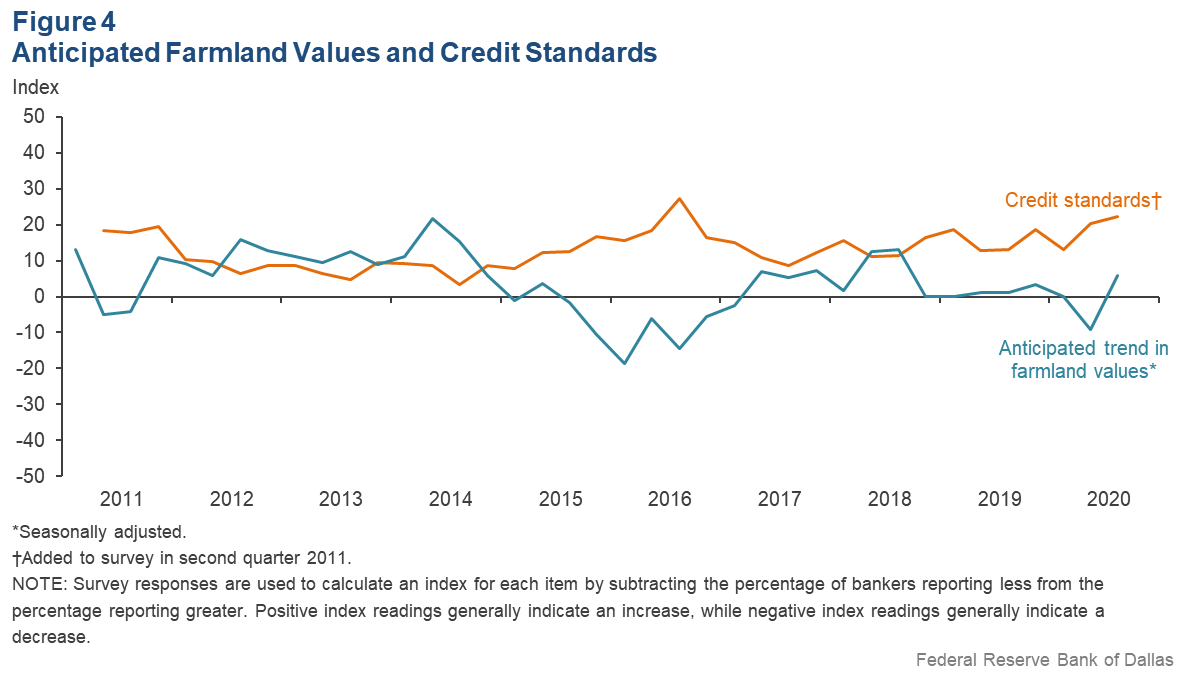
The anticipated trend in farmland values index grew in third quarter 2020, suggesting respondents expect farmland values to increase. The credit standards index went up, indicating further tightening of standards on net (Figure 4).
Next release: December 28
|
Data were collected September 1–9, and 106 bankers responded to the survey. Agricultural Survey is compiled from a survey of Eleventh District agricultural bankers, and data have been seasonally adjusted as necessary. |
Quarterly Comments

District bankers were asked for additional comments concerning agricultural land values and credit conditions. These comments have been edited for publication.
Region 1—Northern High Plains
- Drought conditions along with low commodity prices continue to have producers concerned about 2020.
- We are just trying to ride out the year and, hopefully, press “reset” for 2021. We very much appreciate the efforts of the Independent Bankers Association of Texas to simplify the forgiveness provision on Paycheck Protection Program loans.
- If the current drought does not break, there will soon be a large selloff of cows, and no wheat will be available to feed stocker calves.
- We have seen an impact from COVID-19 on our ag customers in the form of lower commodity prices. Continued pressure from the global market with the ongoing pandemic has encouraged producers to monitor their operations closely and take advantage of future marketing opportunities. Locally, the fall harvest is just kicking off, and with some recent moisture, we should see some good yields. Cotton in the area looks promising and seemed to get the heat and dry weather at the right time with the moisture to mature the crop. Wheat harvest was average, and planting will soon start again. However, it is uncertain what recent unseasonably cold weather will do to the cotton, corn and milo that are in the fields. Cattle prices have jumped around but overall have remained manageable. Producers aren’t getting rich in the ag markets, but breakeven seems to be attainable with careful management practices. There’s not an industry that hasn’t been affected by the pandemic, but the ag industry seems to be holding its own in rural parts. With help from local banks, we all will prevail on the other side and be better equipped and more prepared should this ever happen again.
Region 2—Southern High Plains
- Our area is still in drought mode, and dryland cotton has mostly been failed. Irrigated crops are about average. Cattle are in good condition. There is a need for the government to pay the Wildfire and Hurricane Indemnity Program funds and any disaster funds approved for this year. All are ready for 2020 to be in the past.
- Current drought conditions and low prices will make this a very hard year. Producers of every crop are seeing yield and price damage. Additionally, government assistance is needed soon.
- Crops on the South Plains are fair to poor with some pockets of good growth. It depends on where you farm and if you were under a cloud at the time of the rain. Irrigated crops look decent, but the cost associated with that production is out of sight, and with the current prices, it will be bleak. We must have some additional government help.
- There are a few patches of cotton and peanuts that will reach target yields on the South Plains. Most will be short owing to our old nemeses: heat and drought. Very little dryland cotton emerged, and it is burned up. This will be another bad year. Our producers really need another round of government supports. Market Facilitation Payments for 2019 salvaged the year. We need something like that for 2020. The Coronavirus Aid, Relief, and Economic Security (CARES) Act program was of little or no benefit. We need an improved CARES 2.0; otherwise, it will be more erosion of working capital and credit restructurings.
Region 3—Northern Low Plains
- Drought conditions have persisted all summer with hit-and-miss storms. Irrigated cotton should have average yields, but dryland will be well below. Insurance prices will not make up the loss of crop income. Pasture conditions are poor to fair in most of our region.
Region 4—Southern Low Plains
- We are in various stages of drought. Most dryland cotton will be failed. Some operators will have four years of losses in a row. Pastures are in rough shape due to dry weather and grasshoppers. They are culling cow herds. Tank water is going away fast. Crop damage due to deer and wild hogs is a growing problem. Nevertheless, farmers are in better shape financially due to controlling cost, less debt and Farm Service Agency payments.
Region 5—Cross Timbers
- Cattle markets are down. We experienced extremely dry conditions all summer but received substantial rainfall the first week in September.
Region 6—North Central Texas
- Poor production and historically low crop prices are holding down farmland prices and demand for farmland in this area. Until those factors improve, land prices and sales activity will remain muted.
- We are not doing any new ag loans unless they are the cream of the crop. Hopefully, a COVID-19 vaccine will be available before the second wave hits. We expect a lot of volatility in all markets until after the election. We have a new lake to open in spring/summer 2021, which should help our local economy.
Region 7—East Texas
- We continue to see an influx of people interested in moving into our rural area from larger cities, which is elevating land prices.
Region 8—Central Texas
- Continued drought conditions in some areas have many ranchers worried about going into the fall months with little stock tank water. What little corn harvest we had brought better-than-average yields for almost all producers. Oil field remains at a standstill at this time, with no drilling, no fracking, everything on hold. Army worms have already shown up in several pastures, with oat planting to start in the next few weeks.
Region 11—Trans-Pecos and Edwards Plateau
- Prices for livestock have remained, for all practical purposes, strong throughout the pandemic crisis of recent months. The ag sector in the Edwards Plateau has enjoyed a stable situation so far for this year. However, rain—that most important factor in any ag operation—has been pretty fickle in this region of the state. While some areas in south central Texas have received some beneficial rainfall, others are struggling with drought conditions. If general rains are not received soon, and if we run into a dry fall and winter, we could see lots of livestock being sold in numbers not seen since 2011.
- Pasture conditions are dry to severe dry in our area, resulting in short grass conditions. Rains have been very spotty and not been enough. Overall, livestock is in reasonable condition, though that will deteriorate without good general rainfall very soon. Cattle markets have pulled back some but remain okay. Sheep and goat markets have been volatile though overall have remained good, especially considering the increased numbers at the sales. Hair sheep numbers continue to grow, and wool sheep numbers to decline, with predators remaining a problem.
- Range conditions are drying up quickly with the hot temperatures and lack of rain. This is causing some selloff of livestock to manage herds with current grazing conditions.
Region 12—Southern New Mexico
-
The dry summer will probably result in the thinning down of many cattle herds. Appreciable moisture is needed badly for crops and cattle.
Eleventh District Agricultural Data
Figures
| Figure 1 Farm Lending Trends | ||||||
|---|---|---|---|---|---|---|
| What changes occurred in non-real-estate farm loans at your bank in the past three months compared with a year earlier? | ||||||
| Index | Percent reporting, Q3 | |||||
| 2020:Q2 | 2020:Q3 | Greater | Same | Less | ||
Demand for loans* | –20.0 | –23.3 | 7.6 | 61.5 | 30.9 | |
Availability of funds* | 12.9 | 20.2 | 24.5 | 71.2 | 4.3 | |
Rate of loan repayment | –28.2 | –9.9 | 4.0 | 82.2 | 13.9 | |
Loan renewals or extensions | 28.2 | 20.4 | 20.4 | 79.6 | 0.0 | |
| What changes occurred in the volume of farm loans made by your bank in the past three months compared with a year earlier? | |||||
| Index | Percent reporting, Q3 | ||||
| 2020:Q2 | 2020:Q3 | Greater | Same | Less | |
Non–real–estate farm loans | –24.5 | –19.4 | 7.8 | 65.1 | 27.2 |
Feeder cattle loans* | –22.3 | –27.7 | 2.3 | 67.7 | 30.0 |
Dairy loans* | –11.9 | –7.5 | 4.8 | 82.9 | 12.3 |
Crop storage loans* | –14.7 | –13.0 | 2.4 | 82.2 | 15.4 |
Operating loans | –7.1 | –8.0 | 7.0 | 78.0 | 15.0 |
Farm machinery loans* | –26.9 | –28.3 | 1.9 | 67.9 | 30.2 |
Farm real estate loans* | –24.1 | –7.4 | 12.3 | 68.0 | 19.7 |
| *Seasonally adjusted. NOTES: Survey responses are used to calculate an index for each item by subtracting the percentage of bankers reporting less from the percentage reporting greater. Positive index readings generally indicate an increase, while negative index readings generally indicate a decrease. |
|||||
| Figure 2 Real Land Values |
|---|
| Figure 3 Real Cash Rents |
|---|
| Figure 4 Anticipated Farmland Values and Credit Standards | |||||
|---|---|---|---|---|---|
| What trend in farmland values do you expect in your area in the next three months? | |||||
| Index | Percent reporting, Q3 | ||||
| 2020:Q2 | 2020:Q3 | Up | Stable | Down | |
| Anticipated trend in farmland values* | –9.3 | 5.8 | 7.8 | 90.2 | 2.0 |
| What change occurred in credit standards for agricultural loans at your bank in the past three months compared with a year earlier?† | |||||
| 2020:Q2 | 2020:Q3 | Tightened | Same | Loosened | |
| Credit standards | 20.2 | 22.3 | 22.3 | 77.7 | 0.0 |
Tables
| Table 1 Rural Real Estate Values—Third Quarter 2020 | ||||
|---|---|---|---|---|
| Banks1 | Average value2 | Percent change in value from previous year3 | ||
Cropland–Dryland | ||||
| District* | 78 | 2,114 | 5.6 |
| Texas* | 70 | 2,130 | 6.0 |
1 | Northern High Plains | 10 | 960 | 2.6 |
2 | Southern High Plains | 7 | 943 | 4.0 |
3 | Northern Low Plains* | 5 | 913 | 10.1 |
4 | Southern Low Plains* | 5 | 1,273 | 5.0 |
5 | Cross Timbers | 5 | 1,970 | 2.1 |
6 | North Central Texas | 7 | 3,707 | 3.8 |
7 | East Texas* | 8 | 2,811 | 3.1 |
8 | Central Texas | 10 | 4,090 | 10.2 |
9 | Coastal Texas | n.a. | n.a. | n.a. |
10 | South Texas | 3 | 2,183 | 2.7 |
11 | Trans–Pecos and Edwards Plateau | 8 | 2,681 | 6.4 |
12 | Southern New Mexico | 4 | 625 | 4.2 |
13 | Northern Louisiana | 4 | 3,063 | 0.7 |
Cropland–Irrigated | ||||
| District* | 65 | 2,760 | 4.2 |
| Texas* | 56 | 2,345 | 0.4 |
1 | Northern High Plains | 10 | 2,115 | 2.7 |
2 | Southern High Plains | 7 | 1,650 | –5.3 |
3 | Northern Low Plains* | 4 | 2,589 | 2.0 |
4 | Southern Low Plains | 4 | 2,400 | –5.7 |
5 | Cross Timbers | 3 | 2,467 | 10.5 |
6 | North Central Texas | 5 | 3,700 | –3.4 |
7 | East Texas | 6 | 3,275 | 3.0 |
8 | Central Texas | 6 | 3,925 | –4.0 |
9 | Coastal Texas | n.a. | n.a. | n.a. |
10 | South Texas | 3 | 3,200 | 3.3 |
11 | Trans–Pecos and Edwards Plateau | 6 | 4,208 | 4.2 |
12 | Southern New Mexico | 6 | 5,083 | 17.5 |
13 | Northern Louisiana | 3 | 4,500 | 8.1 |
Ranchland | ||||
| District* | 88 | 2,065 | 5.6 |
| Texas* | 82 | 2,457 | 5.4 |
1 | Northern High Plains | 10 | 733 | –1.9 |
2 | Southern High Plains | 5 | 845 | –7.1 |
3 | Northern Low Plains | 5 | 870 | 14.6 |
4 | Southern Low Plains* | 6 | 1,246 | 5.0 |
5 | Cross Timbers | 6 | 2,192 | 2.3 |
6 | North Central Texas | 9 | 3,578 | 3.7 |
7 | East Texas | 13 | 3,035 | 2.4 |
8 | Central Texas | 12 | 6,833 | 11.7 |
9 | Coastal Texas | n.a. | n.a. | n.a. |
10 | South Texas | 3 | 2,767 | 14.3 |
11 | Trans–Pecos and Edwards Plateau | 11 | 2,136 | 1.7 |
12 | Southern New Mexico | 4 | 380 | 12.4 |
13 | Northern Louisiana | n.a. | n.a. | n.a. |
| *Seasonally adjusted. 1 Number of banks reporting land values. 2 Prices are dollars per acre, not adjusted for inflation. 3 Not adjusted for inflation and calculated using responses only from those banks reporting in both the past and current quarter. n.a.—Not published due to insufficient responses but included in totals for Texas and district. |
||||
| Table 2 Interest Rates by Loan Type | ||||
|---|---|---|---|---|
| Feeder cattle | Other farm operating | Intermediate term | Long-term farm real estate | Fixed (average rate, percent) |
2019:Q3 | 6.90 | 6.89 | 6.71 | 6.42 |
Q4 | 6.58 | 6.61 | 6.45 | 6.11 |
2020:Q1 | 6.46 | 6.53 | 6.28 | 5.96 |
Q2 | 5.81 | 5.91 | 5.80 | 5.58 |
Q3 | 5.71 | 5.80 | 5.69 | 5.33 | Variable (average rate, percent) |
2019:Q3 | 6.58 | 6.59 | 6.50 | 6.21 |
Q4 | 6.39 | 6.29 | 6.23 | 5.88 |
2020:Q1 | 6.15 | 6.19 | 6.10 | 5.72 |
Q2 | 5.38 | 5.49 | 5.45 | 5.16 |
Q3 | 5.39 | 5.43 | 5.32 | 4.97 |
Back issues of Agricultural Survey »
For More Information
Questions regarding the Agricultural Survey can be addressed to Jesus Cañas at Jesus.Canas@dal.frb.org.