Agricultural Survey

Survey Highlights
Bankers responding to the second-quarter survey reported overall better conditions across most regions of the Eleventh District. They noted that recent rainfall has contributed to favorable crop yields, particularly for wheat, corn and cotton. Producers are optimistic about higher commodity prices but worried about increasing input costs. Cattle markets remain relatively steady, though prices are lower than in previous years. Real estate values continue to increase as some farmland and pastureland have been marketed for resale as residential development.
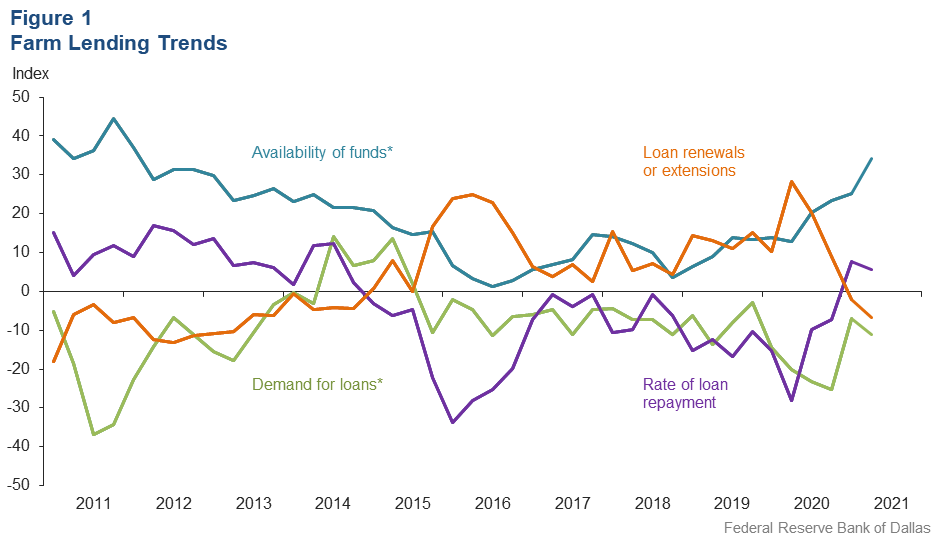
Demand for agricultural loans continued to decline, with the loan demand index registering its 23rd quarter in negative territory. Loan renewals or extensions fell for the second quarter in a row while the rate of loan repayment continued to increase. Loan volume decreased across all major categories compared with a year ago except for farm real estate, dairy and operating loans (Figure 1).
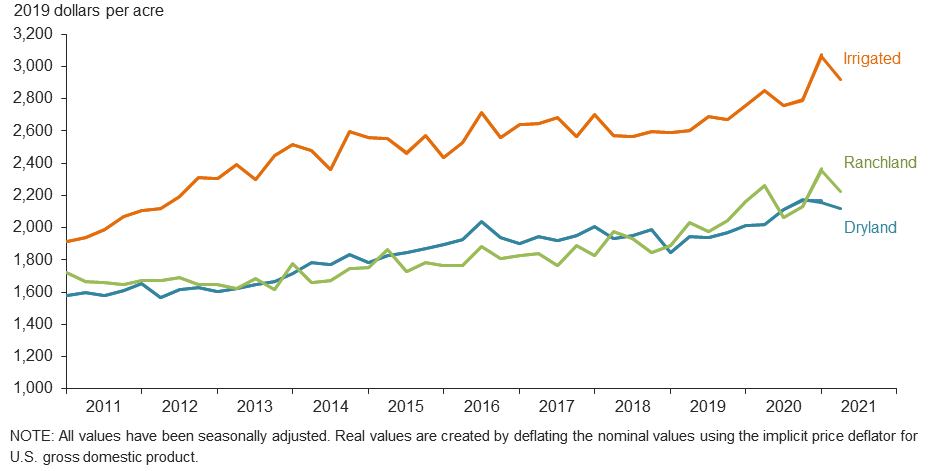
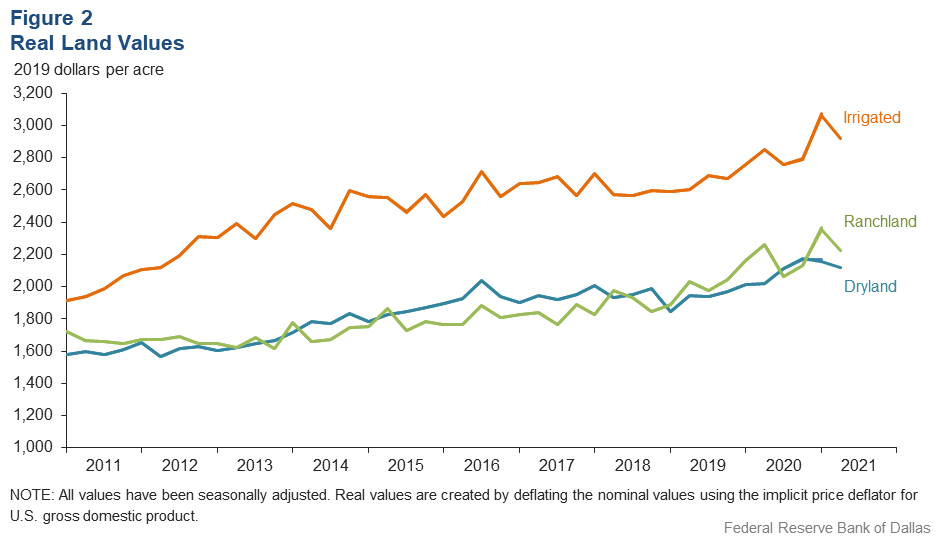
Irrigated, dryland and ranchland values fell this quarter (Figure 2). According to bankers who responded in both this quarter and second quarter 2020, nominal irrigated cropland and ranchland values increased year over year in Texas, southern New Mexico and northern Louisiana (Table 1).
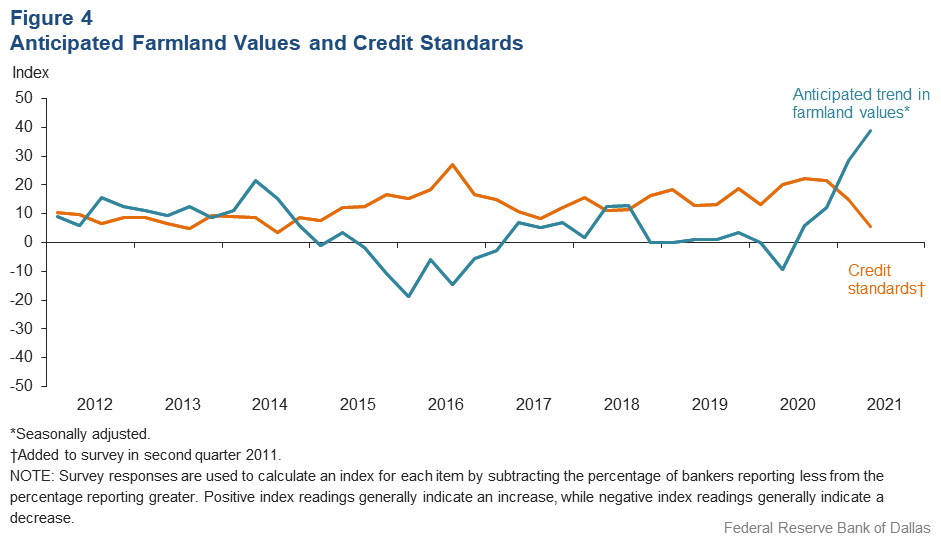
The anticipated trend in farmland values index grew in second quarter 2021 to its highest historical value, suggesting respondents expect farmland values to continue increasing. The credit standards index fell for the third consecutive quarter but remained in positive territory. The continued positive value of the index indicates further tightening of standards on net (Figure 4).
Next release: October 4, 2021
Agricultural Survey is compiled from a survey of Eleventh District agricultural bankers, and data have been seasonally adjusted as necessary. Data were collected June 8–16, and 93 bankers responded to the survey.
Quarterly Comments

District bankers were asked for additional comments concerning agricultural land values and credit conditions. These comments have been edited for publication.
Region 1—Northern High Plains
- Farmers, ranchers and bankers bounded into 2021 with renewed hope and determination. The ag market’s volatility is being closely watched; however, the strong grain prices cannot be ignored. Some favorable weather conditions in the High Plains have increased optimism for the wheat harvest as well as for the growing crops of corn and cotton. Loan demand has picked up, with area farmers and ranchers looking at equipment upgrades and farmland acquisitions. The housing market is booming, and vehicle prices are high. Consumers seem to still be taking advantage of the low-rate environment. The bank’s risk management team is in overdrive trying to read the crystal ball to forecast future rate and economic conditions.
- Recent moisture is improving the outlook for grain sorghum and corn crops. Improved commodity prices are also giving producers the opportunity to lock in prices above breakeven.
- Late May rains have been a blessing to our communities. Grain prices are extremely high, so we hope farmers will get crops to harvest and be able to enjoy the high prices. Our cattle customers are still struggling with the market inequities created by the massive profit margins of the packer. Our industry needs help to break the control the packer has over cattlemen.
- It’s still very dry in the western Texas Panhandle. Cow herds are almost completely liquidated due to lack of pasture. Our grass pasture cattle loans will be minimal compared to average years.
Region 2—Southern High Plains
- Recent rains have improved our chances for a better crop year. It will really help if we can get rains again by mid-July. Cotton futures are positive for December, but cattle prices have fluctuated a lot recently and grass is short.
- Net farm income will be highly dependent on weather. With the timely planting rains, a good crop year looks hopeful but very fragile. Timely summer rains will make or break this crop and the futures market. Corn planting appears below average, and rumors of milo maize as a first crop are becoming widespread as cotton-planting deadlines have come and gone. Cattle markets continue to show year-over-year improvement, although the full effects of plant closures and labor shortages are yet to be realized. Government assistance will be appreciated through the cover crop program, a formalized carbon market and price/yield support. The overall sentiment is optimistic.
- Drought early in the year prevented planting, and now excessive rain has slowed planting. Most producers are still very positive, with the high prices of cotton and milo maize. Most producers have locked in forward contracts on half of their irrigated crops. Prices of farm real estate have increased with the pandemic plus encroachment of urban development in rural areas. Currently there are less than 300 available dwellings on the market in Lubbock, resulting in the construction of new homes in rural areas surrounding the city. It appears there is an increase in homebuyers from outside the area and state.
- Prospects are a little brighter due to rains on the South Plains, but this could cause problems planting a cotton crop timely. But at this time, commodity prices seem to be holding and an alternative crop could be planted.
- There have been very few land sales during the last months.
Region 3—Northern Low Plains
- Inflation has increased input cost dramatically. The political environment continues to drive uncertainty in markets. Delays in receiving timely delivery of parts and supplies are widespread, creating additional uncertainty on the production side of agriculture. Major equipment manufacturers cannot deliver equipment or parts on a timely basis. On the bright side, timely rains have been received over much of the Rolling Plains, bringing some relief to the extensive drought we have been in.
- Commodity prices are looking to be more favorable for the 2021 crop, but the increase in input costs is not going to improve the profit margin. The crops in this area are off to a decent start with moisture being adequate in most places. Pasture conditions have improved dramatically, but the rains have been spotty and not all areas have received adequate moisture to replenish the full profile. We still need more rain to replenish the underground moisture supply.
- With good rains, pastures are recovering, and tanks are filling back up. The wheat harvest is progressing well with good yields and prices.
Region 4—Southern Low Plains
- Recent heavy rains after a nine-month drought have improved conditions. Cotton planting is going full blast. However, most wheat was put into hay. Earth tanks are full, and spring grass growth was excellent after a long dry winter. Most of this year’s calf crop will go for winter feed cost. Cotton acres will be down some due to transition to other crops. Ag financial conditions have improved over the last two years.
Region 5—Cross Timbers
- Ag conditions have been more favorable toward producers in the first half of 2021 primarily because of heavy rainfall in our market. Real estate values continue to increase as traditional farmland and pastureland have been acquired, divided and marketed for resale as residential development. Counties in our market are working to manage the development with real estate usage rules that allow sustainable development and market conditions long-term. Real estate value is no longer tied to agricultural production value as metro areas expand into our market. Water rights and tax-exemption status and rules are under heavy discussion currently. Loan demand is stable but not increasing. Real estate loan terms have been tightened as result of the market bubble described.
- Over 20 inches of rain was received in May. Hay cutting and planting are behind schedule.
Region 6—North Central Texas
- Corn prices are good for this crop year, and there should be good yields.
Region 8—Central Texas
- Rain, rain, beautiful rain—we have seen over 20 inches in the past three weeks. Grass and row crops are growing at accelerated rates; hopefully, ranchers can get into the fields soon to cut hay. Oil and gas activity is still in the area as prices move upward on the market. Cattle is starting to get into better condition, and prices seem to be holding up at the local sale barns.
Region 11—Trans-Pecos and Edwards Plateau
- Until the recent rains just received, pasture conditions were critically dry and short. Things have greened up a good bit, but we will need some follow-up rains soon to get any substantial growth and certainly to continue through the summer. Livestock condition overall is moderate, showing the impact of the ongoing drought. Government programs have helped the overall income of livestock producers and well supplemented the decreases in sales dollars due to fewer pounds. Younger sheep and goat markets remain very good, with even cull prices being reasonable. Cattle markets remain relatively steady, though at lower values than the past few years. Losses due to predators remain a problem.
Region 12—Southern New Mexico
- Although producers are optimistic about higher commodity prices, their optimism is tempered by the reality that all their input costs are also appreciably higher. Rainfall continues to be the most highly sought-after commodity. Some producers have received significant amounts of rain, while many remain extremely dry and may have to liquidate more cattle during the summer.
Region 13—Northern Louisiana
- Recent rainfall has allowed the corn to thrive with little-to-no irrigation cost. Corn yields are expected to be very good and, if not impacted by a hurricane, there should be a solid early harvest. Early-planted soybeans are strong and healthy, while later-planted soybeans are suffering from too much rainfall. There are still a lot of unplanted acres in the area, again due to excessive rainfall. The cotton acreage is down this year with fewer acres planted.
Historical Data
Historical data can be downloaded dating back to first quarter 2000.
Figures
Farm Lending Trends
What changes occurred in non-real-estate farm loans at your bank in the past three months compared with a year earlier?
| Index | Percent reporting, Q2 | ||||
| 2021:Q1 | 2021:Q2 | Greater | Same | Less | |
Demand for loans* | –7.1 | –11.2 | 7.3 | 74.2 | 18.5 |
Availability of funds* | 25.3 | 34.3 | 35.1 | 64.1 | 0.8 |
Rate of loan repayment | 7.6 | 5.7 | 9.1 | 87.5 | 3.4 |
Loan renewals or extensions | –2.2 | –6.7 | 5.6 | 82.2 | 12.2 |

What changes occurred in the volume of farm loans made by your bank in the past three months compared with a year earlier?
| Index | Percent reporting, Q2 | ||||
| 2021:Q1 | 2021:Q2 | Greater | Same | Less | |
Non–real–estate farm loans | 1.1 | –1.1 | 15.2 | 68.5 | 16.3 |
Feeder cattle loans* | –16.7 | –12.8 | 8.1 | 71.0 | 20.9 |
Dairy loans* | –12.9 | 3.7 | 8.2 | 87.3 | 4.5 |
Crop storage loans* | –18.7 | –9.0 | 1.5 | 88.0 | 10.5 |
Operating loans | 0.0 | 6.8 | 15.9 | 75.0 | 9.1 |
Farm machinery loans* | –13.3 | –9.7 | 8.2 | 73.9 | 17.9 |
Farm real estate loans* | 7.0 | 9.1 | 20.8 | 67.5 | 11.7 |
| *Seasonally adjusted. NOTES: Survey responses are used to calculate an index for each item by subtracting the percentage of bankers reporting less from the percentage reporting greater. Positive index readings generally indicate an increase, while negative index readings generally indicate a decrease. |
|||||
Real Land Values
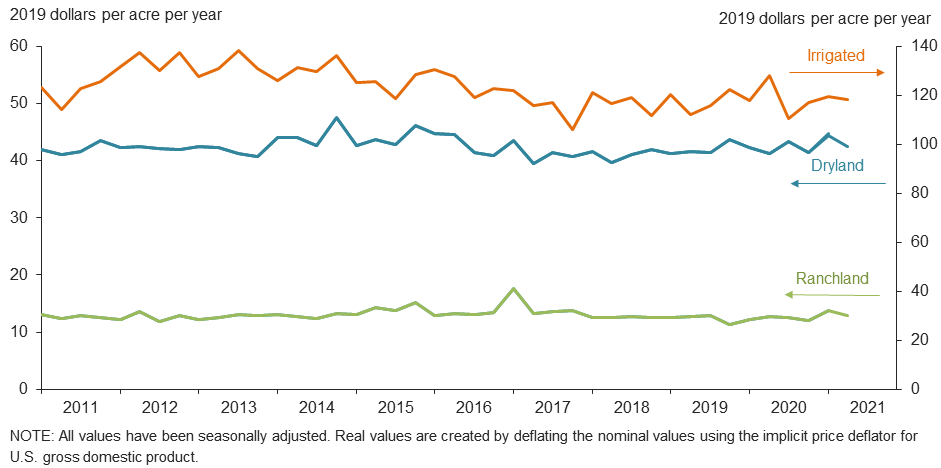
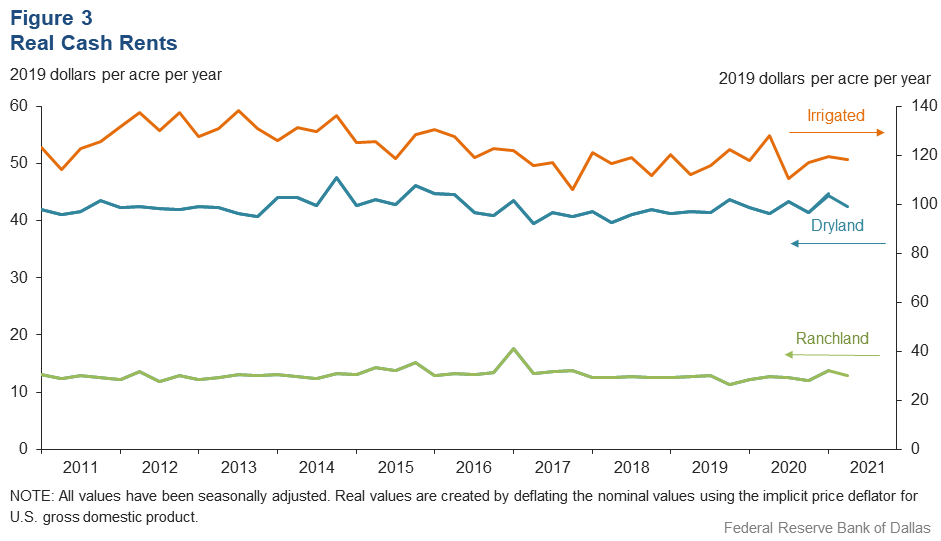
Real Cash Rents
Anticipated Farmland Values and Credit Standards
What trend in farmland values do you expect in your area in the next three months?
| Index | Percent reporting, Q2 | ||||
| 2021:Q1 | 2021:Q2 | Up | Same | Down | |
| Anticipated trend in farmland values* | 28.6 | 39.0 | 40.0 | 59.0 | 1.0 |
What change occurred in credit standards for agricultural loans at your bank in the past three months compared with a year earlier?†
| 2021:Q1 | 2021:Q2 | Up | Same | Down | |
| Credit standards | 14.9 | 5.5 | 6.6 | 92.3 | 1.1 |

Tables
Rural Real Estate Values—Second Quarter 2021
| Banks1 | Average value2 | Percent change in value from previous year3 | ||
Cropland–Dryland | ||||
| District* | 73 | 2,167 | 11.0 |
| Texas* | 66 | 2,175 | 11.6 |
1 | Northern High Plains | 11 | 966 | 5.1 |
2 | Southern High Plains | 11 | 968 | 8.2 |
3 | Northern Low Plains* | 6 | 973 | 12.5 |
4 | Southern Low Plains* | 4 | 1,225 | 0.0 |
5 | Cross Timbers | 4 | 1,825 | 3.5 |
6 | North Central Texas | 6 | 3,800 | 21.5 |
7 | East Texas* | 5 | 3,276 | 12.3 |
8 | Central Texas | 9 | 4,667 | 13.1 |
9 | Coastal Texas | 3 | 2,100 | 10.5 |
10 | South Texas | 3 | 2,433 | 11.5 |
11 | Trans–Pecos and Edwards Plateau | 4 | 2,225 | 1.9 |
12 | Southern New Mexico | 4 | 613 | 5.5 |
13 | Northern Louisiana | 3 | 3,400 | 1.8 |
Cropland–Irrigated | ||||
| District* | 58 | 2,987 | 8.7 |
| Texas* | 51 | 2,379 | 4.4 |
1 | Northern High Plains | 11 | 2,109 | –0.9 |
2 | Southern High Plains | 11 | 1,959 | 12.1 |
3 | Northern Low Plains* | 5 | 2,263 | 3.7 |
4 | Southern Low Plains | n.a. | n.a. | n.a. |
5 | Cross Timbers | n.a. | n.a. | n.a. |
6 | North Central Texas | 4 | 4,375 | 20.8 |
7 | East Texas | 3 | 3,333 | 16.1 |
8 | Central Texas | 5 | 4,250 | 6.2 |
9 | Coastal Texas | n.a. | n.a. | n.a. |
10 | South Texas | 3 | 3,467 | 8.3 |
11 | Trans–Pecos and Edwards Plateau | 3 | 3,333 | –3.6 |
12 | Southern New Mexico | 4 | 7,375 | 25.5 |
13 | Northern Louisiana | 3 | 4,467 | 6.8 |
Ranchland | ||||
| District* | 75 | 2,280 | 13.5 |
| Texas* | 67 | 2,718 | 13.6 |
1 | Northern High Plains | 11 | 759 | –1.3 |
2 | Southern High Plains | 7 | 889 | 4.7 |
3 | Northern Low Plains | 6 | 975 | 5.3 |
4 | Southern Low Plains* | 4 | 1,487 | 0.0 |
5 | Cross Timbers | 5 | 2,195 | 14.3 |
6 | North Central Texas | 6 | 4,367 | 19.5 |
7 | East Texas | 7 | 3,293 | 8.7 |
8 | Central Texas | 9 | 7,611 | 12.0 |
9 | Coastal Texas | n.a. | n.a. | n.a. |
10 | South Texas | 3 | 3,167 | 17.3 |
11 | Trans–Pecos and Edwards Plateau | 7 | 2,243 | 16.3 |
12 | Southern New Mexico | 5 | 380 | 11.8 |
13 | Northern Louisiana | 3 | 2,500 | 4.7 |
| *Seasonally adjusted. 1 Number of banks reporting land values. 2 Prices are dollars per acre, not adjusted for inflation. 3 Not adjusted for inflation and calculated using responses only from those banks reporting in both the past and current quarter. n.a.—Not published due to insufficient responses but included in totals for Texas and district. |
||||
Interest Rates by Loan Type—Second Quarter 2021
| Feeder cattle | Other farm operating | Intermediate term | Long-term farm real estate | Fixed (average rate, percent) |
2020:Q2 | 5.81 | 5.91 | 5.80 | 5.58 |
2020:Q3 | 5.71 | 5.80 | 5.69 | 5.33 |
2020:Q4 | 5.67 | 5.78 | 5.60 | 5.17 |
2021:Q1 | 5.77 | 5.76 | 5.55 | 5.13 |
2021:Q2 | 5.65 | 5.67 | 5.53 | 5.20 | Variable (average rate, percent) |
2020:Q2 | 5.38 | 5.49 | 5.45 | 5.16 |
2020:Q3 | 5.39 | 5.43 | 5.32 | 4.97 |
2020:Q4 | 5.36 | 5.41 | 5.35 | 4.91 |
2021:Q1 | 5.32 | 5.33 | 5.22 | 4.95 |
2021:Q2 | 5.33 | 5.31 | 5.24 | 5.00 |
For More Information
Questions regarding the Agricultural Survey can be addressed to Jesus Cañas at Jesus.Canas@dal.frb.org.