Banking Conditions Survey

Growth in Loan Demand Decelerates Further
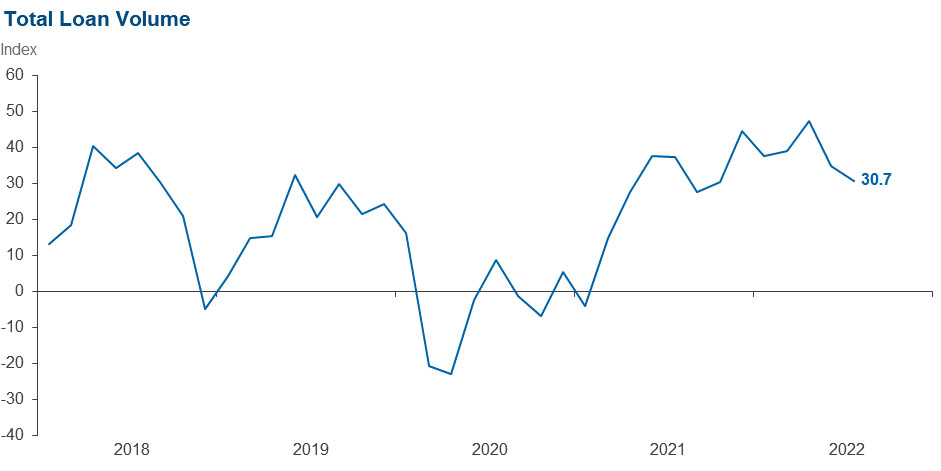
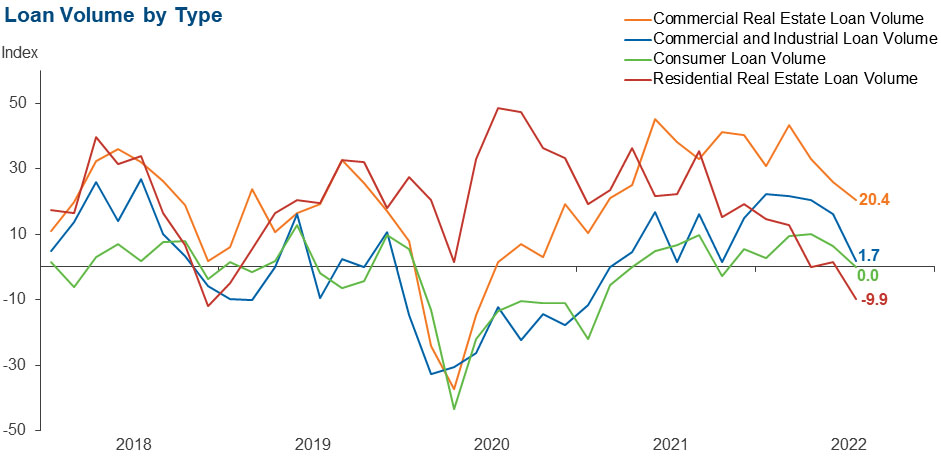
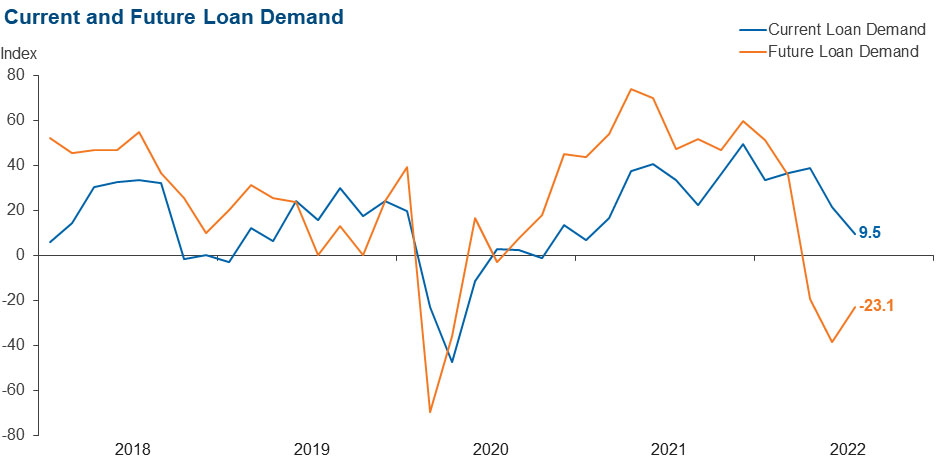
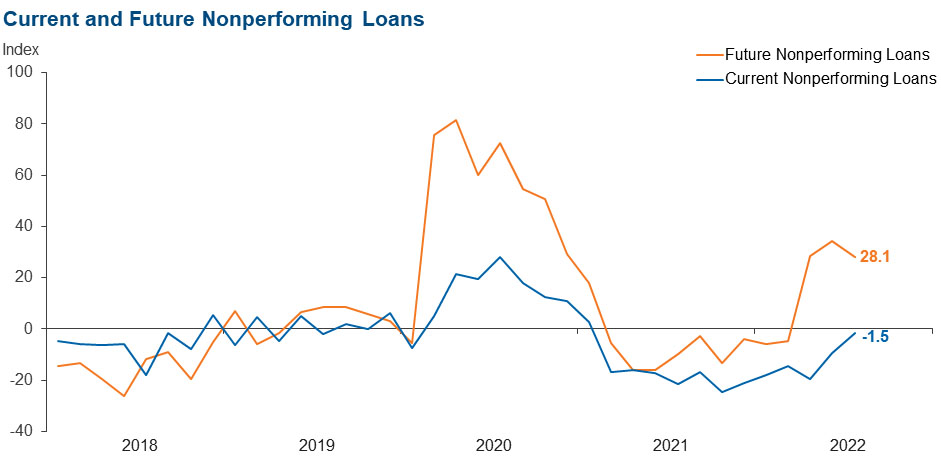
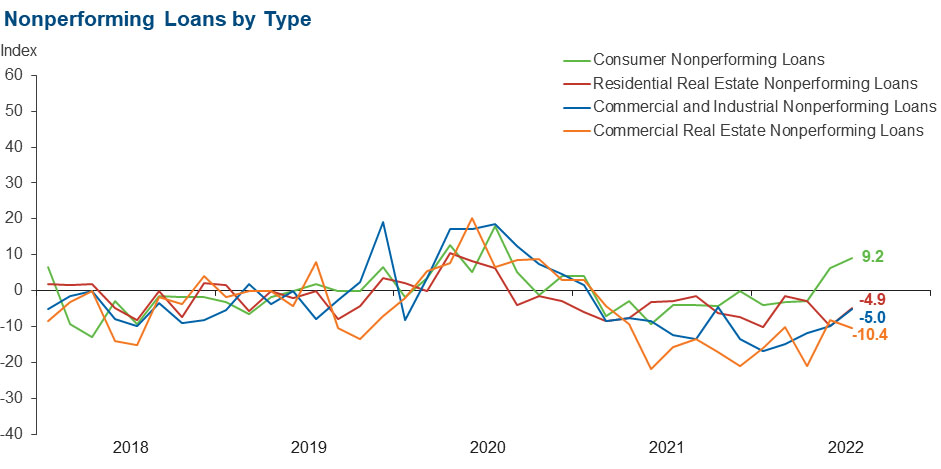
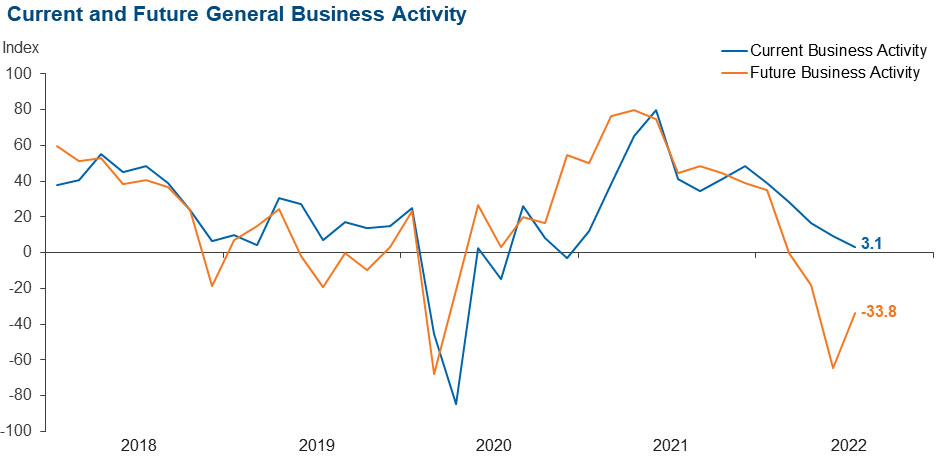
Loan demand continued to increase but at a markedly slower pace than what has been seen over the last 18 months. Total loan volume growth also decelerated, with mixed movements by lending type. Residential real estate loan volumes decreased over the past six weeks after flattening out earlier this year following strong growth amid the initial pandemic recovery period. Consumer loan and commercial and industrial loan volumes largely held steady, while commercial real estate loan volumes continued to increase. Loan nonperformance increased for consumer loans but continued to decrease for other loan types, leading to little change in nonperforming loans overall. Looking six months ahead, contacts continue to expect that loan demand and general business activity will decrease, and loan delinquency will increase, though outlooks were somewhat less pessimistic than six weeks ago.
Next release: October 3, 2022
Data were collected August 9–17, and 65 financial institutions responded to the survey. The Federal Reserve Bank of Dallas conducts the Banking Conditions Survey twice each quarter to obtain a timely assessment of activity at banks and credit unions headquartered in the Eleventh Federal Reserve District. CEOs or senior loan officers of financial institutions report on how conditions have changed for indicators such as loan volume, nonperforming loans and loan pricing. Respondents are also asked to report on their banking outlook and their evaluation of general business activity.
Survey responses are used to calculate an index for each indicator. Each index is calculated by subtracting the percentage of respondents reporting a decrease (or tightening) from the percentage reporting an increase (or easing). When the share of respondents reporting an increase exceeds the share reporting a decrease, the index will be greater than zero, suggesting the indicator has increased over the prior reporting period. If the share of respondents reporting a decrease exceeds the share reporting an increase, the index will be below zero, suggesting the indicator has decreased over the prior reporting period. An index will be zero when the number of respondents reporting an increase is equal to the number reporting a decrease.
Results Summary
Historical data are available from March 2017.
| Total Loans: Over the past six weeks, how have the following changed? | |||||
| Indicator | Current Index | Previous Index | % Reporting Increase | % Reporting No Change | % Reporting Decrease |
Loan volume | 30.7 | 34.8 | 49.2 | 32.3 | 18.5 |
Loan demand | 9.5 | 21.6 | 33.3 | 42.9 | 23.8 |
Nonperforming loans | –1.5 | –9.2 | 14.1 | 70.3 | 15.6 |
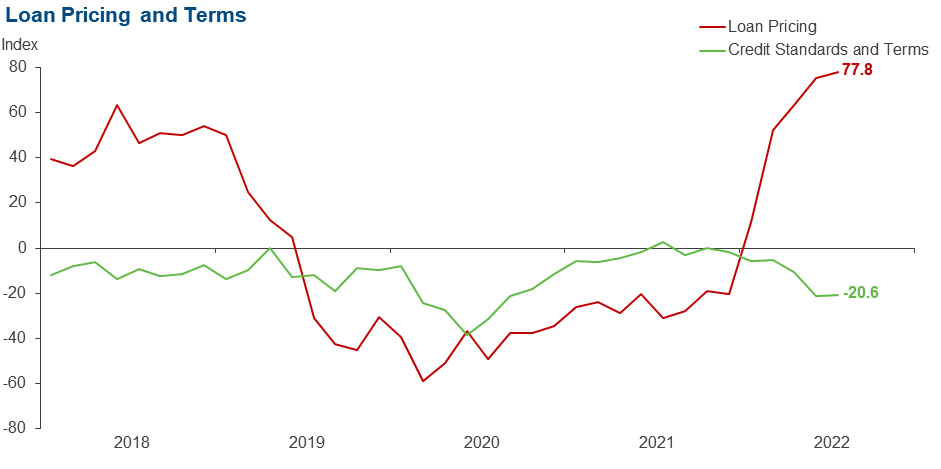
Loan pricing | 77.8 | 75.4 | 77.8 | 22.2 | 0.0 |
| Indicator | Current Index | Previous Index | % Reporting Eased | % Reporting No Change | % Reporting Tightened |
Credit standards and terms | –20.6 | –21.4 | 0.0 | 79.4 | 20.6 |
| Commercial and Industrial Loans: Over the past six weeks, how have the following changed? | |||||
| Indicator | Current Index | Previous Index | % Reporting Increase | % Reporting No Change | % Reporting Decrease |
Loan volume | 1.7 | 16.1 | 21.7 | 58.3 | 20.0 |
Nonperforming loans | –5.0 | –9.9 | 5.0 | 85.0 | 10.0 |
| Indicator | Current Index | Previous Index | % Reporting Eased | % Reporting No Change | % Reporting Tightened |
Credit standards and terms | –15.0 | –14.8 | 1.7 | 81.7 | 16.7 |
| Commercial Real Estate Loans: Over the past six weeks, how have the following changed? | |||||
| Indicator | Current Index | Previous Index | % Reporting Increase | % Reporting No Change | % Reporting Decrease |
Loan volume | 20.4 | 25.8 | 42.4 | 35.6 | 22.0 |
Nonperforming loans | –10.4 | –8.1 | 1.7 | 86.2 | 12.1 |
| Indicator | Current Index | Previous Index | % Reporting Eased | % Reporting No Change | % Reporting Tightened |
Credit standards and terms | –20.7 | –16.2 | 1.7 | 75.9 | 22.4 |
| Residential Real Estate Loans: Over the past six weeks, how have the following changed? | |||||
| Indicator | Current Index | Previous Index | % Reporting Increase | % Reporting No Change | % Reporting Decrease |
Loan volume | –9.9 | 1.5 | 26.2 | 37.7 | 36.1 |
Nonperforming loans | –4.9 | –9.8 | 4.9 | 85.2 | 9.8 |
| Indicator | Current Index | Previous Index | % Reporting Eased | % Reporting No Change | % Reporting Tightened |
Credit standards and terms | –11.5 | –11.3 | 0.0 | 88.5 | 11.5 |
| Consumer Loans: Over the past six weeks, how have the following changed? | |||||
| Indicator | Current Index | Previous Index | % Reporting Increase | % Reporting No Change | % Reporting Decrease |
Loan volume | 0.0 | 6.3 | 20.0 | 60.0 | 20.0 |
Nonperforming loans | 9.2 | 6.3 | 13.8 | 81.5 | 4.6 |
| Indicator | Current Index | Previous Index | % Reporting Eased | % Reporting No Change | % Reporting Tightened |
Credit standards and terms | –6.2 | –9.7 | 1.5 | 90.8 | 7.7 |
| Banking Outlook: What is your expectation for the following items six months from now? | |||||
| Indicator | Current Index | Previous Index | % Reporting Increase | % Reporting No Change | % Reporting Decrease |
Total loan demand | –23.1 | –38.5 | 27.7 | 21.5 | 50.8 |
Nonperforming loans | 28.1 | 34.3 | 35.9 | 56.3 | 7.8 |
| General Business Activity: What is your evaluation of the level of activity? | |||||
| Indicator | Current Index | Previous Index | % Reporting Better | % Reporting No Change | % Reporting Worse |
Over the past six weeks | 3.1 | 9.1 | 27.7 | 47.7 | 24.6 |
Six months from now | –33.8 | –64.6 | 15.4 | 35.4 | 49.2 |
Comments from Survey Respondents
Respondents were given an opportunity to comment on any issues that may be affecting their business.
These comments are from respondents’ completed surveys and have been edited for publication.
- We are concerned about the FOMC [Federal Open Market Committee] increasing rates too much and too fast. It takes time for the impact to work through the economy, and the news reports (which may not be correct) that the Fed is using historic metrics (unemployment and inflation) to gauge the need for greater rate pressure that will impact a 12–to–18–month future. We are concerned about an overcorrection that unnecessarily would be damaging to liquidity, the economy and the banking industry by 2024.
- We see a continued increase in regulatory issues resulting in increasing noninterest expense. As a community banker, we can only absorb so much.
- There is continued uncertainty with regard to the external economic environment combined with beginning to see the stresses of inflation in credit risk metrics. We anticipate a high level of difficulty in forecasting as we begin the second half of 2022 and 2023 forecast/budget projections.
- Persistent high levels of inflation and unsustainable wage growth are adversely impacting core banking operations.
- Inflation, gas prices, bad decisions at the federal level, an open border, China/Russia—lots of scary stuff out there.
- The rising rates have started to impact the residential market. Purchase contracts are now coming in at below listing price as opposed to multiple offers above asking price.
Historical Data
Historical data can be downloaded dating back to March 2017. For the definitions, see data definitions.
NOTE: The following series were discontinued in May 2020: volume of core deposits, cost of funds, non-interest income and net interest margin.
Questions regarding the Banking Conditions Survey can be addressed to Emily Kerr at emily.kerr@dal.frb.org.
Sign up for our email alert to be automatically notified as soon as the latest Banking Conditions Survey is released on the web.