
Consumer Credit Trends for Travis County

May 2020
| May 2020 Update |
|---|
|
The following report was written prior to the onset of the coronavirus (COVID-19) crisis. Large numbers of consumers across the country are now experiencing job losses, pay cuts and related challenges that have the potential to strain their credit and financial health. The analysis in this report uses data from 2003 through 2018 and touches on three important concepts that may be illuminating for the current situation:
As the pandemic unfolds in present day, this information can serve as a baseline for pre-COVID-19 credit performance and may be useful in helping predict which ZIP codes and populations are most vulnerable to financial distress. As federal and local governments, as well as private lenders, debate terms of policies such as mortgage forbearance and student loan deferment, the impact of their decisions will eventually become clear in the data. Will the improvement we have seen in the mortgage market after the Great Recession continue through this pandemic? Will deferring student loan payments flatten out the rise in delinquency rates long term or simply delay an even larger spike? Will the signs of trouble in the car loan market worsen, or economic stimulus packages improve these trends? The answers to these questions remain to be seen but will be explored in depth in the coming months and years. Stay tuned on the Consumer Credit Trends page for updates. |
Introduction
This report provides a look at important debt trends and loan performance in Travis County and is the next in a series on Consumer Credit Trends. It uses a 5 percent nationally representative sample of consumer-level and loan-level data from Equifax—one of the country’s three main credit bureaus. This report uses Equifax data to analyze four major types of consumer loans: auto, credit card, mortgage and student. It uses Equifax Risk Scores, a specific type of credit score, which uses data points such as previous payment history, current amount of debt held and credit history length, to measure credit health. This report is part of our consumer credit series, which aims to provide a comprehensive view of credit access, loan volumes and delinquencies across the state. For more on methodology and background, see Consumer Credit Trends for Texas.
High Share of Prime Borrowers
Among those who have a credit history, Travis County has a significantly higher share of prime borrowers relative to other parts of Texas (Table 1). In fact, less than 20 percent of Travis borrowers have Equifax Risk Scores below 619 (generally considered the riskiest borrowers), compared with nearly 30 percent of borrowers across Texas. The share of those with the least-risky credit is nearly 10 percentage points higher in the county than the state.
Travis County Has High Share of Prime Borrowers
| Share of borrowers (percent) | |||
| Category | Equifax Risk Score range | Travis County | Texas |
| Prime | 680 and above | 66.3 | 55.6 |
| Near prime | 620–679 | 13.8 | 16.0 |
| Subprime | 550–619 | 10.8 | 15.1 |
| Deep subprime | Below 550 | 9.1 | 13.4 |
| SOURCES: Federal Reserve Bank of New York Consumer Credit Panel/Equifax; authors’ calculations. | |||
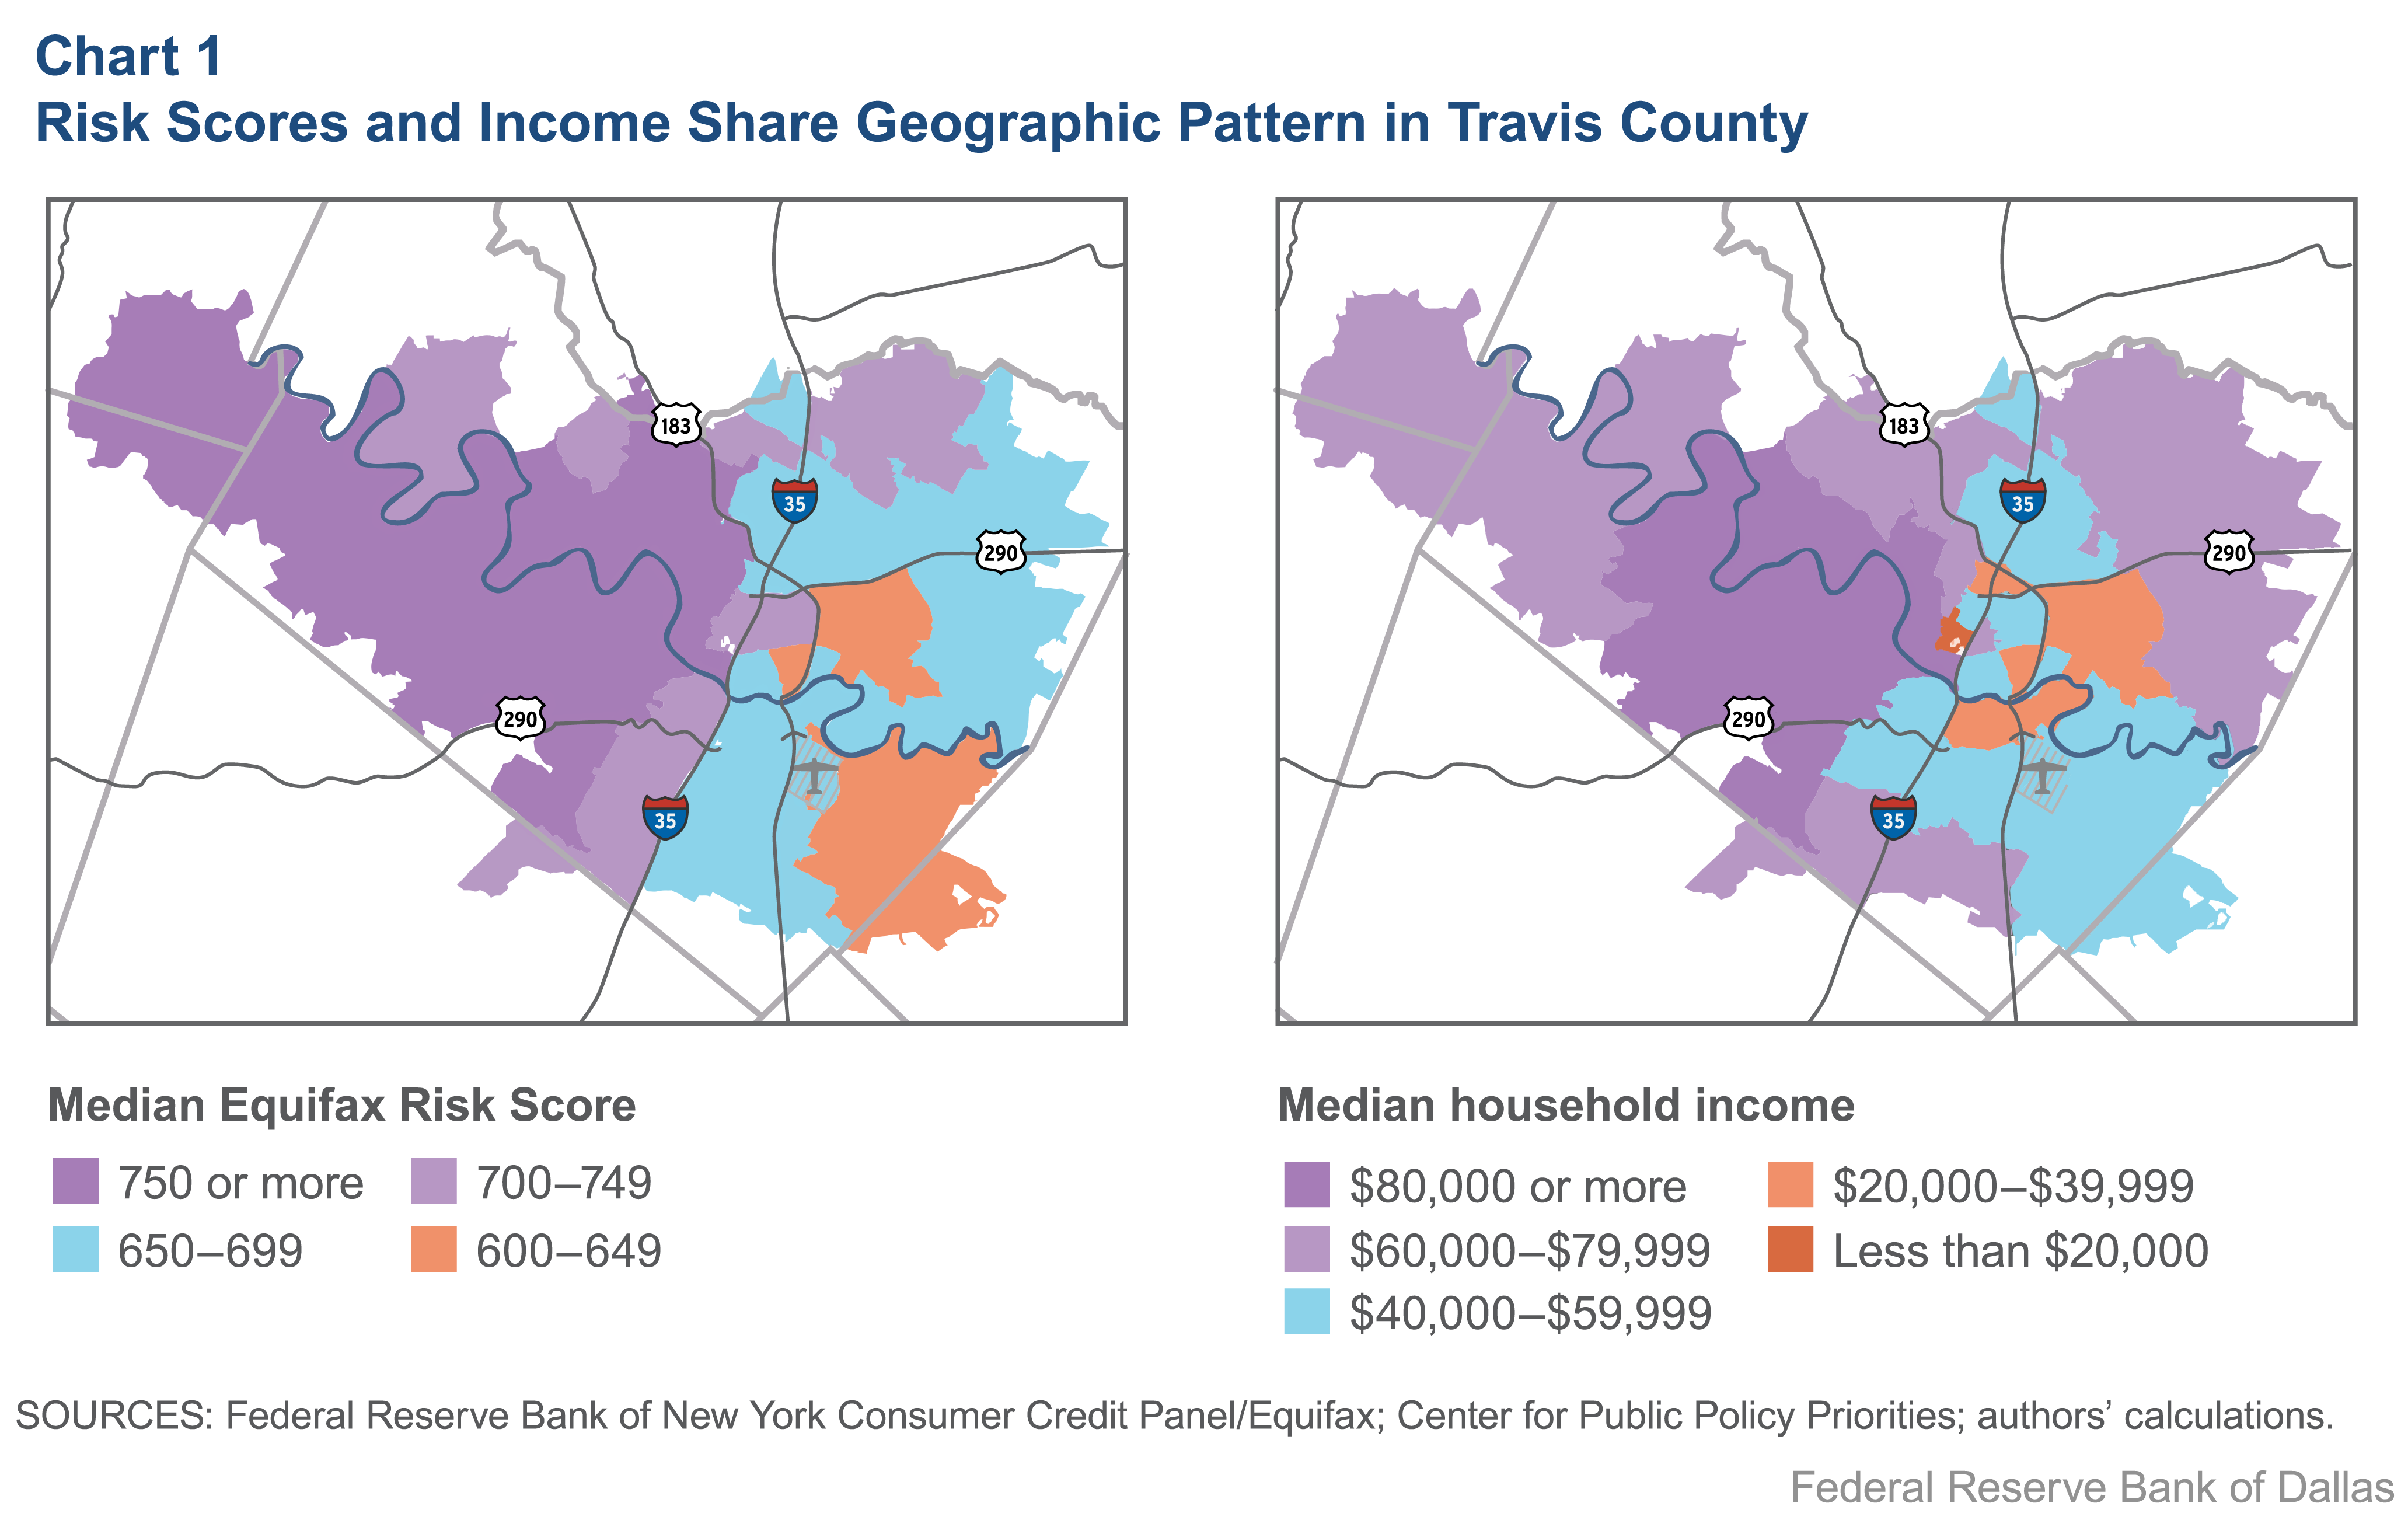
In context of demographics, this contrast makes sense. Travis County has noticeably higher median incomes than the statewide average. At $68,350 for households in Travis, this is $11,000 higher than the median household income for the state. There is moderate positive correlation between Equifax Risk Scores and incomes.[1] In fact, as Chart 1 indicates, there appears to be a correlation between ZIP codes with high incomes and ZIP codes with high Equifax Risk Scores.
Finally, Travis County has a higher share of white, non-Hispanic residents than the state (49 percent versus 43 percent across Texas), a group that tends to have higher median credit scores. There are many complex reasons for racial disparity in credit scores. Black and Hispanic Americans have lower incomes and educational attainment on average than their white peers. Although not used in a credit score algorithm, these factors are correlated with credit scores.[2] It’s also likely that a history of racial discrimination in the credit market has not allowed access to loans and intergenerational wealth building for communities of color in the same way it has for white families.[3] In addition, communities of color are more likely to exist in banking deserts and also are often disproportionally targeted for higher-cost alternative financial lenders such as payday or title lenders, which can deplete wealth and lower credit scores.[4]
High Balances, Low Delinquencies—for Some
Balances
Median auto balances are lower than statewide by about $3,000 (Table 2). However, mortgages in Travis County are much higher than in Texas, with the median mortgage balance being 42 percent higher than in the state. Furthermore, Travis County has seen the highest growth rate in the median balance of any of the counties of interest or statewide—a 22 percent growth in balances from 2006 to 2018.
Average Mortgages Nearly $250,000 in Travis County in 2018
| Loan amount (dollars) Median |
|||
| Auto | 15,447 | ||
| Credit card | 2,741 | ||
| Mortgage | 191,097 | ||
| Student | 19,343 | ||
| SOURCES: Federal Reserve Bank of New York Consumer Credit Panel/Equifax; author’s calculations. | |||
Interestingly, this growth has been much higher for prime borrowers than for subprime or deep subprime borrowers. While median mortgage balances for prime borrowers have climbed 22 percent, adjusting for inflation, these balances have actually fallen for those with subprime or deep subprime credit, by about 7 percent and 6 percent, respectively. This likely reflects the fact that prime borrowers, often with higher incomes, tend to live in areas whose high demand causes home prices to rise more rapidly.
Serious Delinquencies
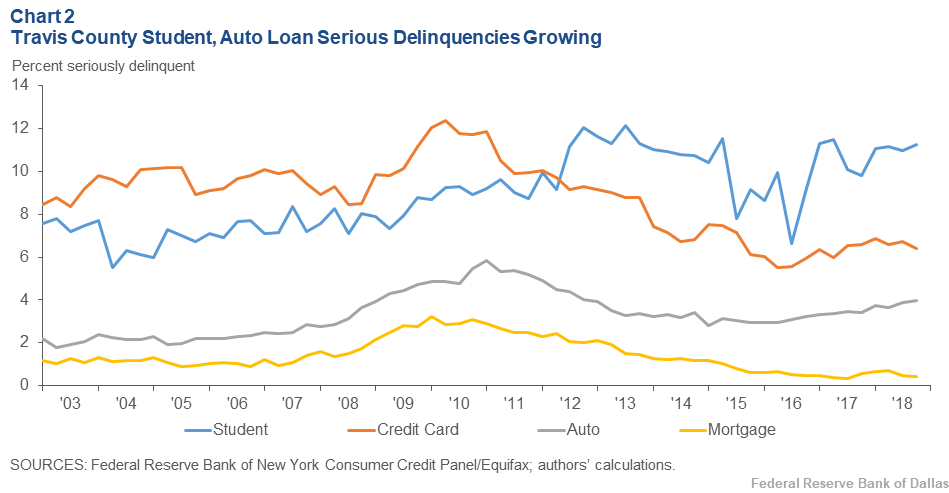
The share of serious delinquencies, defined as loans that are 90 or more days past due, represents another important indicator of credit health. Chart 2 shows that after years of decline, car loan serious delinquencies are experiencing a small uptick since 2016. Student loan delinquencies, despite erratic patterns in recent years, have been modestly rising since 2003. In 2003, 7.6 percent of the student loan volume was at least 90 days overdue, while at the end of 2018, this rose to 11.3 percent. Still, though, even this level is lower than the other four counties (Bexar, Dallas, El Paso and Harris). In fact, this is true for all loan types. Across the board, Travis shows lower serious delinquency rates than other counties and the state. This is consistent with Travis boasting a higher share of prime borrowers.
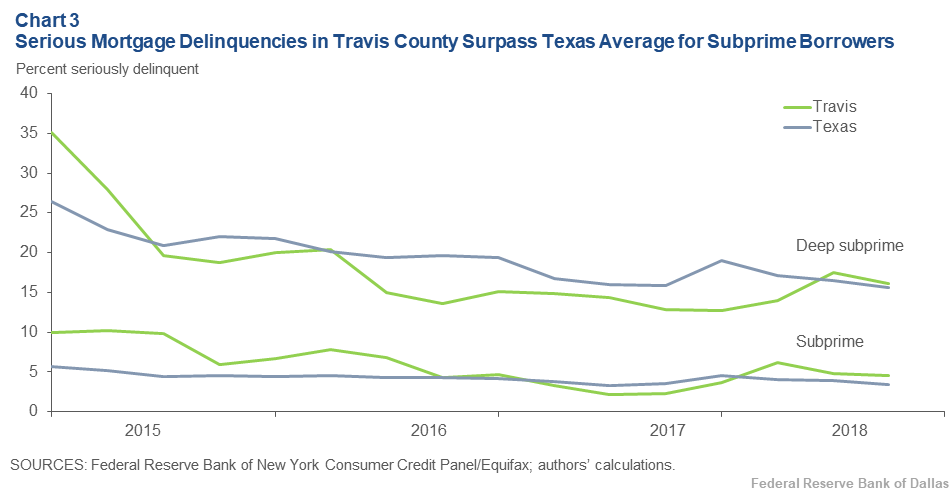
In the mortgage market, serious delinquencies across Texas are low. For Travis County, though, the rate is even lower: as of fourth quarter 2018, less than half of 1 percent of mortgage balances were 90 or more days past due. However, this appears to be a result of the strong performance and large share of prime mortgages. While they may be relatively low in number, mortgages held by subprime and deep subprime borrowers in Travis, over the past year, have performed slightly worse than in Texas overall (Chart 3). The aggregate performance of mortgages in Travis masks the struggles that the comparatively smaller share of subprime borrowers face. Interestingly, a similar phenomenon appears to be true in the student debt market as well, with subprime borrowers in Travis County struggling more with repayment than subprime borrowers in Texas as a whole. This does not appear to be the case for credit card or car loans.
Lastly, the share of prime borrowers in the Travis mortgage market has climbed from 74 percent in 2006 to 87 percent by 2018. This is a 13-percentage-point increase, which is higher than the overall growth of prime borrowers among all borrowers, which is 11 percentage points.
Credit Inclusion Lower in Travis County
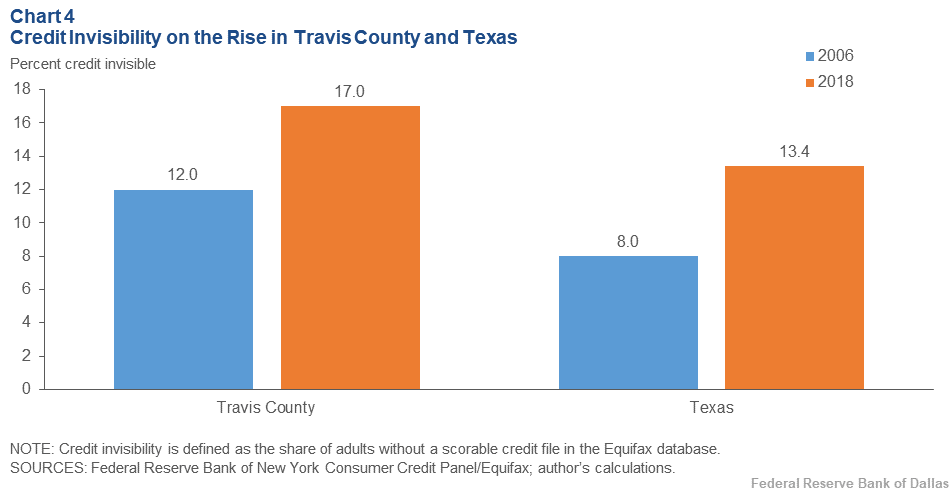
Credit invisibility—which we define as the lack of a scorable credit history with any of the three major credit bureaus—is a signal of possible exclusion from important aspects of the main street economy. Lacking a credit profile may mean an inability to obtain loans (including credit cards) and can also impact employment and housing.[5] In Travis County, an estimated 17 percent of adults are credit-invisible. This is markedly higher than the statewide average of 13.4 percent.[6]
Factors most closely associated with higher likelihood of invisibility include being black or Hispanic, as well as being under the age of 25.[7] Could demographic differences be the cause of the higher rate of unscorable credit in Travis County? Initial analysis suggests not. Travis actually has a higher share of the white, non-Hispanic population than Texas as a whole (49 percent versus 43 percent, respectively). While Travis County does have a higher share of 25–34 year olds making up its population (20 percent versus the statewide share of 14.6 percent), its share of those ages 18–24 is not significantly higher.[8]
There may be two factors at play here: First, although the most drastic drop-off in invisibility rates occurs after age 24, people ages 25–29 are also somewhat more likely to have absent or unscorable credit than older-age cohorts (20.7 percent of 25–29-year-olds versus 16.5 percent of 30–34-year-olds and 17.1 percent of 35–39 year olds). Second, deeper analysis suggests that credit invisibility is more of a problem in Travis County outside of Austin city limits. In fact, credit invisibility rates within the city of Austin are closer to the state average.[9]
The proportion of Travis County residents who are credit-invisible has risen since 2006 (Chart 4). Before the Great Recession, in 2006, 88 percent of adults in Travis County were in the credit economy, which means just 12 percent were invisible, compared with 17 percent in 2018.
More on Consumer Credit Trends from the Dallas Fed
Check the Dallas Fed’s Community Development website for deep dives into particular consumer credit trends.
Lead Author
- Emily Ryder Perlmeter
Community Development Advisor, Federal Reserve Bank of Dallas
Contributing Authors
- Anna Crockett
Community Development Analyst, Federal Reserve Bank of Dallas - Garrett Groves
Vice President of Business & Industry Partnerships, Austin Community College
The information and views expressed in this report are the authors’ and do not necessarily reflect official positions of the Federal Reserve Bank of Dallas or Federal Reserve System; nor do they constitute an endorsement of any organization or program.
Full report is available online: https://www.dallasfed.org/cd/cct/20ccttr.
Federal Reserve Bank of Dallas 2200 N. Pearl St., Dallas, Texas 75201 | 214.922.6000 or 800.333.4460