Energy Indicators

March 14, 2022
Geopolitical events
The Russian invasion of Ukraine in late February has roiled the energy industry and sent global energy prices soaring. The U.S. issued a ban on the small but nontrivial volumes of Russian crude and petroleum products it imports, most of which are used to boost distillate production in U.S. refineries. The days of supply held in inventory of crude and distillates are below their five-year averages. Subsequent to these events, nominal retail fuel prices in the U.S. have recently risen at the fastest pace since Hurricane Katrina.
Global energy prices
The invasion triggered severe global economic sanctions in response. In the week ending March 4, 2022, natural gas in Europe soared to $62 per million British thermal units (MMBtu), and the Asian LNG benchmark jumped to $39 per MMBtu (Chart 1). In contrast U.S. domestic natural gas rose to $5.
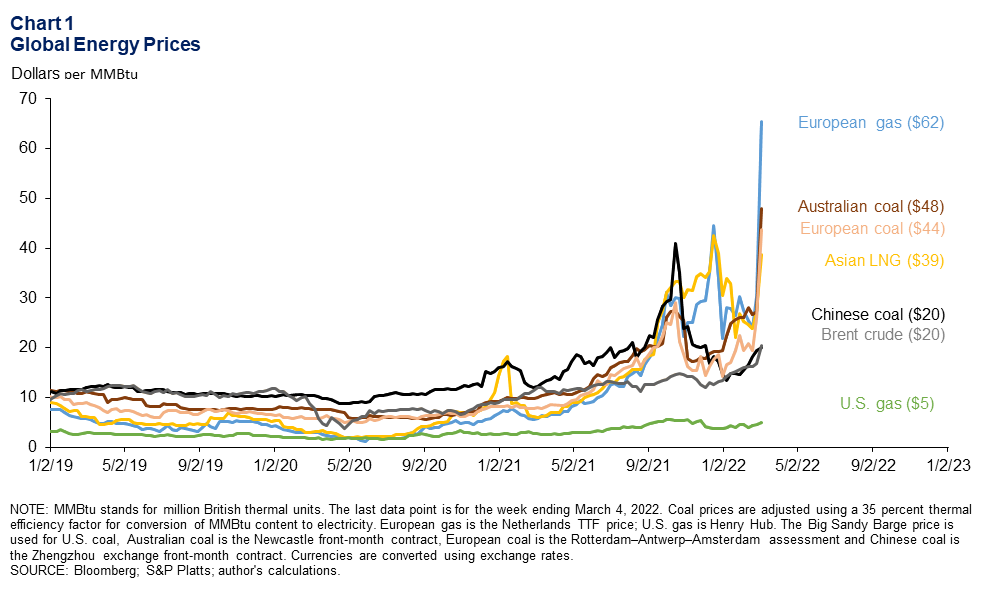
The surge in natural gas prices and the risk of a disruption of Russian exports quickly spilled over into coal markets. European and Australian coal futures spiked to $44 and $48 per MMBtu. Chinese Zhengzhou coal saw more modest gains to $20.
To put these prices in perspective, European natural gas at $62 per MMBtu would be the energy equivalent of paying nearly $360 for a barrel of oil. Brent crude closed March 4 at $118 per barrel, or $20 per MMBtu.
While the U.S., European Union and others have imposed sanctions on the Russian economy and banking systems, they had not directly targeted Russia’s oil and gas exports as of March 14. However, the U.S. and others in recent days issued bans on imports of Russian energy. In addition, there is a growing chorus of buyers and shippers refusing to do business with Russia. The risk that future sanctions might ensnare their businesses and uncertainty about how firms would be paid may—at least partially—lock Russian energy products out of export markets. However, the extent and durability of such a development remains highly uncertain.
U.S. imports of Russian petroleum
Russian crude a small share of U.S. imports
Imports of crude oil to the U.S. in 2021 were over 6 million barrels per day (mb/d), rising as high as 6.4 mb/d in the fourth quarter of the year, nearly on par with prepandemic levels. Of those imports, 3.8 mb/d (62 percent) were from Canada , 0.8 mb/d (13 percent) from OPEC (nearly half of that from Saudi Arabia) and 0.6 mb/d (10 percent) from Mexico (Chart 2).
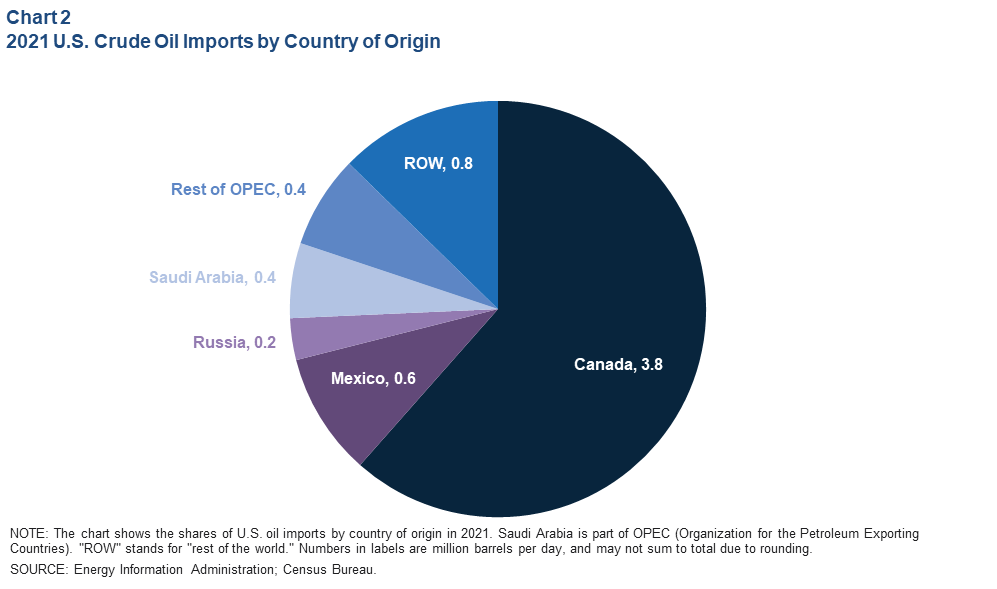
Russian crudes represented 0.2 mb/d (3 percent) of U.S. crude imports in 2021. Many crudes in North America are similar to Russia’s Urals brand, but it is not clear how quickly their production could rise to replace Russia’s oil near term—if at all. U.S. Mars (produced in the Gulf of Mexico), West Texas Sour and certain blends of Canadian crude are viable substitutes, but ramping up their production enough to offset a substantial drop in the availability of Russian crude will take many months.
Outside of North America, Arab Medium is a close substitute for Urals, but Saudi Arabia has signaled no production increases beyond the quotas placed on them by the current OPEC+ agreement. Iran’s heavy and Venezuela’s Mesa 30 crudes are also substitutes with some capacity to return, but diplomatic efforts, years of underinvestment and operational lags put a substantial increase in those supplies months away, at best.
Russian product imports more significant than crude
In 2021, the U.S. imported 354 thousand barrels per day (kb/d) of “unfinished oils” from Russia (Chart 3). Refiners tend to blend this with lighter crudes to boost their diesel output. Smaller volumes of gasoline-blending components, higher-sulfur distillates and residual fuel oils were also imported.
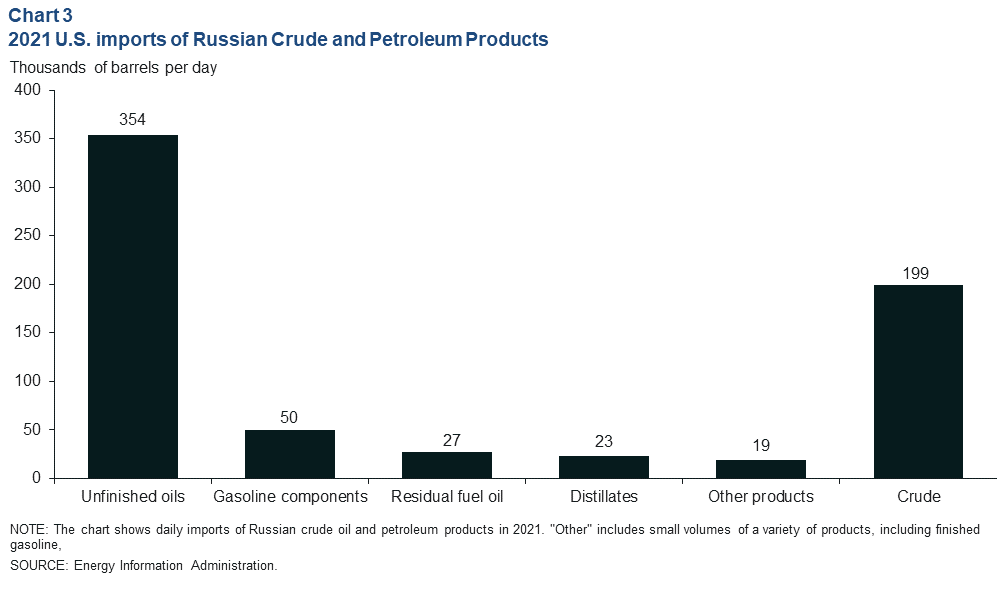
Together, the 473 kb/d of petroleum products imported from Russia in 2021 represented 20 percent of U.S. product imports. Russia was the second-largest source of U.S. petroleum product imports last year behind Canada at 583 kb/d. Even so, the combined 672 kb/d of Russian crude and product imports accounted for less than 4 percent of the volume of net inputs to U.S. refiners and blenders.
U.S. days of supply
Inventories of crude oil in the U.S. were down to 27.1 days of supply in February—two days below the five-year average (Chart 4). This excludes the strategic petroleum reserves, which the U.S. will tap in hopes of alleviating some price pressures. Distillate inventories were also tight. Consisting of mostly of diesel fuel, distillate days of supply were 27.5—7.3 days below the five-year average. Days of supply is calculated by dividing inventory levels by the estimated pace of consumption.
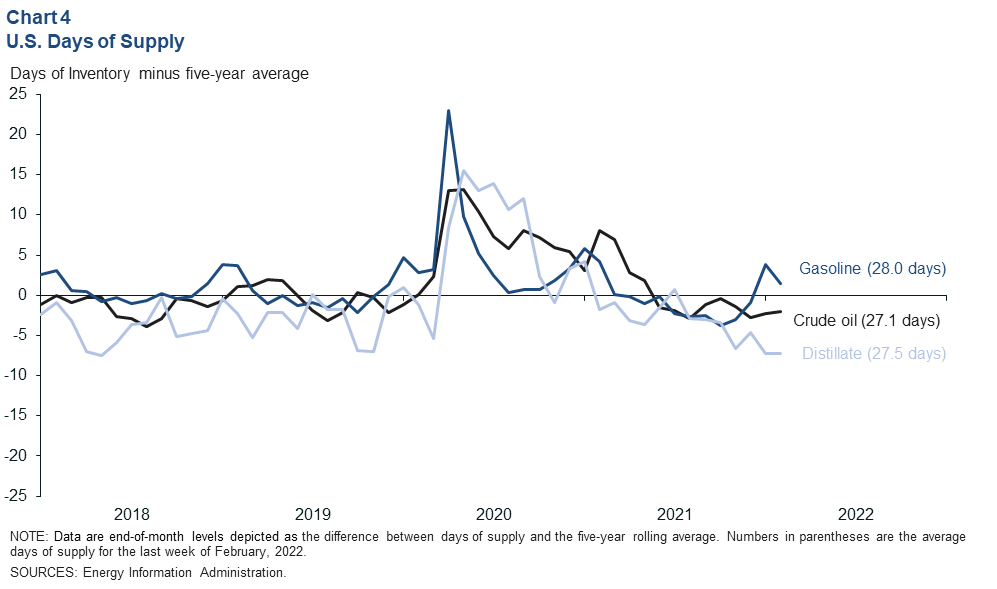
Gasoline inventories were 1.5 days above the five-year average at 28. The higher gasoline stocks are partly due to normal winter seasonal increases.
U.S. retail fuel prices
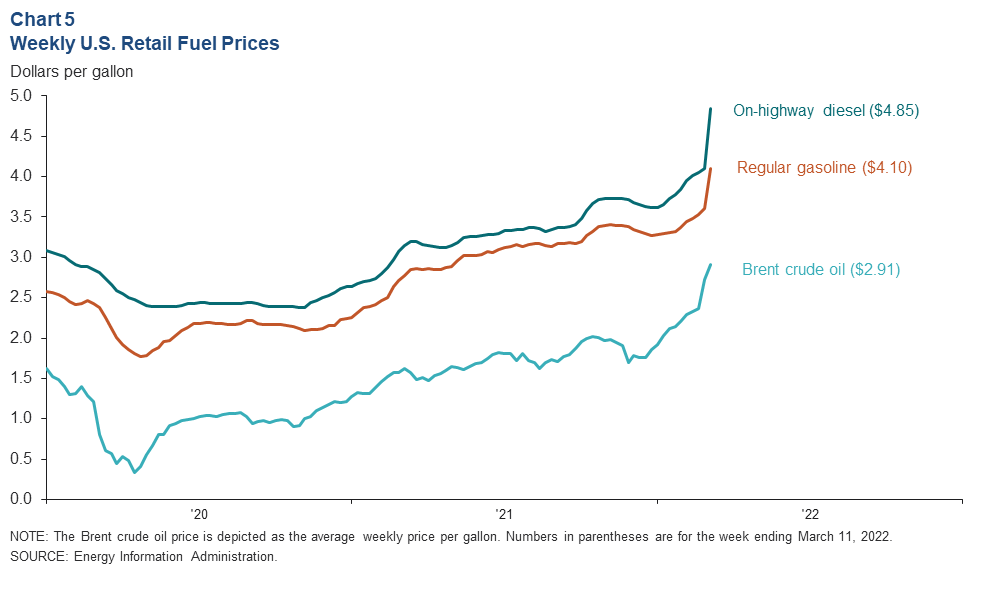
Retail fuel prices in the U.S. rose at the fastest pace since Hurricane Katrina. On-highway diesel rose to $4.85 per gallon the week of March 11, up 19.6 percent from two weeks prior (Chart 5). Similarly, the price of regular gasoline was $4.10, a two-week increase of 13.7 percent. By comparison, futures prices of international benchmark Brent crude spiked 23.1 percent. The imminent switch to more costly summer fuel blends will add more upward price pressure by April.
Domestic energy sector
Downward revisions to oil and gas payroll data back to March 2020 reveal that the pandemic oil bust has been much deeper than national data initially showed. However, with high oil prices and an emphasis on investor returns, energy companies have substantially outperformed the S&P 500 over the past year. Drilling activity has been rising steadily for more than a year, but industry spending (real business fixed investment) remains substantially below prepandemic levels.
U.S. oil and gas jobs
U.S. mining sector payroll data were revised in February 2022 back to the start of the pandemic. This brought trends in the national data for states other than Texas closer in line with the Dallas Fed’s early benchmarked jobs data for mining in Texas. The revisions left mining payrolls outside of Texas 43,039 jobs lower at year-end 2021 than initially estimated. Mining payrolls outside of Texas totaled 141,474 in January 2022 (Chart 6).
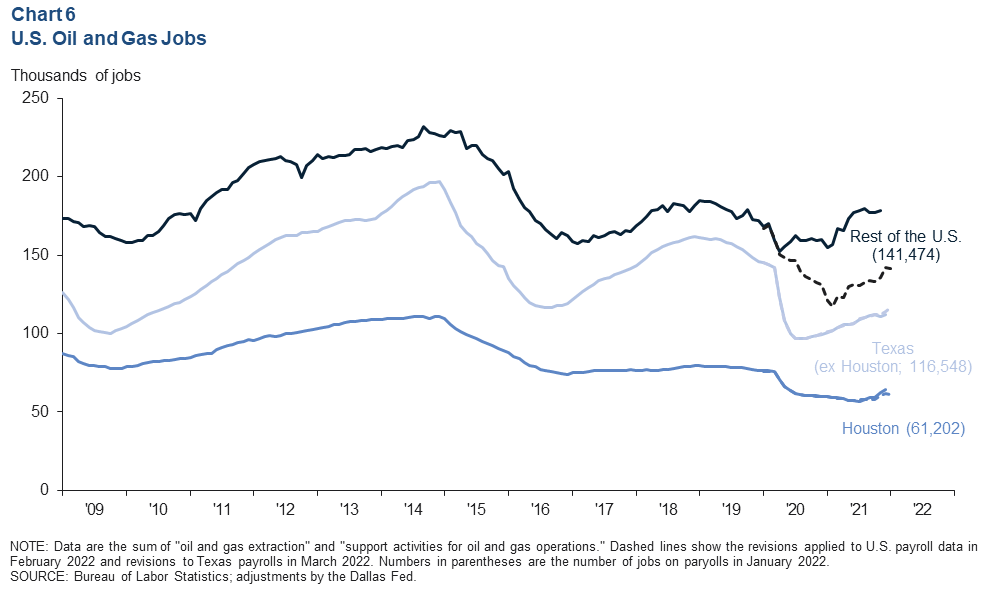
Revisions to Texas data were more modest, thanks to early benchmarking. Houston finally saw oil and gas jobs grow in late 2021, reaching 61,202 jobs in January 2022. Sector employment in the rest of Texas rose steadily throughout the past year to 116,548. These numbers do not include the rise in manufacturing jobs tied to energy.
Energy stocks
Energy stocks have done well, with high energy prices, low expenditures, stock buybacks and larger dividends. Exploration and production companies were up 84 percent on March 2 compared with a year ago (Chart 7). Integrated oil companies were up 54 percent. Equipment and services firms were up 32 percent, and refining and marketing was up 16 percent.
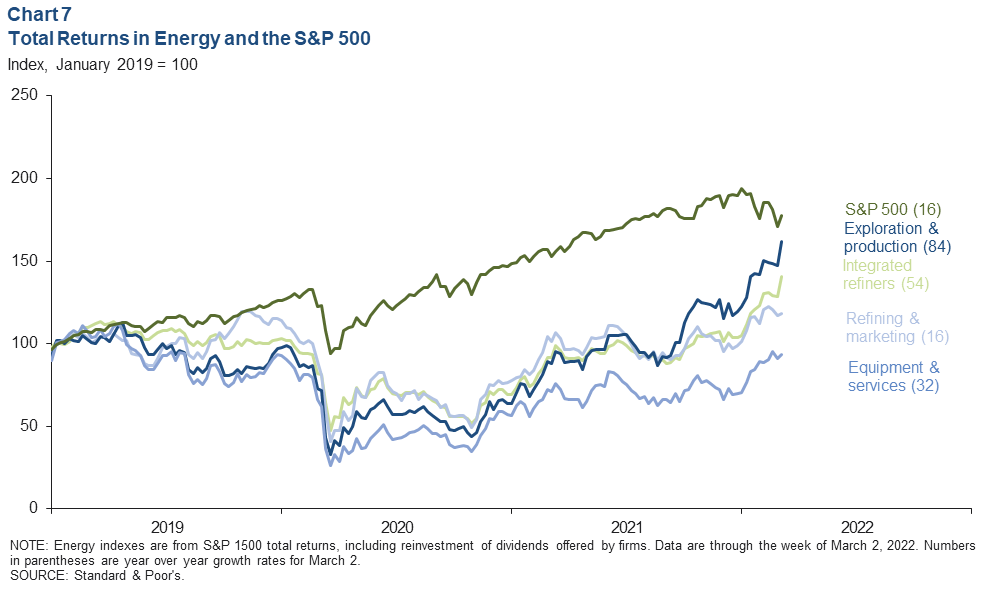
By comparison, the S&P 500 was up 16 percent after falling through most of first quarter 2021. Rising political tensions and the eventual invasion of Ukraine drove a Brent spike to $120. While the tensions boosted energy stocks, the geopolitical environment contributed to worsening expectations for the global economy in 2022.
U.S. rig count
Drilling activity across the U.S. has risen fairly steadily over the past year, adjusting for normal seasonal variation. The Permian Basin rig count rose to 316 for the week ending March 11, 2022 (Chart 8). Other oil shales—including the Eagle Ford and Bakken formations—saw active drilling rise to 135 rigs.
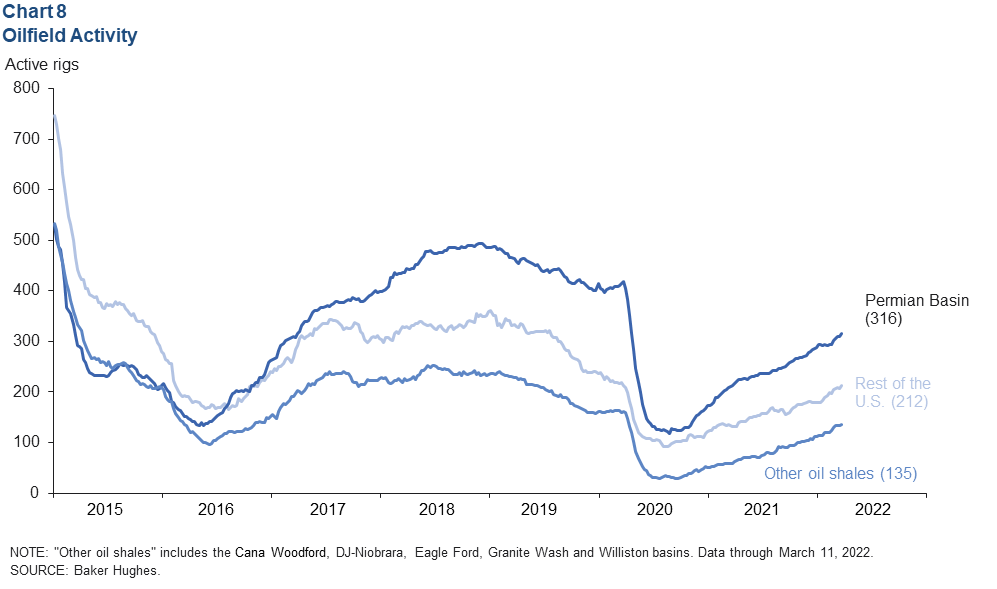
Drilling in the rest of the U.S. rose to 212 active rigs. Included in that total is the Haynesville Shale, which has easy access to liquefied natural gas export terminals on the Gulf Coast and has seen a sharp increase in drilling this year. U.S. offshore rigs are also included, but that rig count has been flat, oscillating around 14 since the start of the pandemic.
Many projections in early 2022 called for the number of active rigs to rise to between 700 to 800 by year-end. That would be a modest response to January and February prices by historical standards. The ongoing emphasis on investor and lender returns, as well as labor and supply-chain challenges, will limit the ability of U.S. producers to substantially accelerate output growth in the remainder of 2022.
Industry investment
Real spending on oil and gas machinery and wells (business fixed investment) contributed 0.15 percentage points to the 5.2 percent growth in U.S. GDP between the second half of 2020 and second half of 2021 (Chart 9). Even with these increases in spending, real fixed investment by the sector in the second half of 2021 was still down 24 percent compared with the same period in 2019.
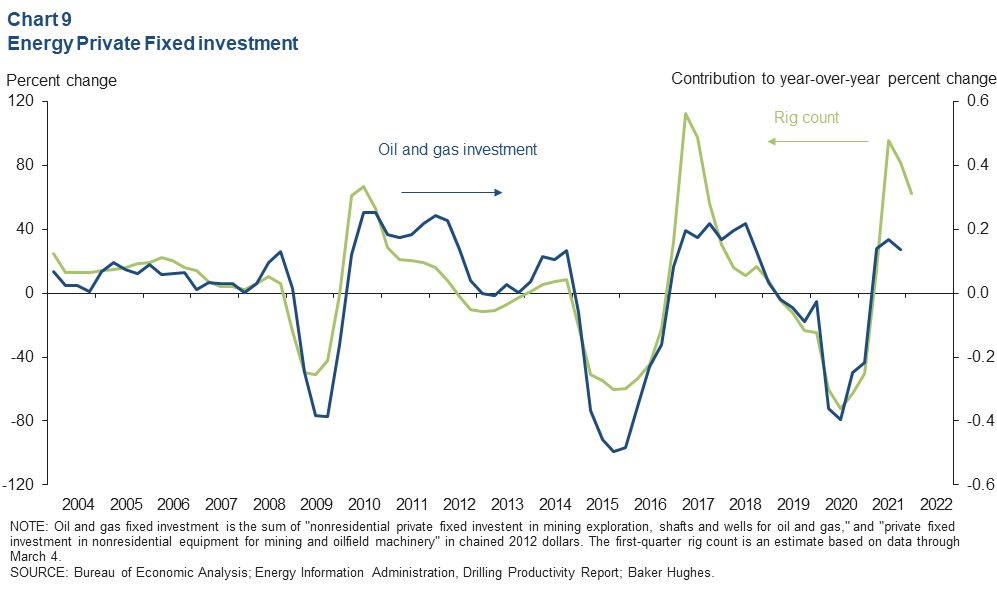
As oilfield activity rises over the remainder of 2022, the oil and gas industry’s contribution to real GDP (investment and production) will continue to grow. In the aggregate, this will help to offset at least part of the negative impacts that high prices are having on consumers.
Return to Geopolitical Events section | Return to Domestic Energy Sector section
About Energy Indicators
Questions can be addressed to Jesse Thompson at jesse.thompson@dal.frb.org. Energy Indicators is released monthly and can be received by signing up for an email alert. For additional energy-related research, please visit the Dallas Fed’s energy home page.