Energy Indicators

| Energy dashboard (February 2024) | |||
| WTI price avg. Feb. 26–March 1 |
WTI price change from 4 weeks prior |
Henry Hub price avg. Feb. 26–March 1 |
Henry Hub price change from 4 weeks prior |
| $76/barrel | 4.4% | $1.84/MMBtu | -14.8% |
Coal power usage continues to decline in Texas. Solar power will be roughly half of all new electric-generation additions in both Texas and the U.S. in 2024, according to the Energy Information Administration (EIA). Weatherization over the last couple of years has significantly improved grid stability in Texas. Global electric vehicle (EV) sales grew in 2023, with China accounting for over half of those sales. In the U.S., the West Coast dominated EV purchases last year. Finally, global CO2 emissions rose in 2023, largely driven by coal use in China and India.
Electrical demand
Coal power down; wind power up
The Electric Reliability Council of Texas’ (ERCOT) net power generation rose from 429 terawatt hours (TWh) in 2022 to 444 TWh in 2023 (Chart 1). Among lower-carbon power sources, generation from nuclear plants has been hovering around 40 TWh since 2007, while wind and solar output rose by 99 TWh during the same time frame. Utility-scale solar generation swelled to 32 TWh in 2023 from zero in 2015.
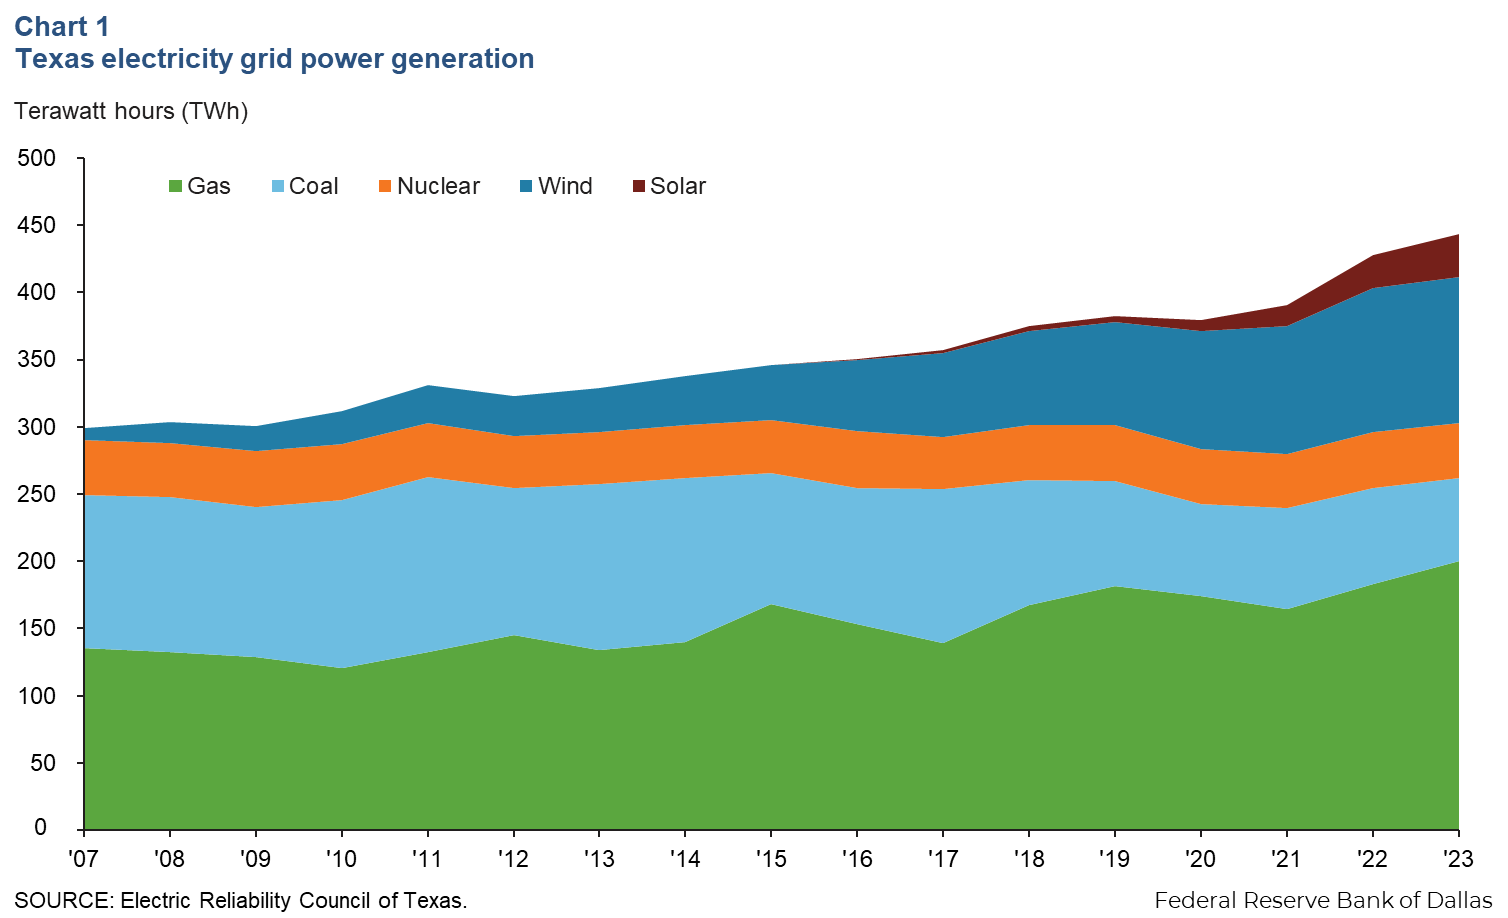
Natural gas made up 47 percent of the 290 TWh of thermal generation (coal, natural gas and nuclear) in 2007; coal was 39 percent. In 2023, natural gas provided 66 percent of the 303 TWh of thermal power, and coal was 20 percent.
Solar power capacity growth to outpace other sources
About half of new U.S. planned grid additions will come from solar power in 2024, according to the EIA (Chart 2). A total of 55.8 gigawatts (GW) of name-plate generation capacity will be added in 2024, including 26.4 GW of solar (47 percent), 13.4 GW of wind (24 percent) and 8.2 GW of battery storage (15 percent). Solar will see more than half of its new capacity in three states: Texas, California and Florida.
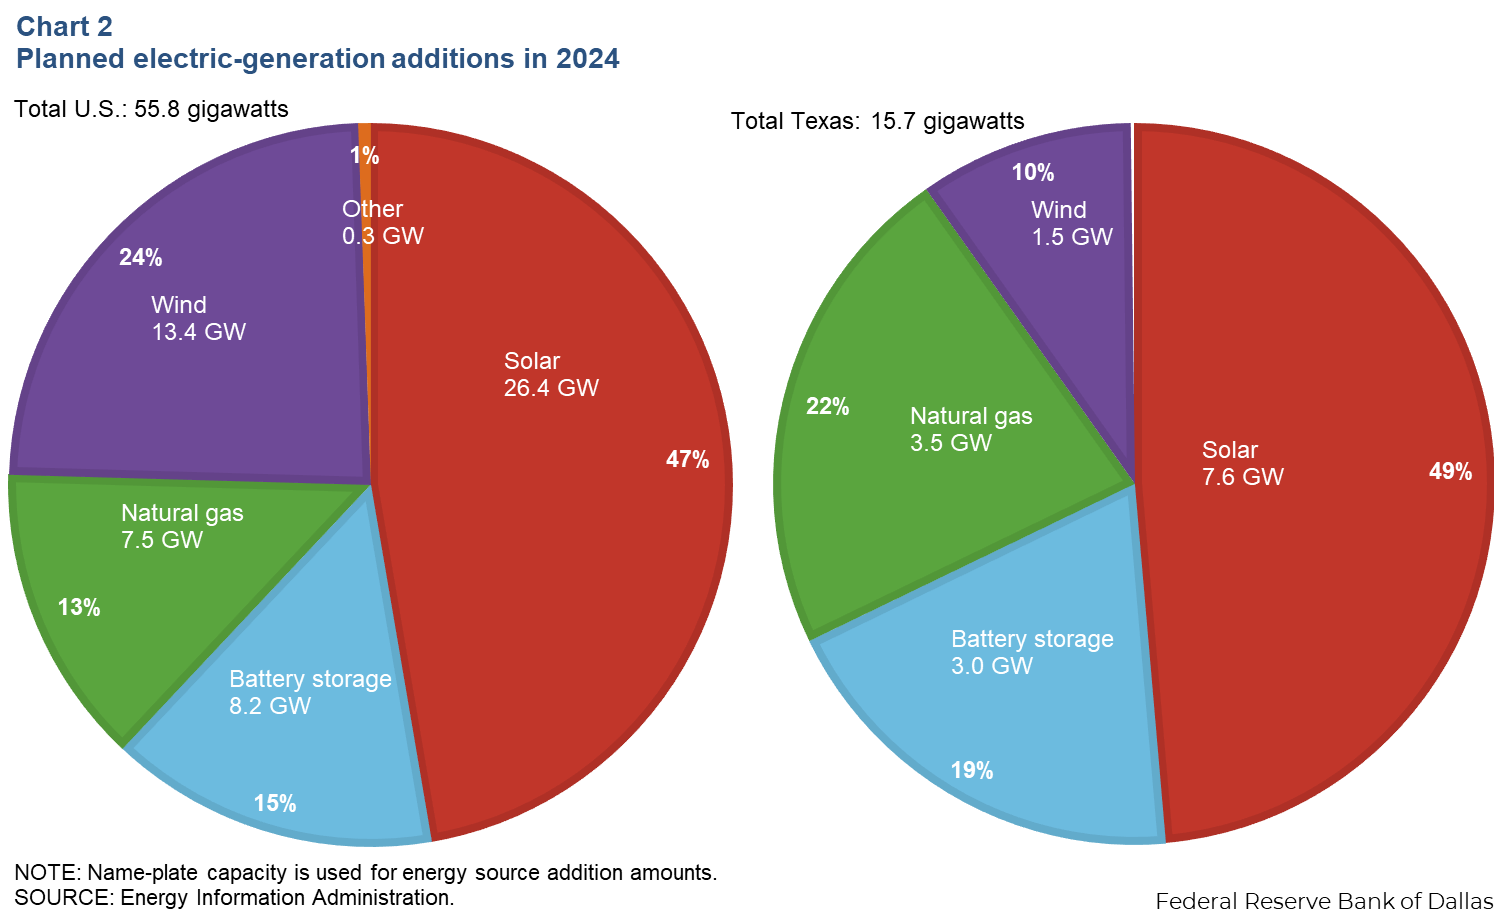
Natural gas will add 7.5 GW (13 percent of new generation capacity) to the grid. This will be the lowest new natural gas capacity in 25 years. In addition, 4.7 GW of coal and natural gas capacity is expected to be retired nationwide in 2024.
However, due to the intermittent nature of renewables like wind and solar and variations in demand for thermal power over the course of the day and year, total output potential from these sources will be much less than the total capacity. In 2023, installed utility-scale solar capacity was 690 TWh, while generation was only 162 TWh. The ratio of the two—the capacity factor—was 23 percent in 2023 and 34 percent for wind. The average capacity factor for natural gas was 41 percent.
Half of Texas’ new generation capacity in 2024 will be solar, matching that of the U.S.’ Already a global leader in wind-power production, wind will only make up 10 percent of the state’s additions versus 24 percent nationally. Texas will also see the addition of 3.5 GW of natural-gas-fired turbines, nearly half that of the nation. Most of these gas plants are peakers—turbines optimized to flex up and down when demand spikes or when output from other sources like intermittent renewables or less reliable older coal and gas plants (1.7 GW of which are slated for retirement this year) is unable to meet demand.
For the first time, Texas is also recruiting a material volume of battery storage capacity to join peaker plants in balancing the Texas grid. Over one-third of all U.S. utility-scale battery storage installations this year will be in Texas, adding 3 GW of dispatchable power to the state. Combined with new gas-fired units and other efforts to ensure sufficient capacity during severe weather conditions, this should help mitigate some of the state’s recent challenges regarding grid stability.
Thermal outages less severe in recent winter blast
During the most recent winter storm in Texas, Winter Storm Heather, thermal outages were only 4.3 GW when temperatures hit their coldest on Jan. 15, compared with 7.1 GW on Dec. 23, 2022, the previous Texas cold front, Winter Storm Elliot (Chart 3). Thermal outages are forced resource outages at gas, coal and nuclear power plants for unexpected malfunctions or quick repairs and maintenance.
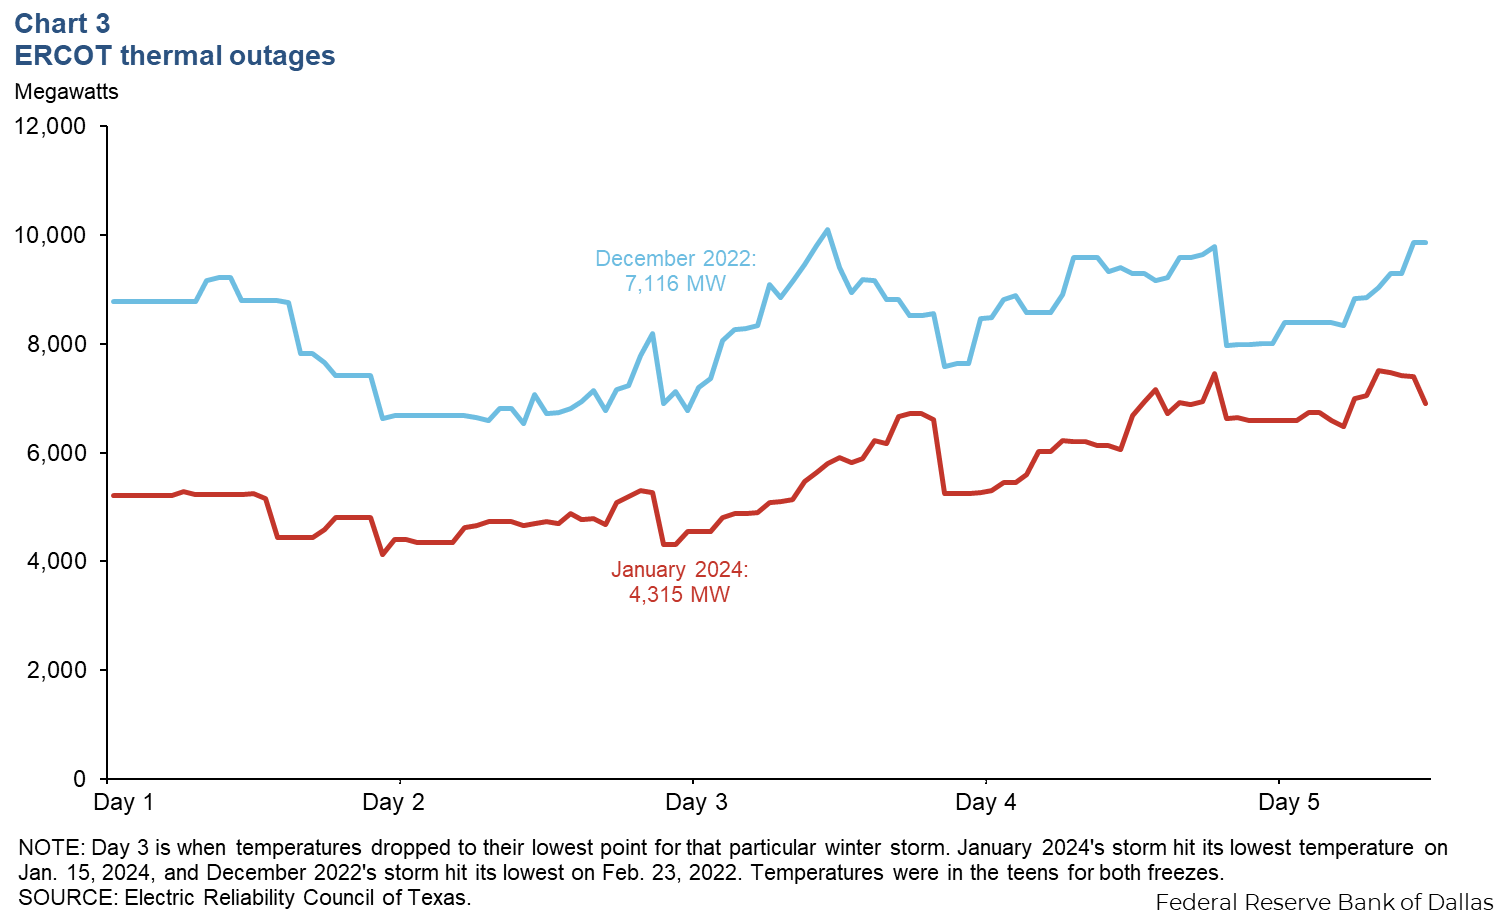
The lower outages were due in part to changes made by the state legislature after the catastrophic Winter Storm Uri in February 2021. Measures that helped included requiring weatherization of power generation facilities, ensuring power was prioritized for critical energy infrastructure like oil and natural gas field operations and pipelines, and enhanced communication between different Texas agencies.
Battery Electric Vehicles (BEV)
Electric car sales growing
One increasing source of electrical demand is electric vehicles. Global EV sales increased from 10.3 million in 2022 to 13.6 million in 2023, a 32 percent increase (Chart 4). The U.S. saw the largest percent increase (60 percent), increasing from 1 million to 1.6 million cars sold.
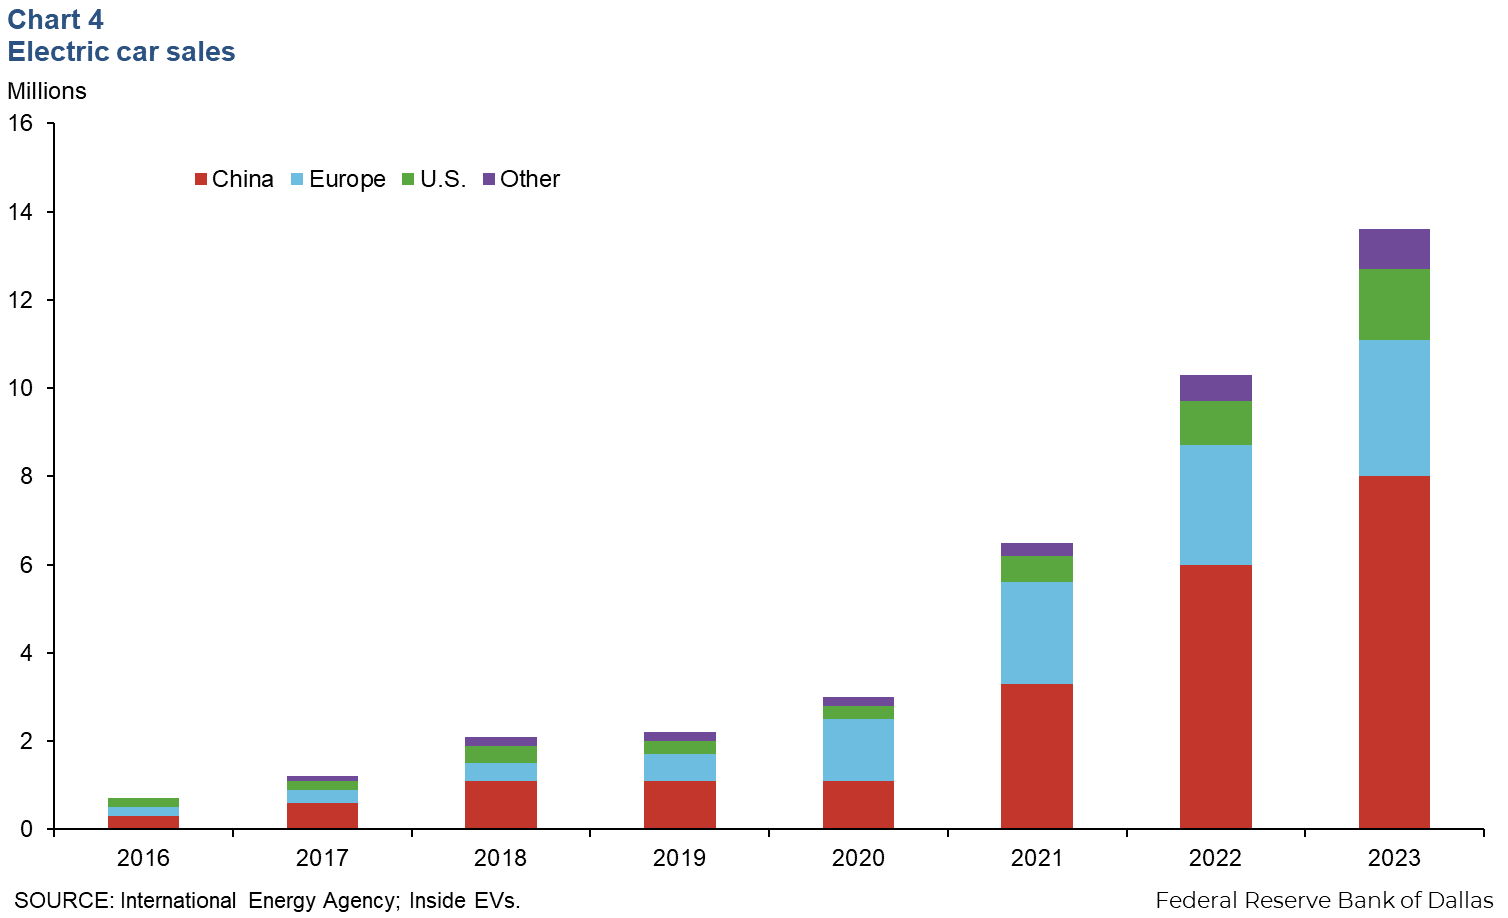
On a monthly basis though, EV sales were down 70 percent from January to December 2023, reflecting subsidy cuts in Germany and France and lower demand in China. Germany announced the termination of its BEV subsidy of up to $4,878 to help mitigate the nation’s budget deficit. The French government cut a subsidy for purchasing EV and hybrid vehicles for higher-income buyers by 20 percent.
Market penetration has been more limited in the U.S. versus Europe and China. In 2023, 25 percent of all cars sold in China were EVs, 22 percent were in the European Union and 9 percent were in the U.S. In the first six months of 2023, the average retail EV price in China was $33,000, while in the U.S. it was $72,000. In Europe, the average price of an EV is similar to that in the U.S. at $71,000, but EV buyers in Europe enjoy many benefits such as lower registration taxes, exemptions from tolls and congestion charges, and subsidies for home-charging installation.
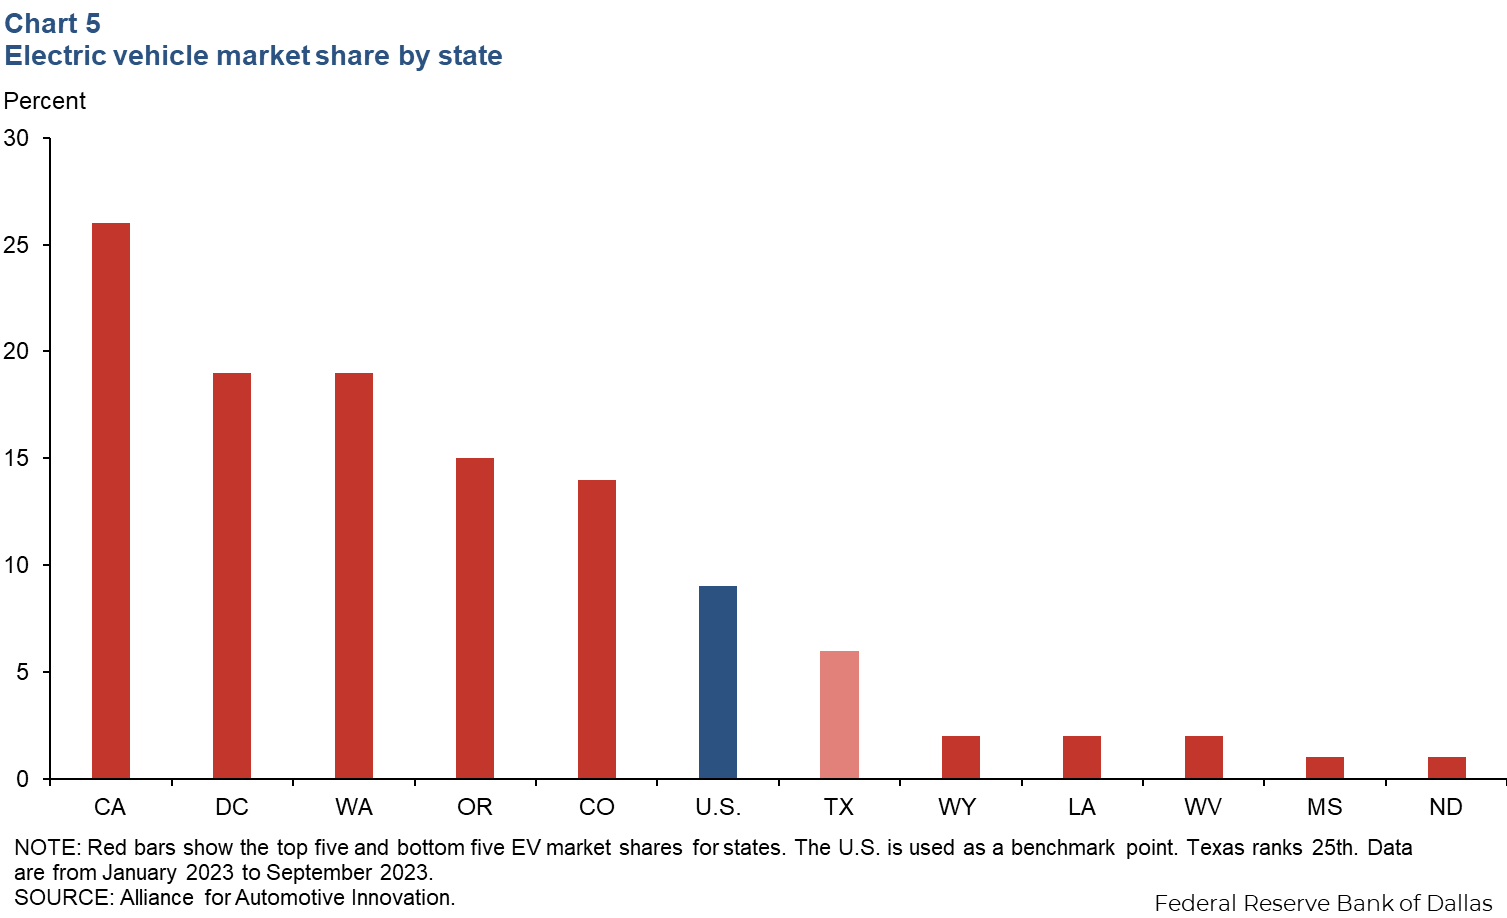
West Coast leads U.S. in EV sales
During the first three quarters of 2023, 26 percent of all vehicle sales in California were EVs, while only 1 percent of sales in North Dakota were (Chart 5). Texas’ sales came in at 6 percent of the market, 3 percent below the national average. Washington saw the greatest increase in EV market share year over year, with a 7.6 percent increase in September 2023. Twenty-one states and the District of Columbia increased their EV market share by 2 percent or more from third quarter 2022 to third quarter 2023.
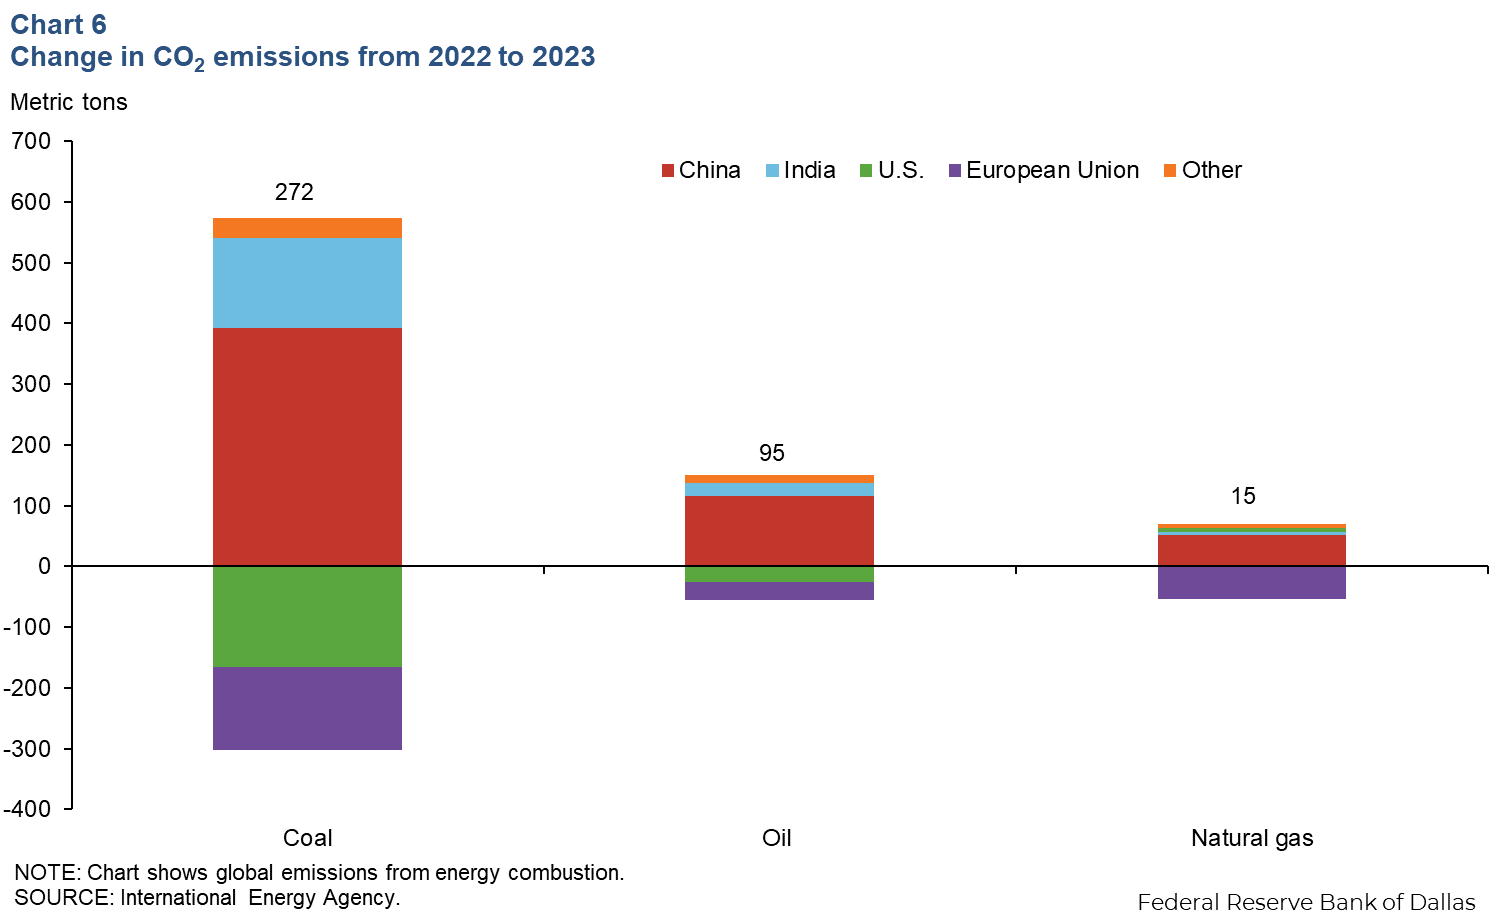
Global emissions
In 2023, a net decline in global CO2 emissions from combustion of 411 metric tons in the U.S. and European Union was offset by an increase of 736 metric tons in China and India (Chart 6). In advanced economies, emissions fell by 4.5 percent, driven by growth in renewables and increases in energy-efficiency measures.
About Energy Indicators
Questions can be addressed to Kenya Schott at kenya.schott@dal.frb.org. Energy Indicators is released monthly and can be received by signing up for an email alert. For additional energy-related research, please visit the Dallas Fed’s energy home page.