Dallas-Fort Worth Economic Indicators

March 25, 2021
Dallas–Fort Worth’s economic recovery stayed on track in January. Job growth continued for the ninth straight month and unemployment dipped. Movement in the business-cycle indexes was mixed. Housing market indicators reflected a vibrant market in February, with record-low inventories and rising prices. Home sales dipped last month largely due to activity coming to a standstill during Winter Storm Uri.
Labor Market
Job Growth Slows in January
DFW employment growth softened to an annualized 1.4 percent (4,300 jobs nonannualized) in January, marking the ninth consecutive month of job gains since the slump in spring 2020. Payrolls in Dallas expanded strongly at an annualized 3.3 percent (7,200 jobs), while employment in Fort Worth dropped 3.2 percent (-2,900 jobs). Similarly, Texas job growth moderated to 3.8 percent (38,100 jobs) from 6.2 percent in December. The unemployment rate fell to 6.2 percent in Dallas and 6.4 percent in Fort Worth in January, remaining below Texas’ jobless rate of 6.8 percent.
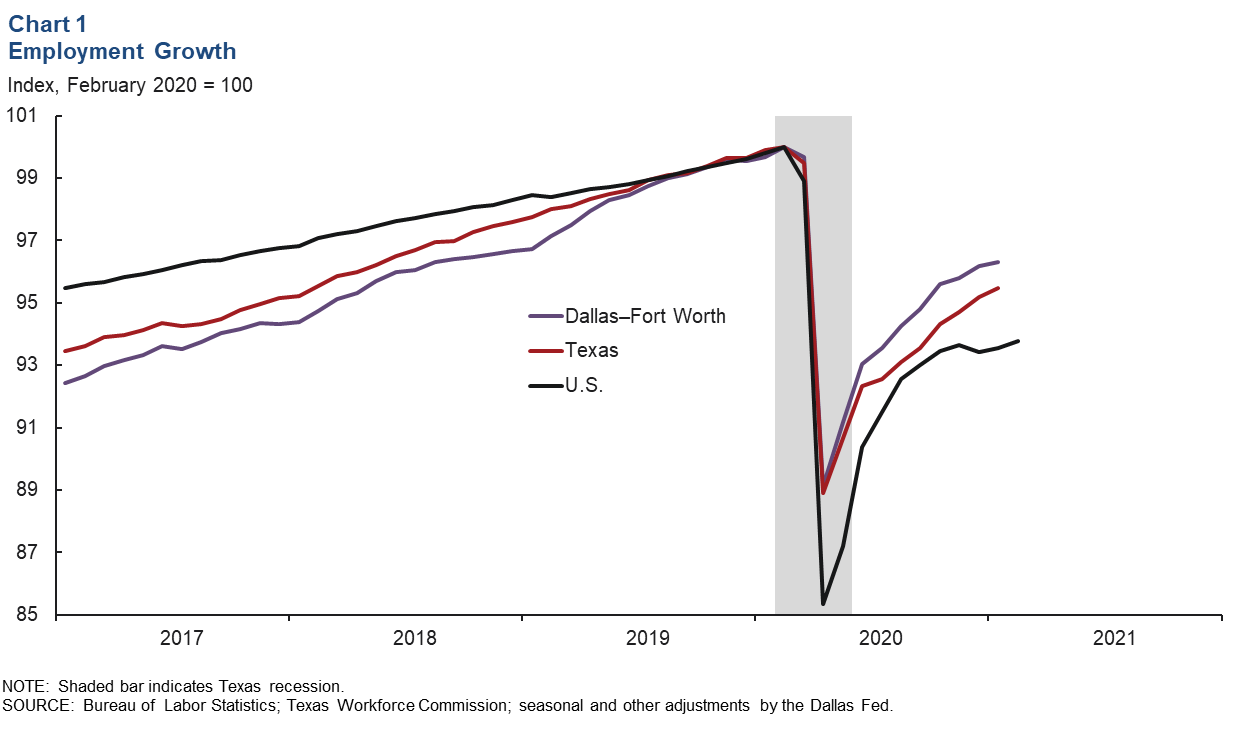
When the pandemic hit and shelter-in-place orders compelled many businesses to temporarily close their doors in early spring 2020, payrolls plunged nationally; however, the declines in Texas and DFW were less steep than in the U.S. (Chart 1). Employment in DFW began recovering in May, though in January 2021, it remained 3.7 percent lower than prepandemic February levels; Texas was 4.5 percent below those levels in January, and the U.S. was 6.2 percent lower.
Unemployment Claims Remain Elevated
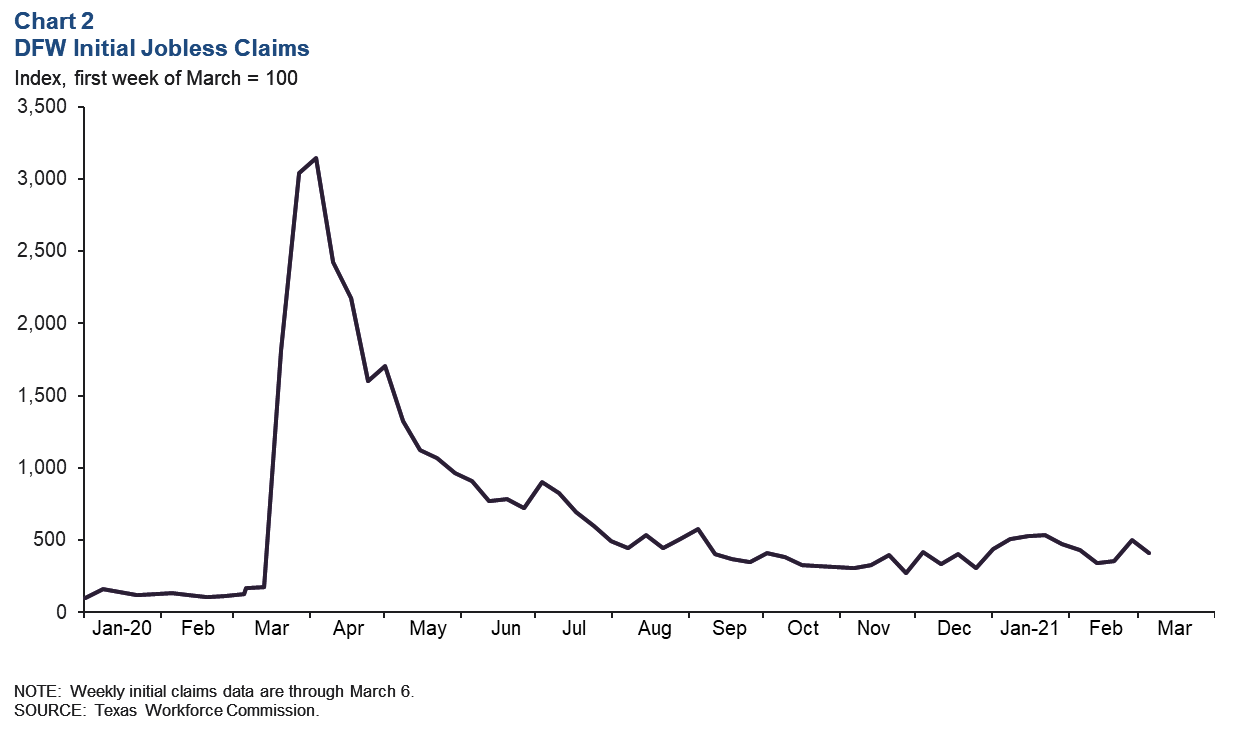
Weekly initial unemployment insurance claims in DFW dropped by 2,378 to 10,437 during the week ended March 6, after briefly rising from mid-to-late February (Chart 2). Since peaking in early April 2020, claims have been on a downward trend. The week-to-week changes have narrowed, and claims have largely stabilized, but they remain stubbornly high—more than double the early-to-mid-March 2020 (pre-COVID-19) levels.
Business-Cycle Indexes
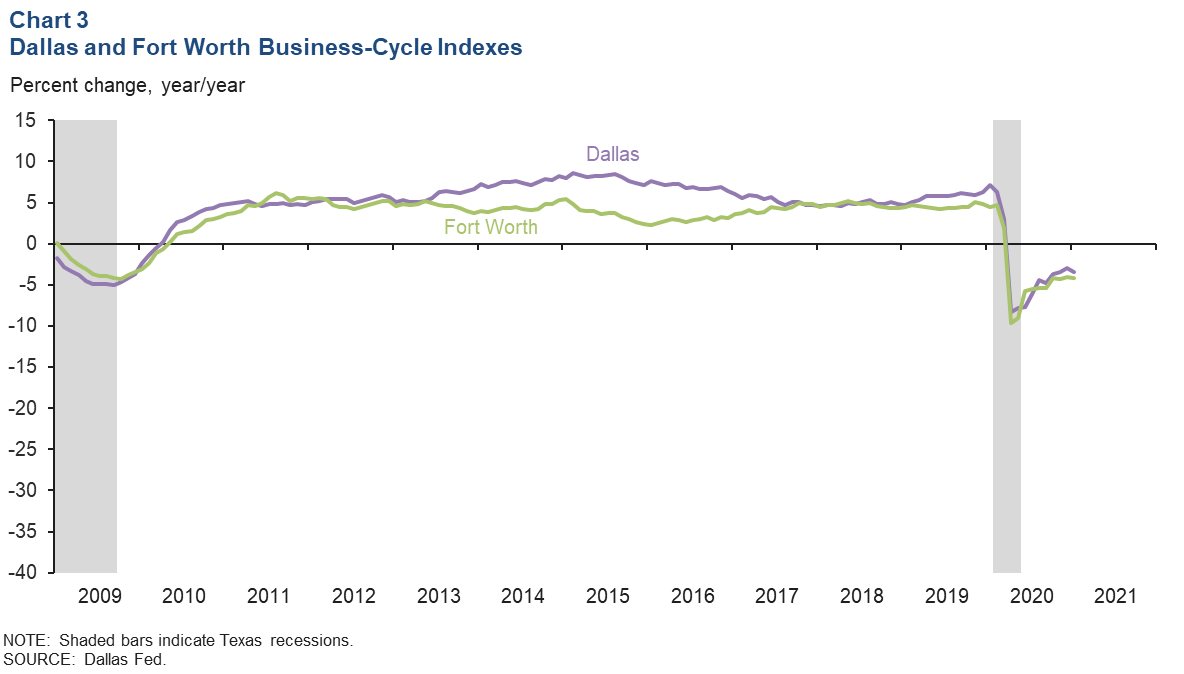
Growth in the business-cycle indexes for Dallas and Fort Worth was mixed in January. The Dallas index rose an annualized 7.1 percent in January following a strong increase in December. The Fort Worth index was flat in January after expanding moderately in December. Year over year in January, the Dallas index was down 3.4 percent, and the Fort Worth index decreased 4.1 percent (Chart 3). This was due to the COVID-19-related shelter-in-place orders that resulted in a sharp contraction in economic activity last spring.
Housing Market
Demand Holding Strong
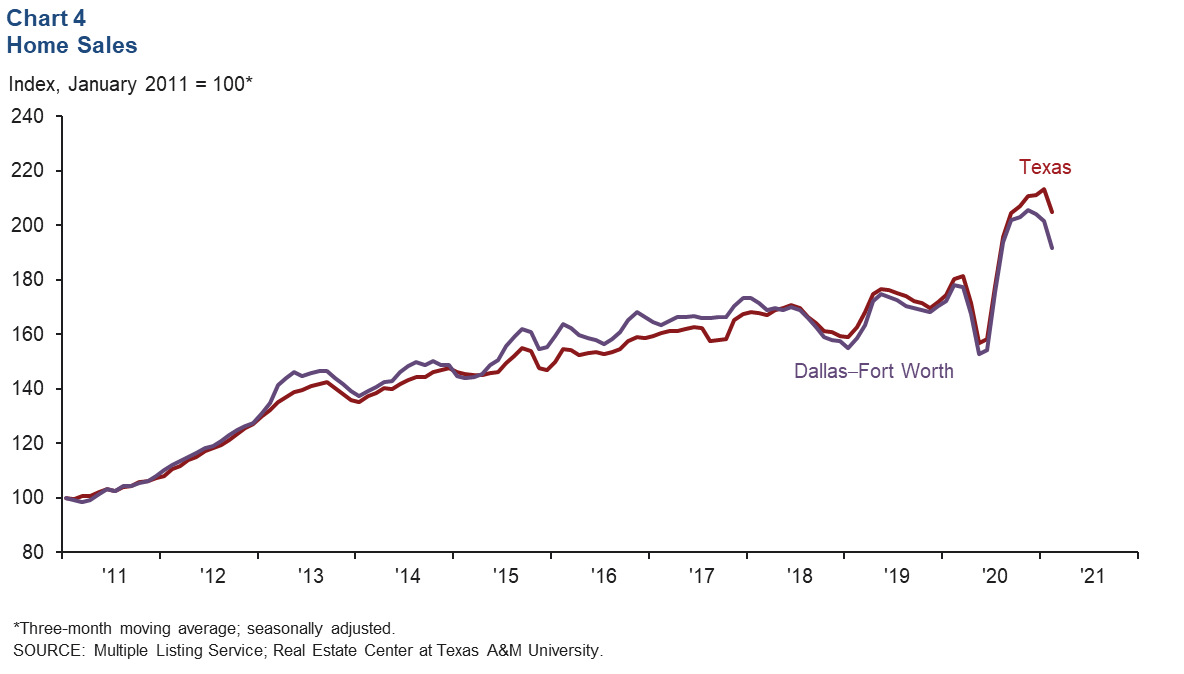
DFW existing-home sales fell in February in part due to Winter Storm Uri that put a damper on sales during the cold snap. Statewide, home sales dropped as well. The three-month moving averages for both DFW and Texas registered steep declines (Chart 4). Despite the dip in February, which is expected to be transitory, activity in the housing market remains strong, supported by record-low mortgage rates and increased demand for larger homes in less-dense areas. According to business contacts, new-home sales have been robust, particularly in suburban locations, and have outperformed expectations since May of last year when COVID-19-related shelter-in-place orders were lifted.
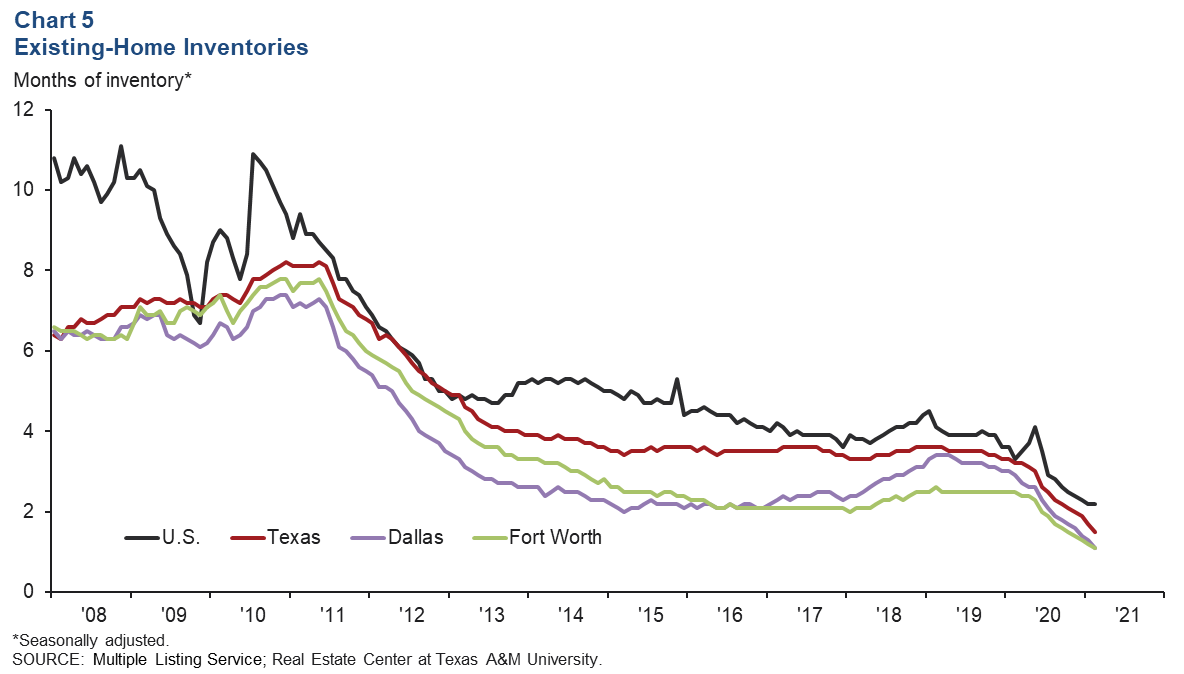
Inventories Extremely Tight
DFW existing-home inventories remained very tight at record-low levels and well below the six months’ supply typically associated with a balanced market (Chart 5). Overall inventories in DFW were around one month of supply in February, below the Texas and U.S levels of 1.5 months and 2.2 months, respectively. Inventories have been steadily declining since mid-2020. Home builders also note extremely constrained inventories of finished vacant homes and tight lot supply.
Price Appreciation Accelerates
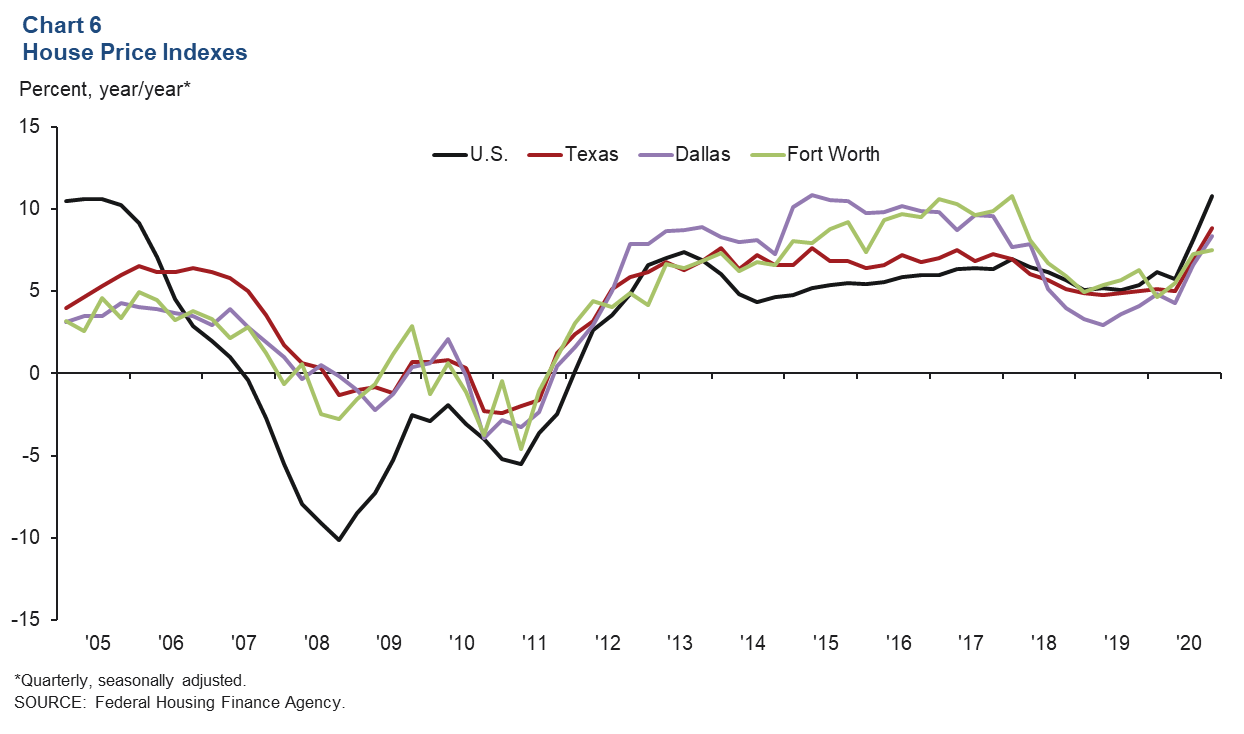
Record home sales and tight inventories continued to boost prices in the fourth quarter. Prices rose at their fastest pace in nearly three years, increasing 8.4 percent in Dallas and 7.5 percent in Fort Worth from year-ago levels in fourth quarter 2020, according to the Federal Housing Finance Agency’s Purchase-Only House Price Index (Chart 6). U.S. and Texas prices similarly saw rapid increases of 10.8 percent and 8.9 percent, respectively. In the fourth quarter, prices were up 2.8 percent in Dallas, 2.3 percent in Fort Worth, 3.1 percent in Texas and 3.8 percent in the U.S.
NOTE: Data may not match previously published numbers due to revisions.
About Dallas–Fort Worth Economic Indicators
Questions can be addressed to Laila Assanie at laila.assanie@dal.frb.org. Dallas–Fort Worth Economic Indicators is published every month on the Thursday after state and metro employment data are released.