Dallas-Fort Worth Economic Indicators

August 5, 2021
DFW economic recovery continued in June. Job growth was mixed, with payrolls contracting in the goods sector. The unemployment rate continued to decline, and the Dallas and Fort Worth business-cycle indexes expanded. Activity in the office market was still finding its footing, while industrial leasing remained remarkably strong.
Labor Market
Employment Gains Accelerate
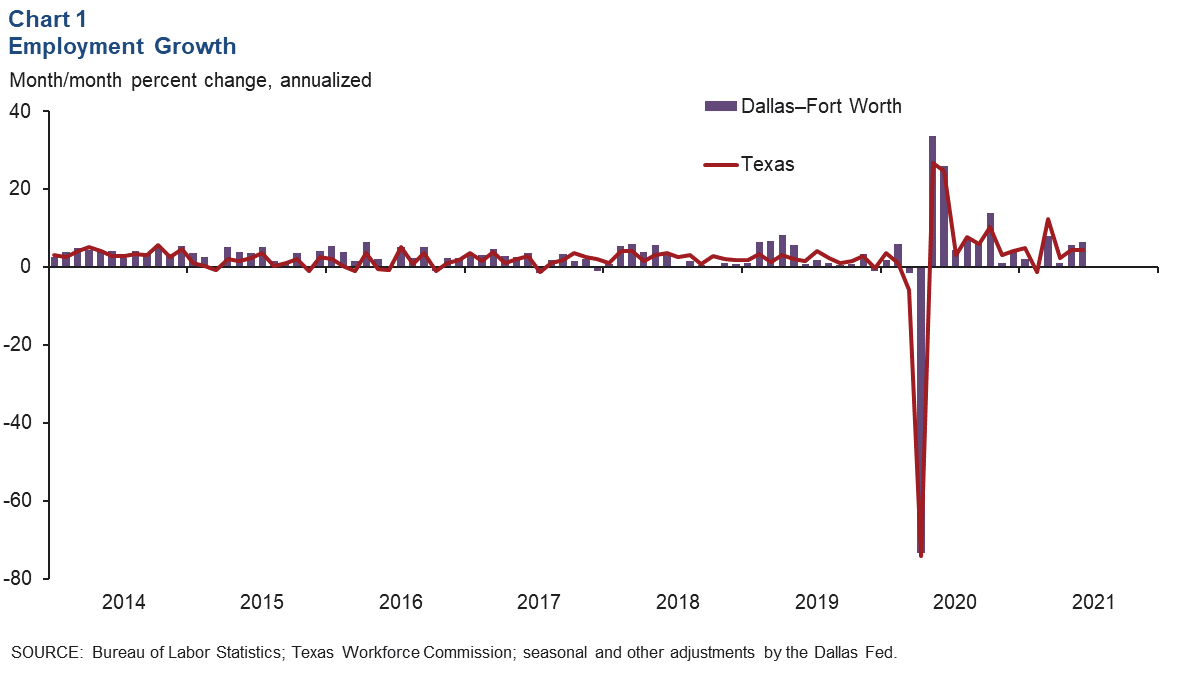
DFW employment growth strengthened in June, with payrolls increasing by 19,700 jobs (6.5 percent annualized) following an addition of 17,400 jobs in May (Chart 1). This brought payroll gains since April 2020 to a hefty 327,700—a recovery of over four-fifths of the jobs lost in the initial months of the pandemic. The unemployment rate dipped further in June to 5.4 percent in Dallas and 5.6 percent in Fort Worth.
Leisure and Hospitality Leads Second-Quarter Increases
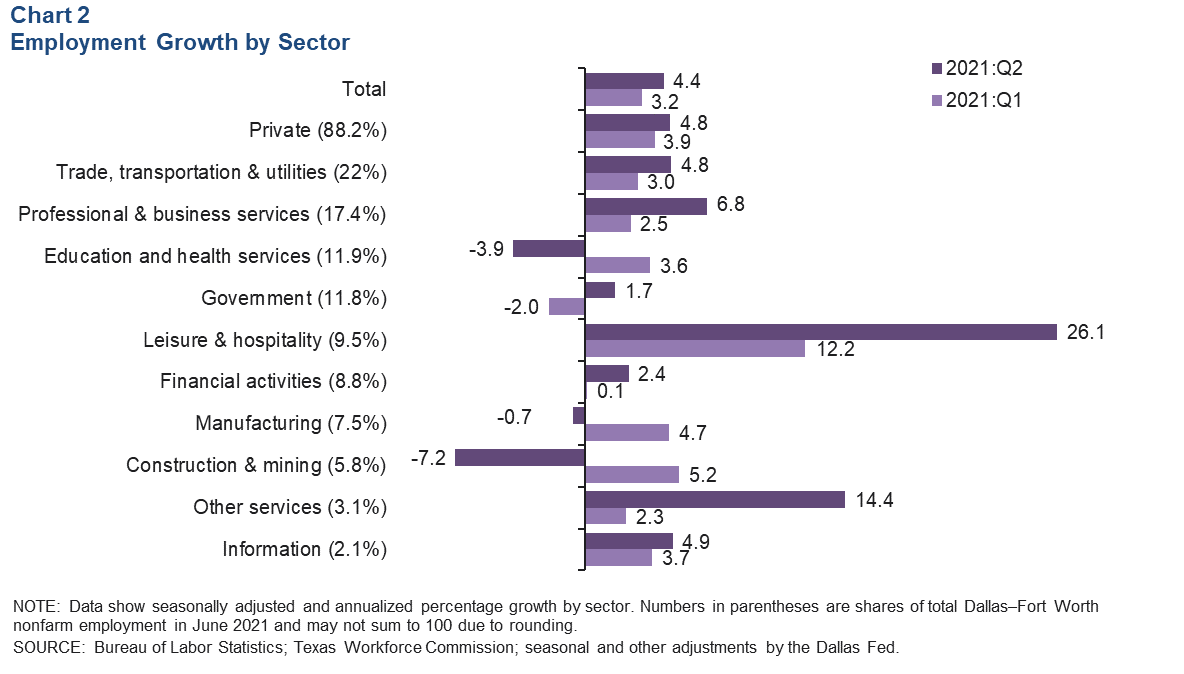
Payrolls in DFW expanded an annualized 4.4 percent (40,200 jobs) in the second quarter, an acceleration from the gains seen in the first quarter (Chart 2). Growth was mixed across sectors. Goods-sector employment contracted, with payrolls in manufacturing (0.7 percent, or 500 jobs) and construction and mining (7.2 percent, or 4,100 jobs) shrinking. On the services side, leisure and hospitality led growth (26.1 percent, or 20,300 jobs) and was followed by other services (14.4 percent, or 3,800 jobs) and professional and business services (6.8 percent, or 10,700 jobs). Payrolls in education and health services contracted 3.9 percent, or a loss of 4,500 jobs.
Business-Cycle Indexes
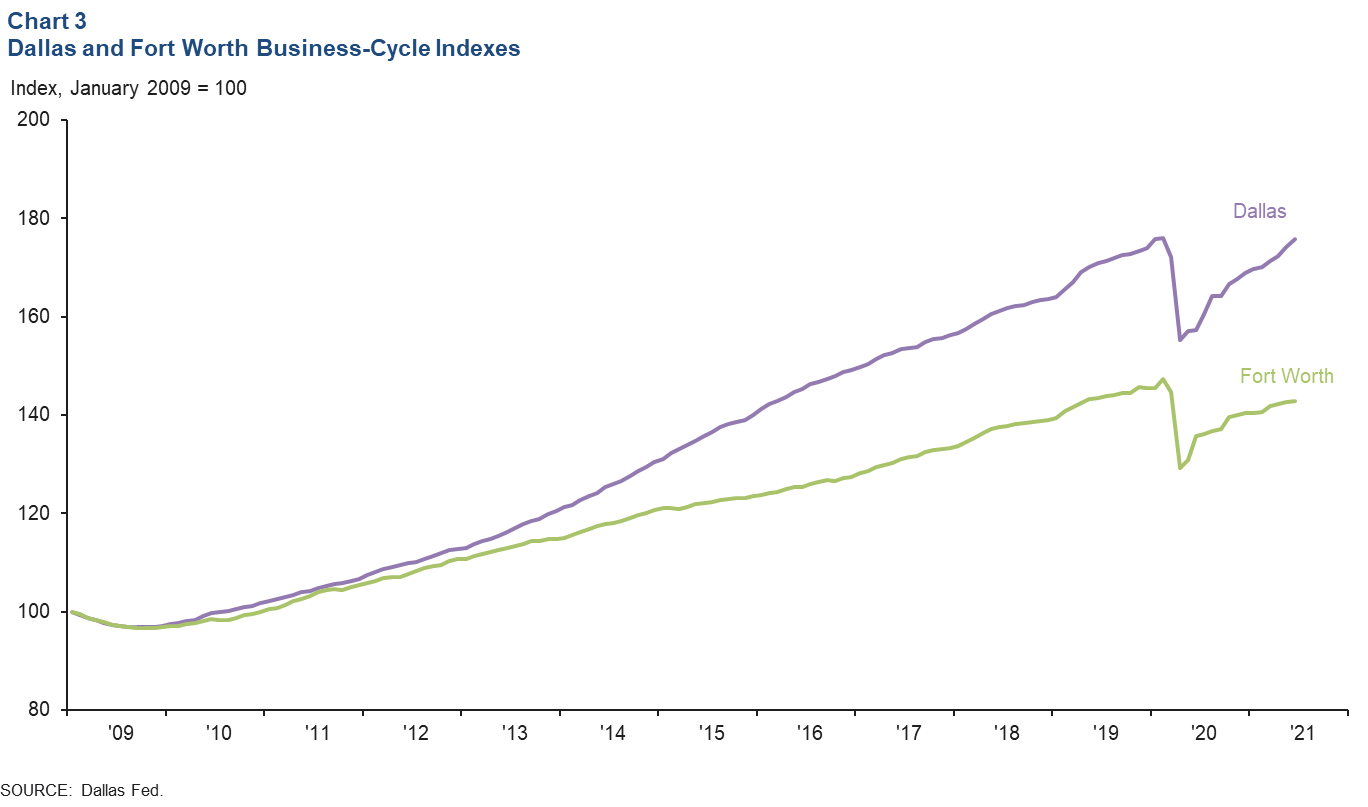
The Dallas and Fort Worth business-cycle indexes—broad measures of economic activity—expanded in June, buoyed by recent job gains and unemployment rate declines. The indexes rose an annualized 12.3 percent in Dallas and 1.5 percent in Fort Worth in June, marking the 14th consecutive month of growth for both indexes and suggesting continued recovery in the DFW economy (Chart 3). Indexes remain down 0.2 percent in Dallas and 3.0 percent in Fort Worth from February 2020 levels.
Commercial Real Estate
Office Vacancy Continues to Creep Up
Demand for office space in DFW remained weak in second quarter 2021 as tenants continued to reevaluate their space needs. Net absorption was negative for the sixth straight quarter at 358,00 square feet, pushing up the vacancy rate to a multiyear high of 24.6 percent, according to data from CBRE Research (Chart 4). This is the first time in recent history that the metro has seen six consecutive quarters of negative absorption. Availability of sublease space dipped to 8.9 million square feet or 13.7 percent of total available space (direct plus sublease). Class A properties accounted for two-thirds of the metro area’s sublease space. Business contacts expect leasing activity to gradually improve in the near term.

Industrial Boom Ongoing
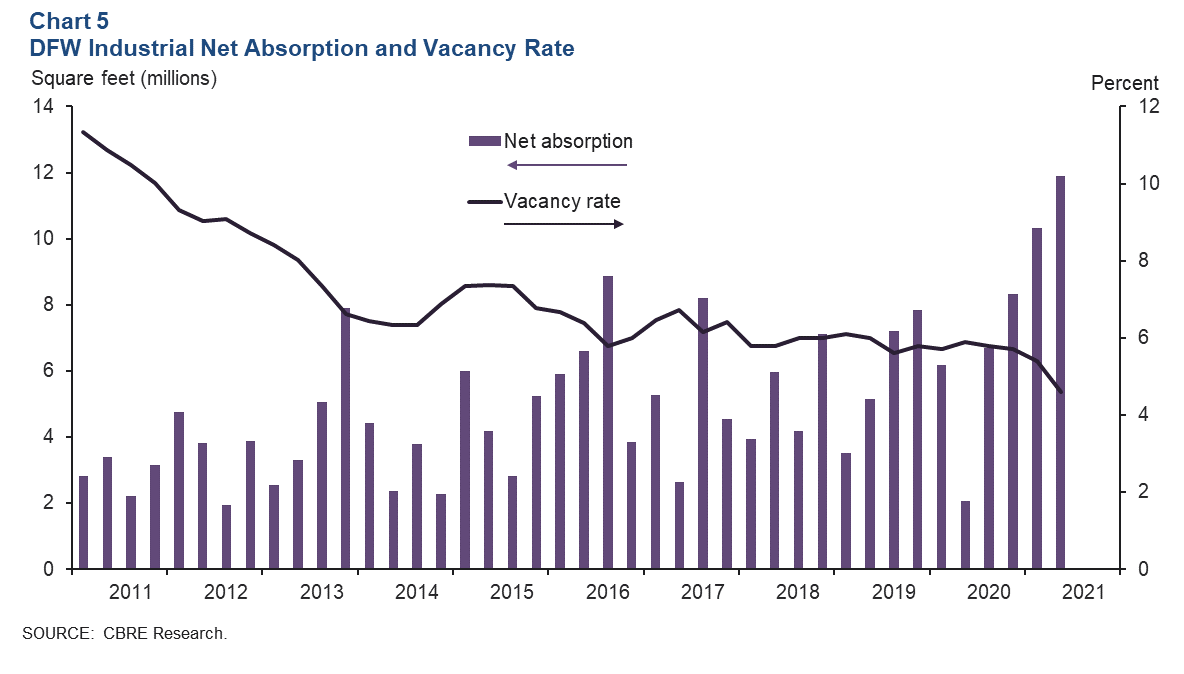
Leasing activity for industrial space strengthened in the second quarter, driven by demand from consumer goods, e-commerce and logistics firms, according to CBRE. Net absorption was a record 11.9 million square feet, bringing the first half of the year’s total to 22.2 million square feet (Chart 5). The vacancy rate fell from 5.4 percent to 4.6 percent, buoyed by persistent strong demand. The pandemic has boosted online sales growth, which has been a boon to distribution hubs such as DFW. Construction soared from 22.4 million square feet in the first quarter to 27.1 million square feet in the second, of which 31.9 percent was preleased.
NOTE: Data may not match previously published numbers due to revisions.
About Dallas–Fort Worth Economic Indicators
Questions can be addressed to Laila Assanie at laila.assanie@dal.frb.org. Dallas–Fort Worth Economic Indicators is published every month after state and metro employment data are released.