Dallas-Fort Worth Economic Indicators

September 29, 2021
DFW’s economic recovery remained on track in August. Job growth slowed from July but was robust relative to the historical average. The unemployment rate continued to decline, and the Dallas and Fort Worth business-cycle indexes expanded at above-average rates. Activity in the housing market remained robust, characterized by strong sales, tight inventories and vigorous construction of single-family homes.
Labor Market
Payroll Gains Slow but Still Strong
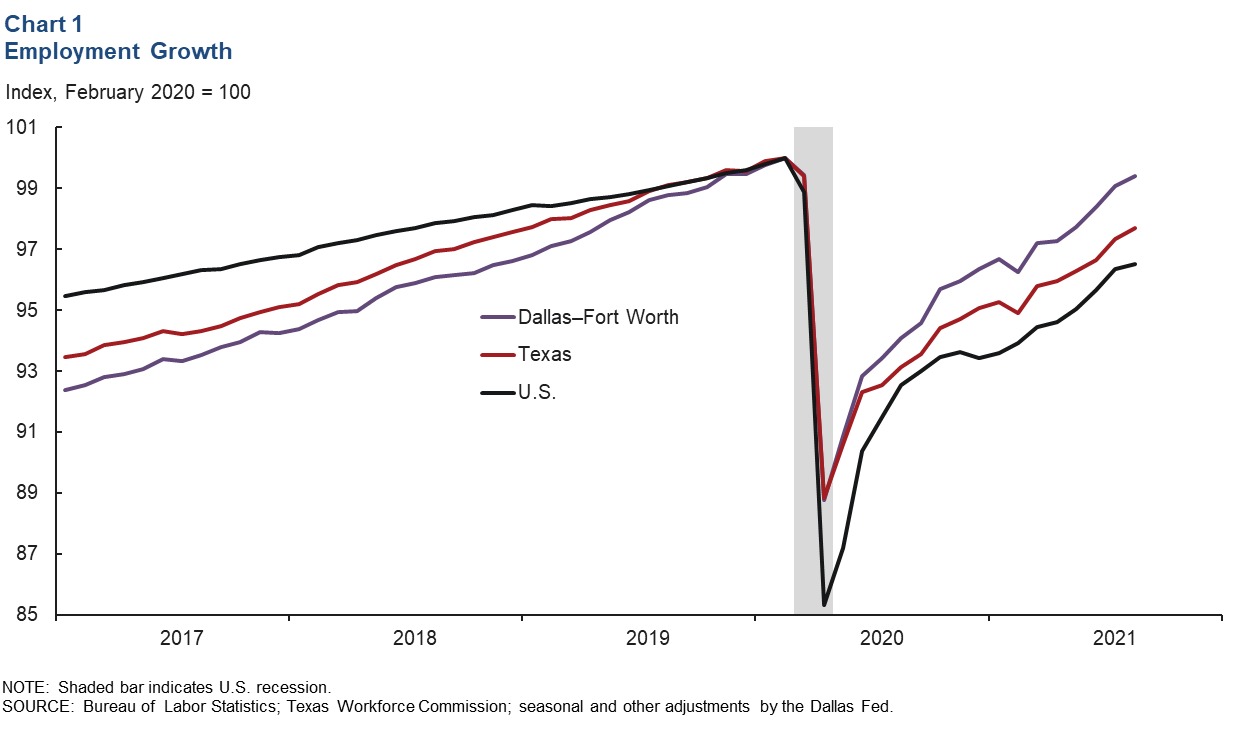
Employment growth continued in August, with DFW payrolls increasing by 12,900 (4.1 percent annualized) following an addition of 26,100 jobs in July. This brought payroll gains since April 2020 to a hefty 410,600. In August, DFW employment was only 0.6 percent (22,800 jobs) below its February 2020 high, while payrolls in Texas and the U.S. were 2.3 percent and 3.5 percent below, respectively (Chart 1).
Unemployment Falls Further
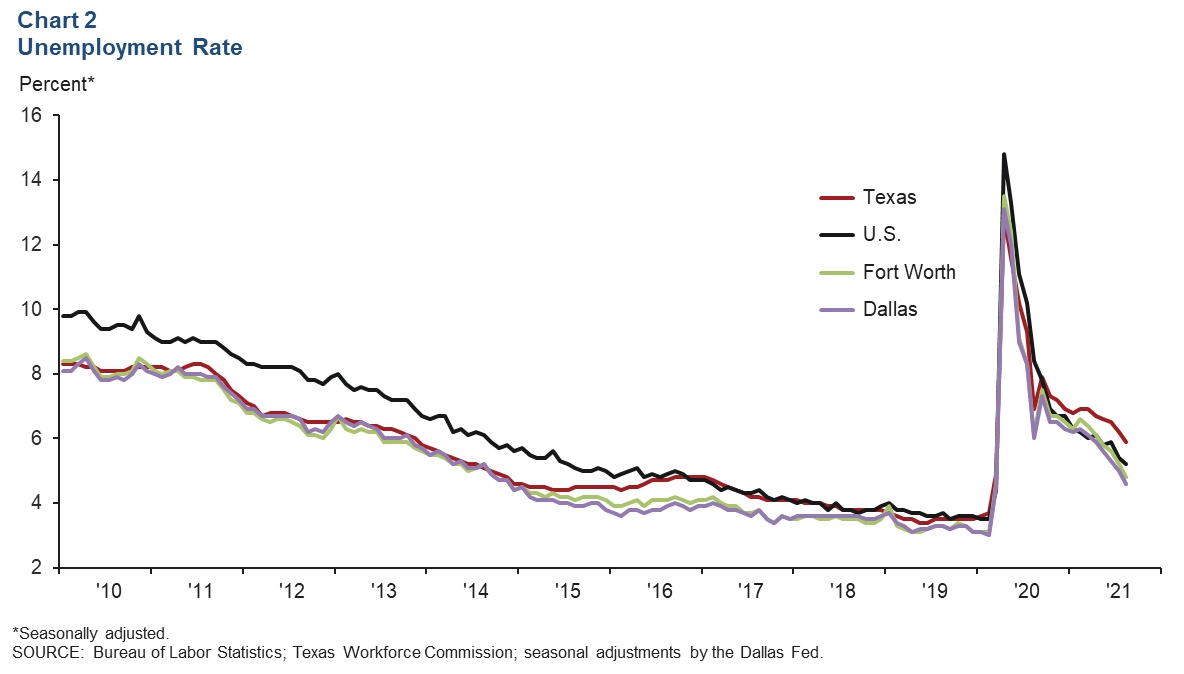
The jobless rates in Dallas and Fort Worth dipped below 5.0 percent for the first time in 17 months (Chart 2). In August, the rates fell to 4.6 percent in Dallas and 4.8 percent in Fort Worth and remained below the state’s (5.9 percent) and nation’s (5.2 percent) rates. Since peaking in early April 2020, the headline unemployment rates in Dallas and Fort Worth have generally been on a downward trend.
Business-Cycle Indexes
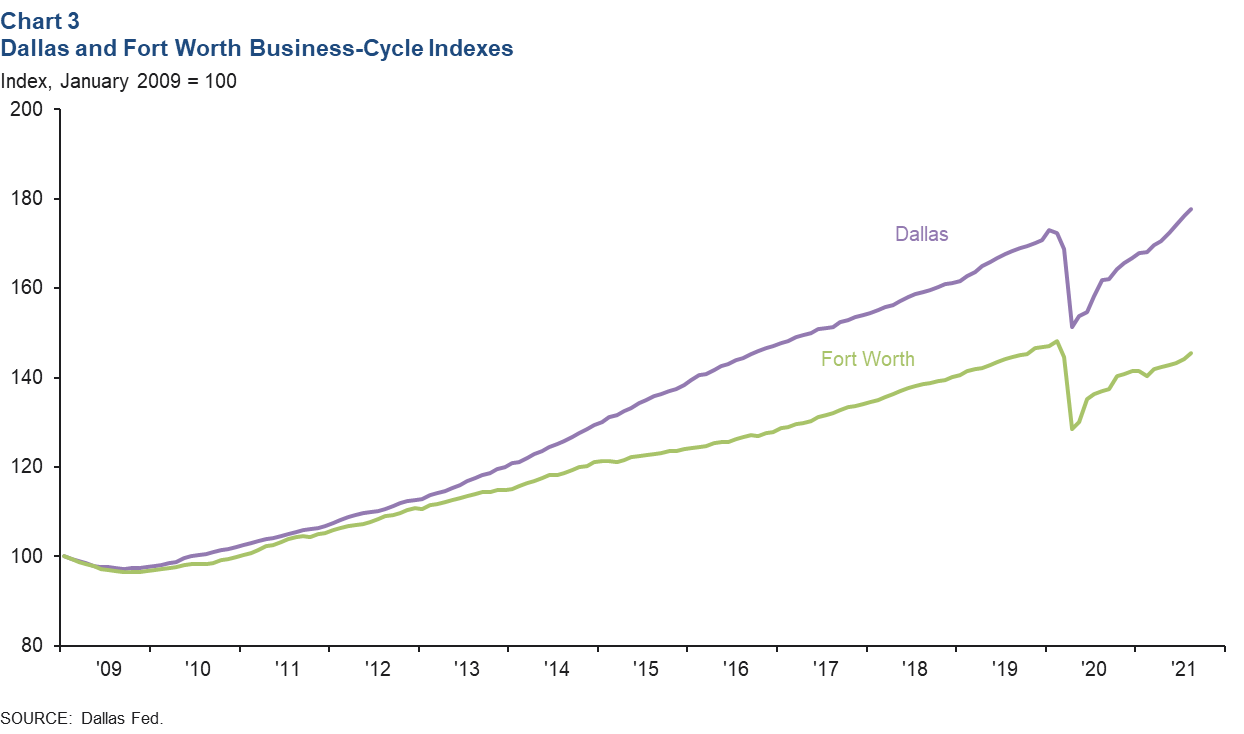
The Dallas and Fort Worth business-cycle indexes—broad measures of economic activity—continued to expand in August, buoyed by job gains and unemployment rate declines. The Dallas index rose an annualized 10.5 percent, marking the 16th successive month of growth, and is up 3.1 percent from its February 2020 level (Chart 3). The Fort Worth index rose an annualized 12.3 percent in August, its sixth straight month of expansion, but it remains down 1.9 percent from its February 2020 high.
Housing
Home Demand Robust
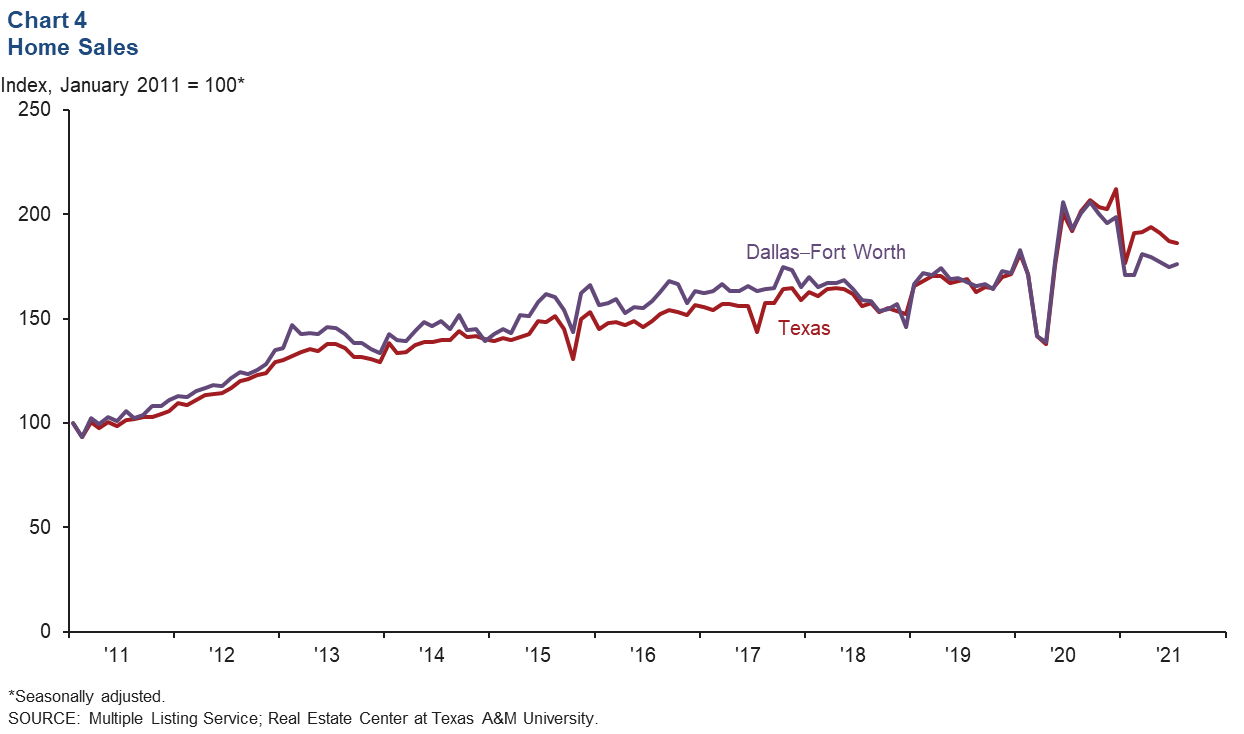
DFW existing-home sales rose 0.7 percent in August following slight declines in the previous three months (Chart 4). Statewide, existing-home sales dipped 0.6 percent. According to business contacts, new-home sales stayed solid but were not as frantic as earlier in the year. Sales are being supported in part by near record-low mortgage rates.
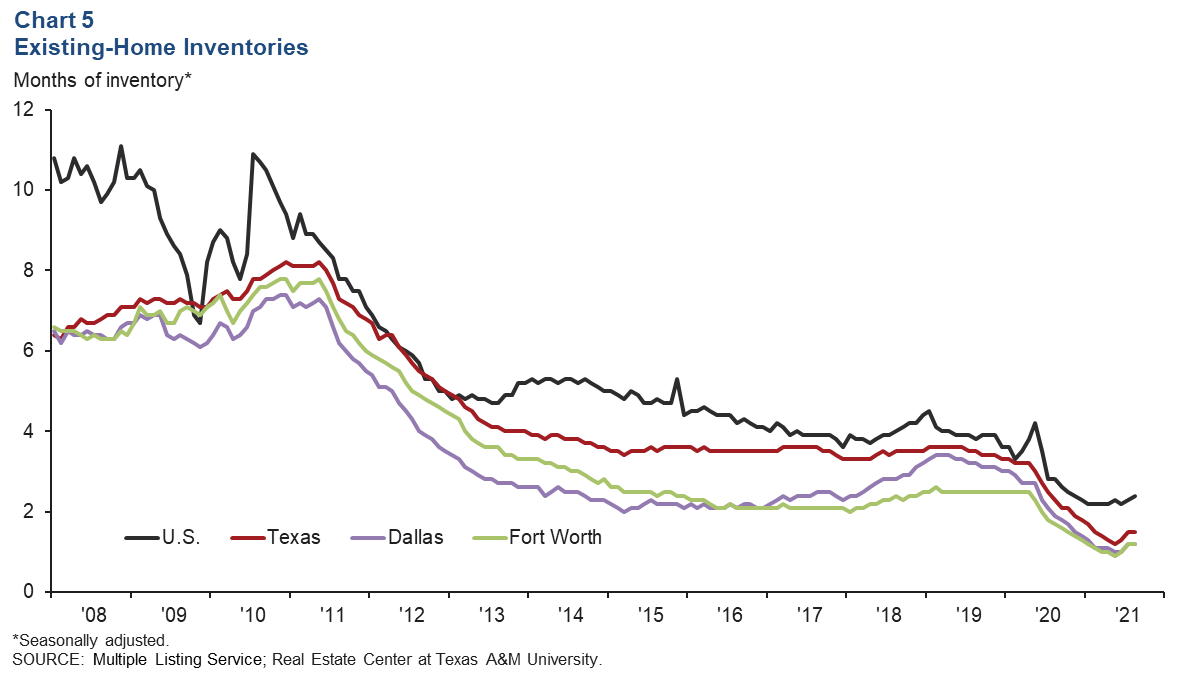
Inventories Tight
DFW existing-home inventories remained very tight near record-low levels and well below the six months’ supply typically associated with a balanced market (Chart 5). Overall existing-home inventories in DFW were at 1.2 months of supply in August, below the Texas and U.S levels of 1.5 months and 2.4 months, respectively. Inventories have been edging higher in recent months after steadily declining since mid-2020. Active listings in DFW dipped in August, and homebuilders continued to cite constrained inventories of new homes in the metroplex.
Single-Family Construction Elevated
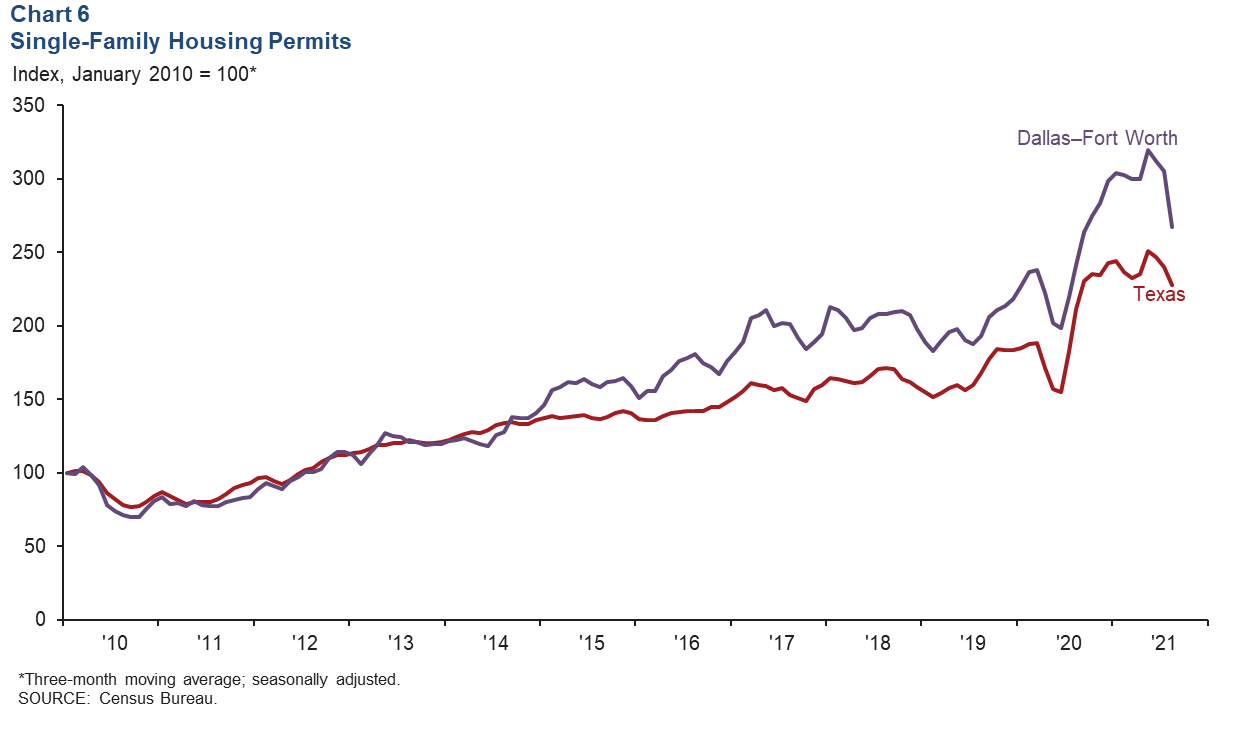
Single-family permit issuance, which leads home construction, fell in August for the third straight month (Chart 6). Homebuilders noted that tight lot supply and shortages of labor and materials have elongated building-cycle times and are restraining activity. However, through August, DFW single-family permits were up 28.7 percent compared with the same period in 2020. The metroplex remains one of the busiest markets in single-family construction among large U.S. metros. In 2020, nearly 43,500 single-family permits were issued, up from 35,000 in 2019. DFW single-family permit issuance dipped at the onset of the pandemic but reversed course by June, rising strongly in the second half of 2020.
NOTE: Data may not match previously published numbers due to revisions.
About Dallas–Fort Worth Economic Indicators
Questions can be addressed to Laila Assanie at laila.assanie@dal.frb.org. Dallas–Fort Worth Economic Indicators is published every month after state and metro employment data are released.