Dallas-Fort Worth Economic Indicators

December 5, 2022
| DFW economy dashboard (October 2022) | |||
| Job growth (annualized) Aug.–Oct. '22 |
Unemployment rate |
Avg. hourly earnings |
Avg. hourly earnings growth y/y |
| 2.5% | 3.5% | $33.62 | 3.2% |
Dallas–Fort Worth’s economy expanded in October. Payroll employment grew broadly, and unemployment held steady. Home sales and apartment demand fell again, and home inventories rose. In the third quarter, housing affordability dipped further due to rising mortgage rates.
Labor market
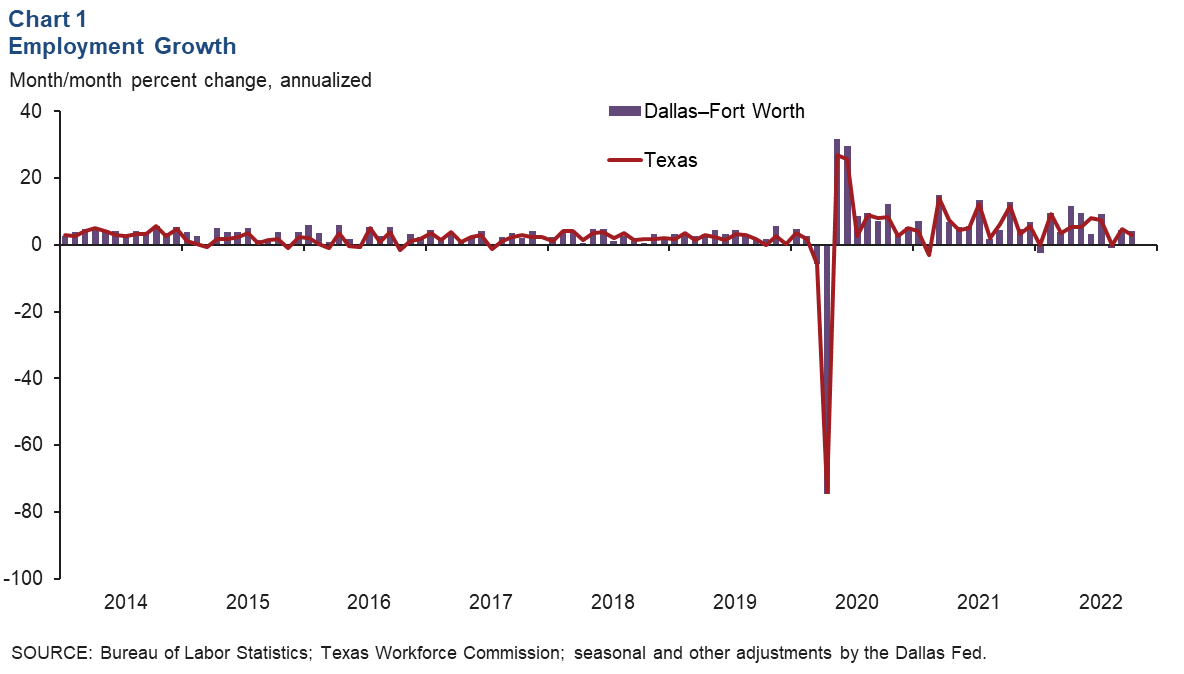
Payroll gains solid
DFW employment grew an annualized 4.2 percent in October (Chart 1). Payrolls rose 3.5 percent in Dallas and 6.0 percent in Fort Worth. Texas’ payrolls expanded 2.9 percent in October following a 4.8 percent increase the prior month. The unemployment rate was unchanged at 3.5 percent in DFW, below the Texas and U.S. jobless rates of 4.0 percent and 3.7 percent, respectively.
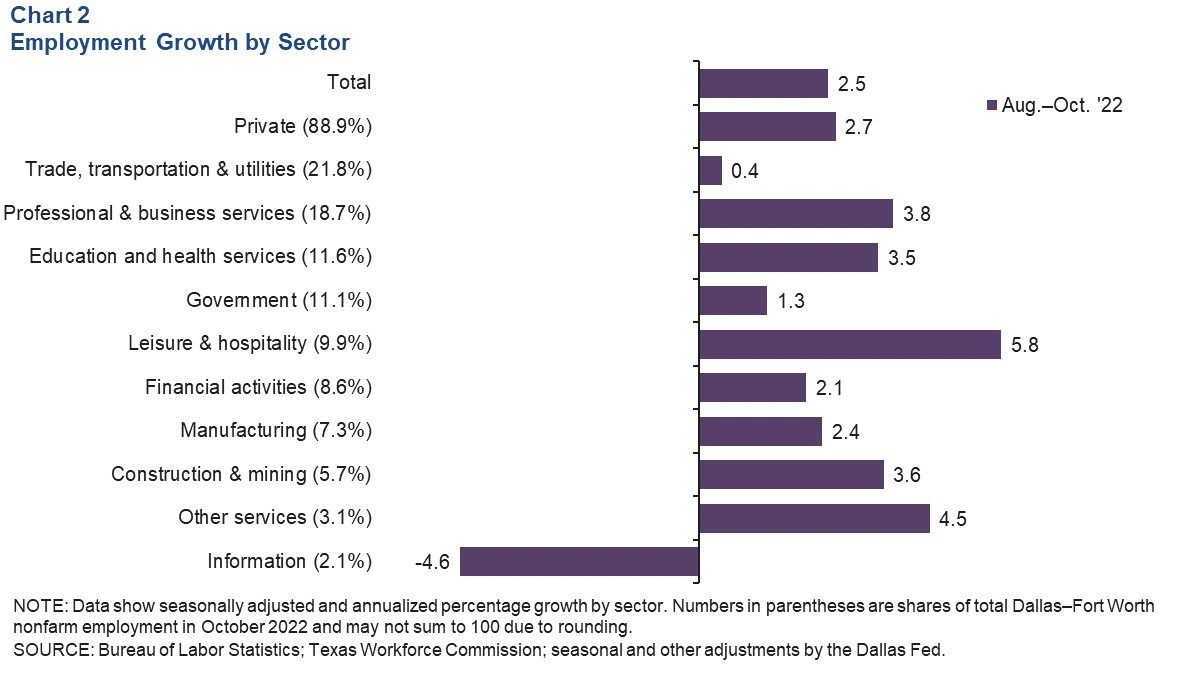
Job growth broad based
Payroll employment gains were mostly widespread across sectors in the three months ending in October (Chart 2). Growth was led by leisure and hospitality, up an annualized 5.8 percent, or 5,700 jobs, followed by the other services and professional and business services sectors. Employment growth in the metroplex’s largest employment sector, trade, transportation and utilities—which makes up over a fifth of DFW employment—was modest at an annualized 0.4 percent, or 980 jobs, while employment in information services declined during the period.
Housing
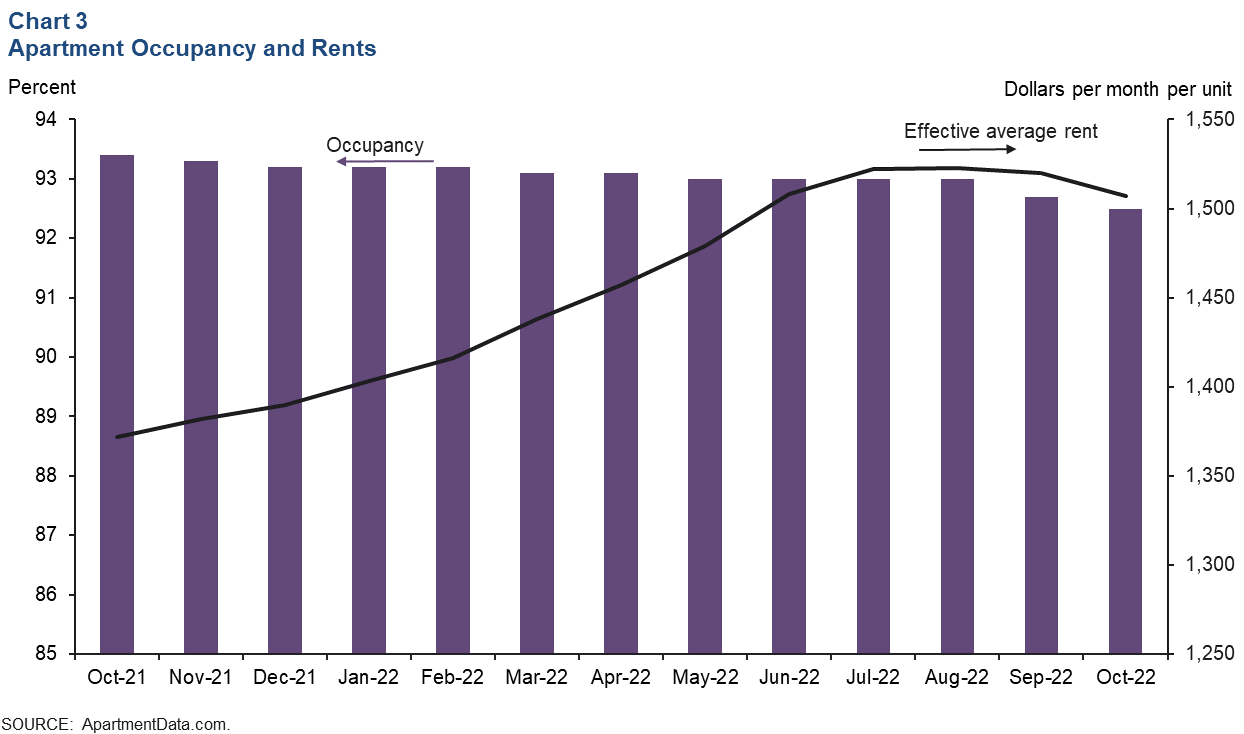
Apartment demand weakens
DFW apartment absorption eased in October. Net absorption was -1,552 units following a decline of 929 units in September. As demand moderated, effective monthly rents in DFW dipped to $1,507 per unit in October (Chart 3). Rents were still up 9.8 percent year over year. Occupancy edged down to 92.5 percent from 92.7 percent in September.
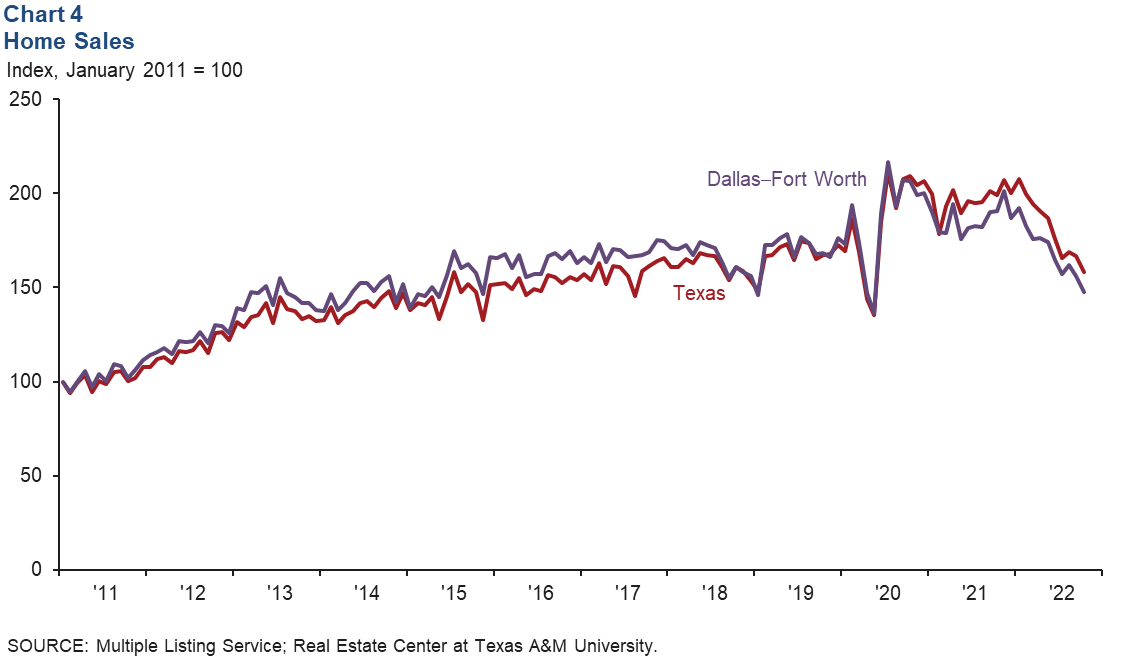
Existing-home sales drop further
DFW existing-home sales contracted in October, falling 5.3 percent (Chart 4). Statewide, existing-home sales fell at a similar pace (5.2 percent). Year over year in October, sales were down 22.5 percent in DFW and 20.6 percent in Texas. According to business contacts, new-home sales have slowed markedly, dampened by close to multidecade-high mortgage rates and elevated home prices. Cancellations are near or at record highs, and incentives are widespread, including price reductions.
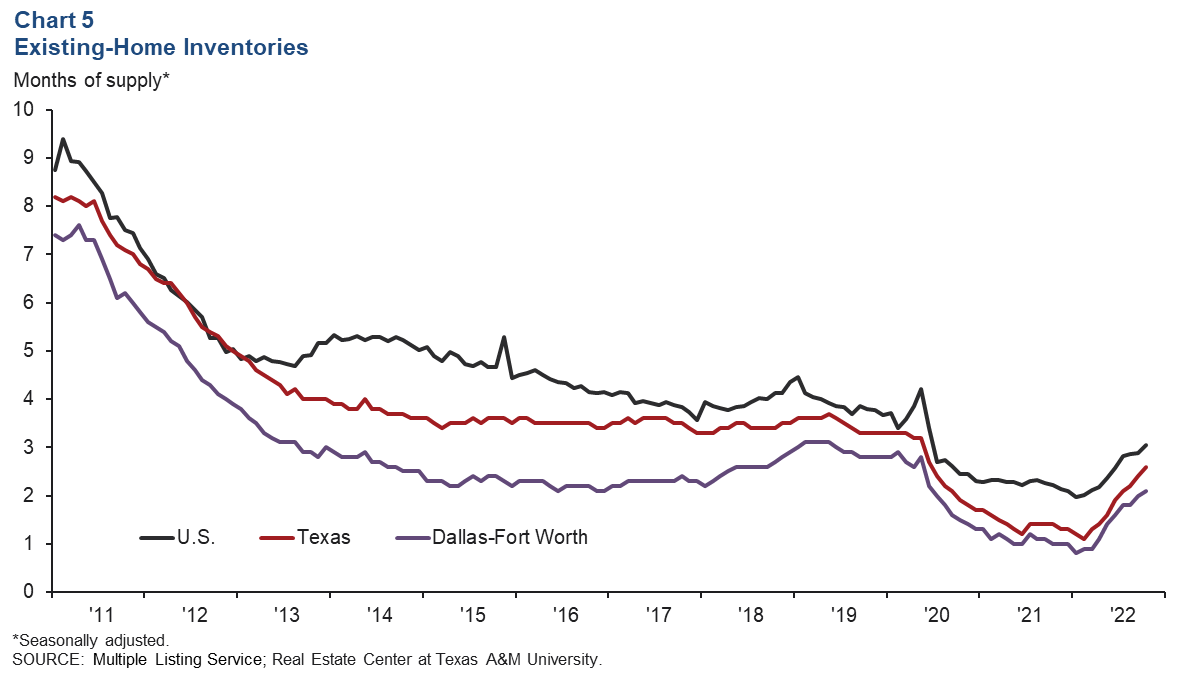
Existing-home inventories rise
DFW existing-home inventories ticked up to 2.1 months of supply in October but remained below the six-month mark considered a balanced market (Chart 5). DFW’s housing inventories were slightly below the state’s 2.6 months of supply and the nation’s 3.1 months. Inventories have been steadily rising in DFW, Texas and the U.S. since earlier in the year.
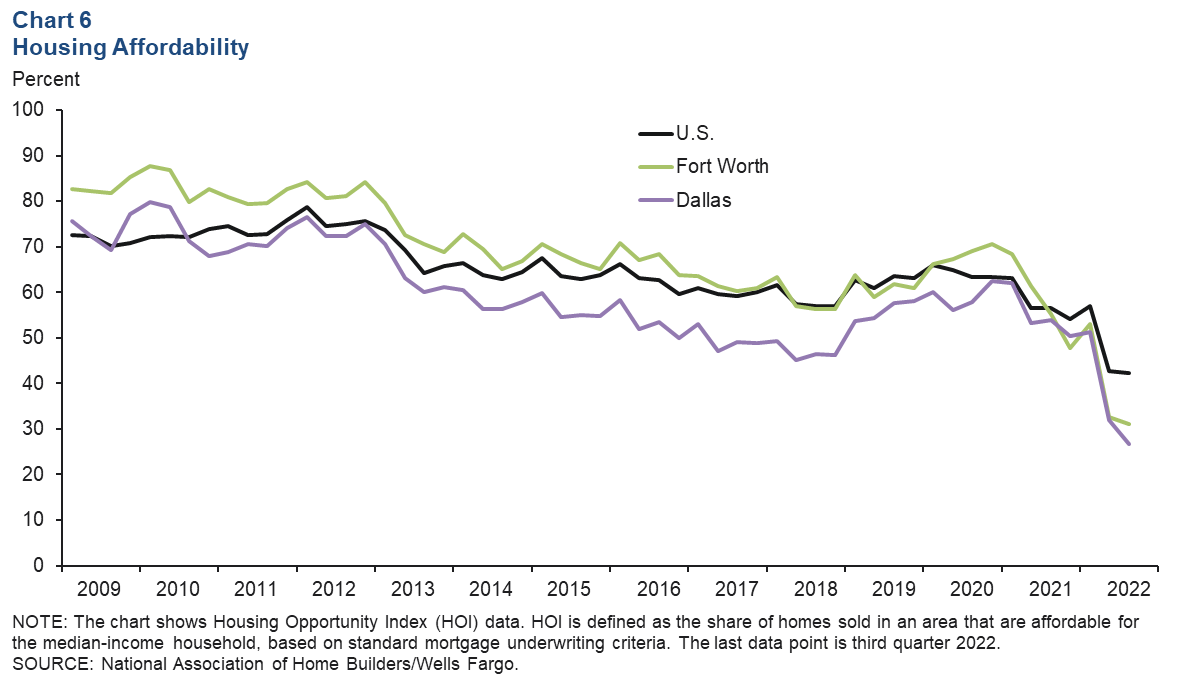
Affordability decreases further
Housing affordability fell in the third quarter due to a combination of high home prices and climbing mortgage rates (Chart 6). In Dallas, the share of homes sold that the median-income household could afford dropped from 31.9 percent in the second quarter to 26.6 percent in the third. Affordability in Fort Worth dipped 1.7 percentage points to 31.0 percent in the third quarter. Affordability was little changed in the U.S. last quarter. In October, the median home sales price was little changed at $404,710 in DFW, though year-over-year appreciation was slightly elevated at 11.7 percent.
NOTE: Data may not match previously published numbers due to revisions.
About Dallas–Fort Worth Economic Indicators
Questions or suggestions can be addressed to Laila Assanie at laila.assanie@dal.frb.org. Dallas–Fort Worth Economic Indicators is published every month after state and metro employment data are released.