Dallas-Fort Worth Economic Indicators

April 4, 2023
| DFW economy dashboard (February 2023) | |||
| Job growth (annualized) Nov. '22–Feb. '23 |
Unemployment rate |
Avg. hourly earnings |
Avg. hourly earnings growth y/y |
| 3.3% | 3.7% | $33.04 | 0.2% |
The Dallas–Fort Worth economy continued to expand in February. Payrolls grew, albeit at a slower pace than January, and unemployment increased. Home sales rose following several months of decline, and inventories ticked up despite the rebound in sales. Single-family permit issuance edged up.
Labor market
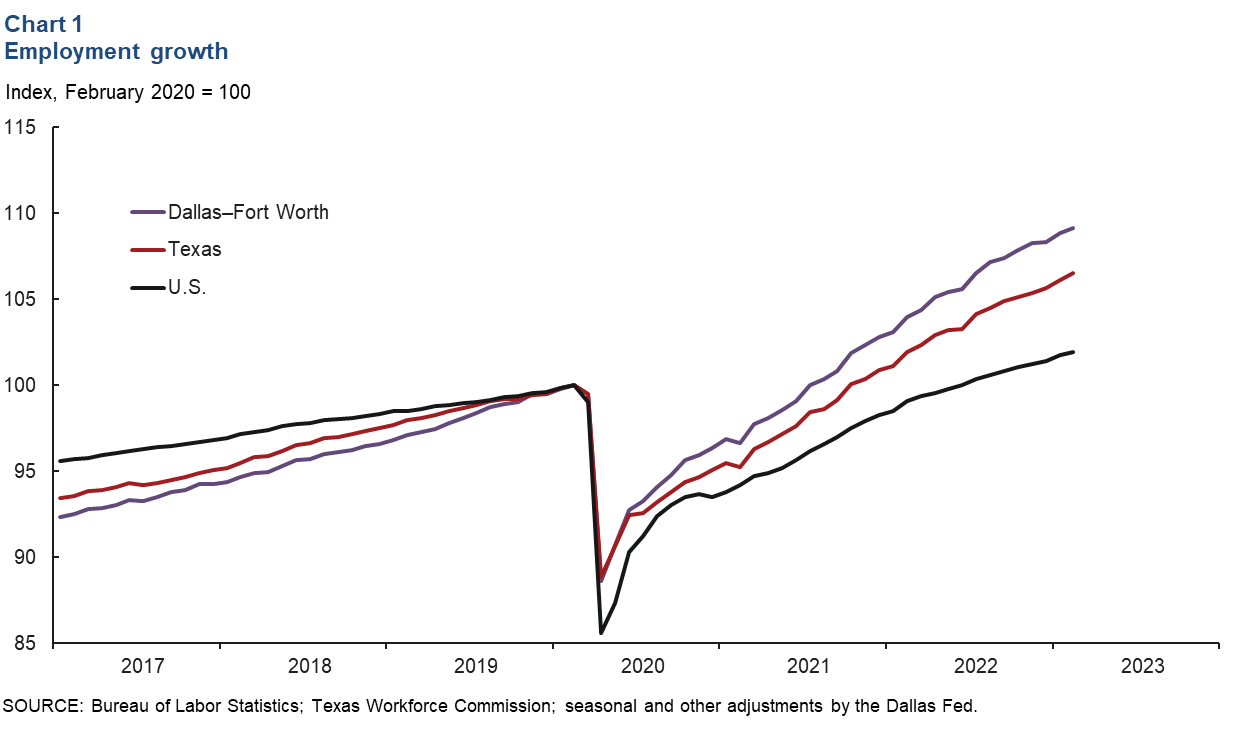
Job growth continues but moderates
DFW employment rose an annualized 3.5 percent in February, slower than January’s 6.2 percent increase. From November to February, payrolls in DFW rose an annualized 3.3 percent—their slowest three-month growth rate since February 2021. Job gains were broad based across sectors, though growth has eased notably in leisure and hospitality (0.3 percent) and financial activities (0.8 percent). Three years since the onset of the pandemic, DFW employment exceeded the February 2020 peak by 9.2 percent (353,400 jobs) (Chart 1). Employment in the Dallas–Plano–Irving metro division was 10.1 percent (277,600) above prepandemic levels, and the Fort Worth–Arlington division’s employment was 6.8 percent (75,800) higher than prepandemic levels. Payrolls in Texas and the U.S. were 6.5 percent and 2.0 percent higher, respectively, than their prepandemic highs.
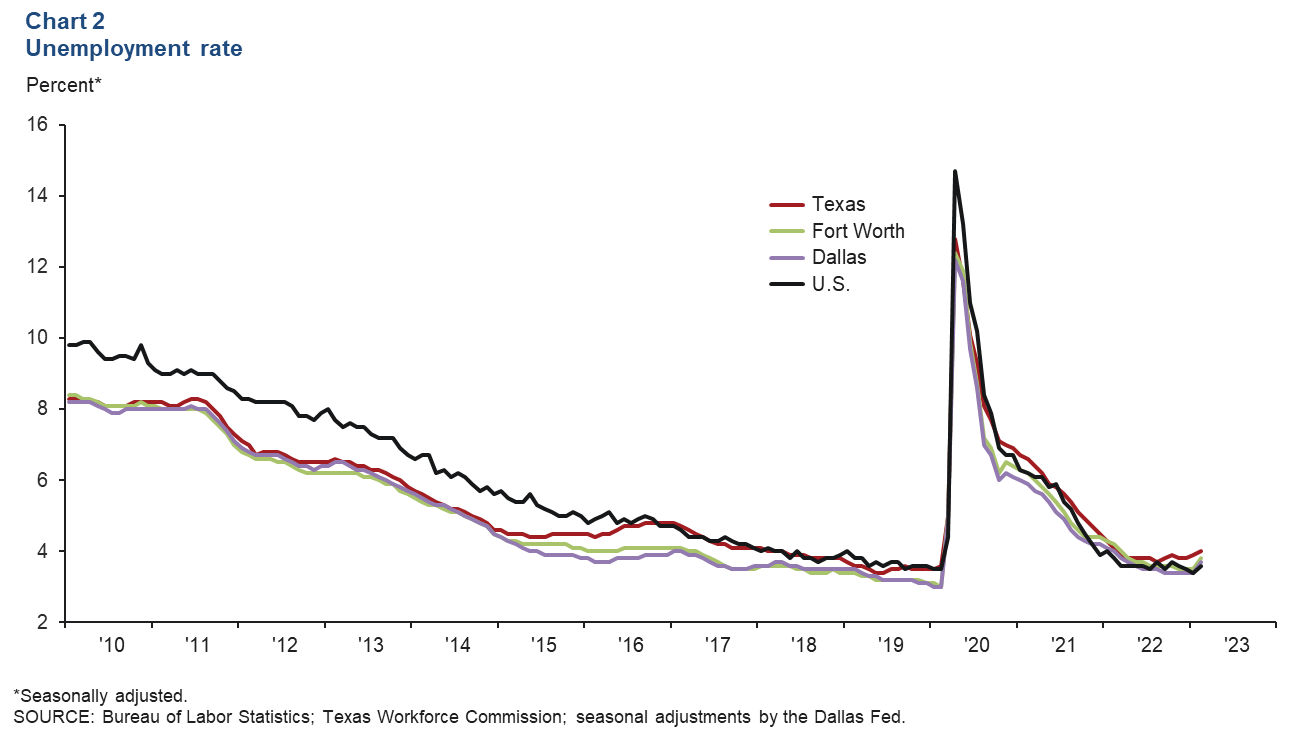
Unemployment ticks up
The DFW labor market continued to be tight, though unemployment edged up in February. The unemployment rate rose to 3.7 percent in Dallas and 3.8 percent in Fort Worth—the first increase since November 2020 (Chart 2). The jobless rate in Texas edged up to 4.0 percent in February, and in the U.S., it rose to 3.6 percent. The labor force expanded an annualized 7.6 percent in Dallas. Fort Worth’s 5.6 percent labor force increase was in line with the state’s 5.4 percent rise.
Housing
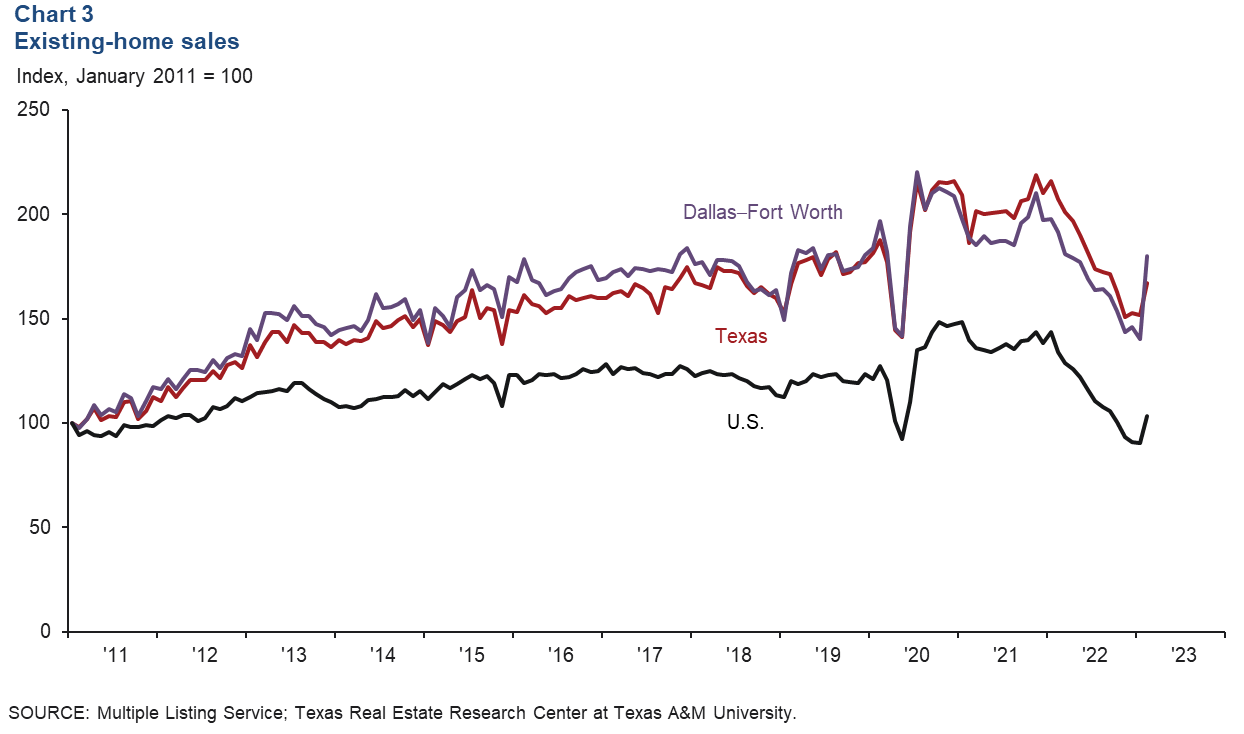
Existing-home sales rebound
Activity in the housing market improved. DFW existing-home sales climbed at a double-digit pace in February (Chart 3). Statewide, sales rose sharply, up 9.9 percent, and they rebounded strongly in the nation as well. Relatively stable home prices and the recent dip in mortgage rates are helping drive demand. According to business contacts, buyer traffic has picked up, and sales of new homes have improved. Contract cancellations have slowed, and incentives remain generally widespread, including rate buy-downs and price reductions.
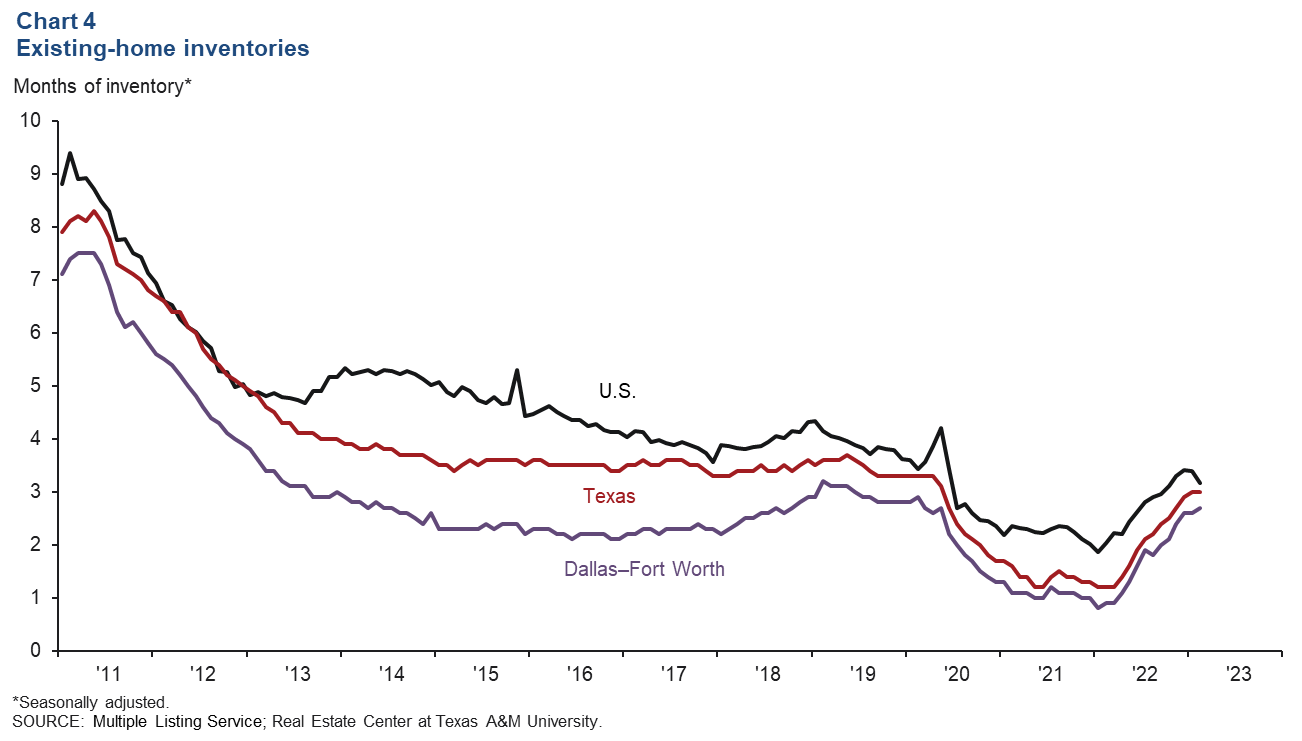
Home inventories steadily increasing
DFW home inventories edged up in February, even with an increase in sales. Existing-home inventories ticked up to 2.7 months in DFW but were flat in Texas at 3.0 months and dipped to 3.2 months in the U.S. (Chart 4). Inventories in the metroplex, state and nation remain tight and below the six-month benchmark for a normal market.
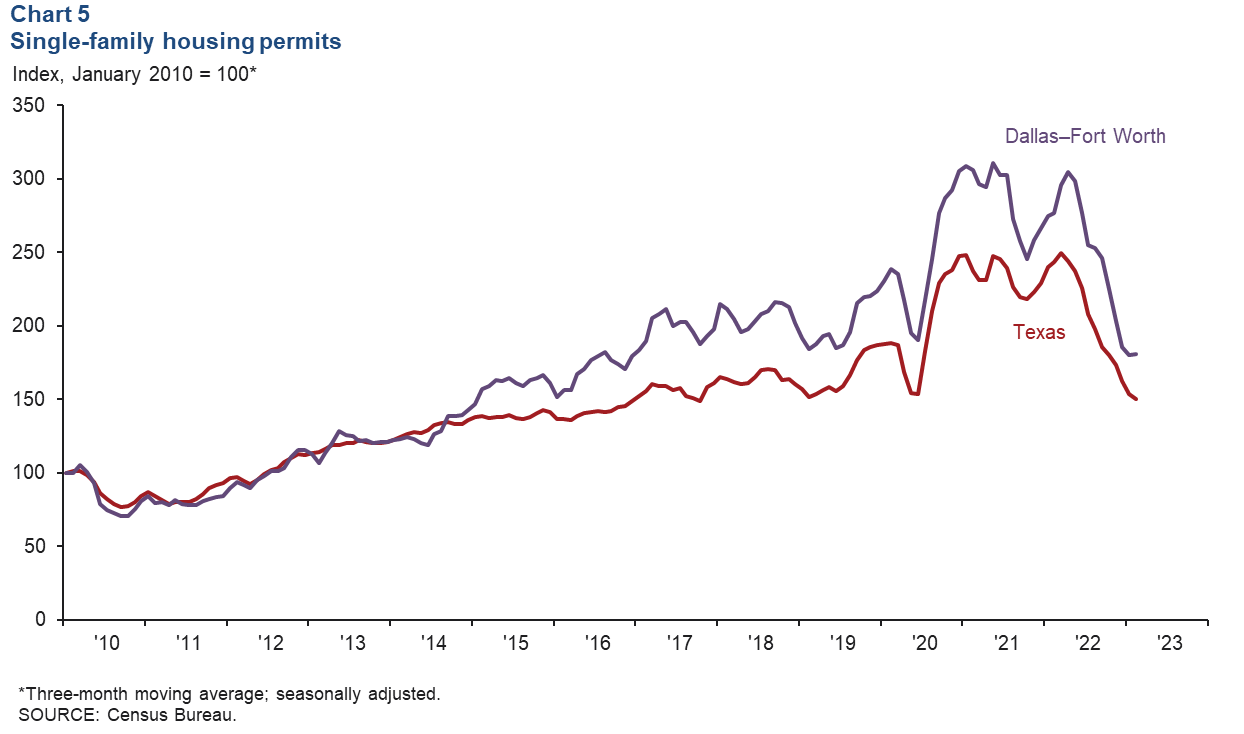
Single-family permits rise
Single-family permit issuance, which leads home construction, rose in February following several months of decline. Permit issuance climbed 18.5 percent in DFW and 8.7 percent in Texas. The three-month moving average of single-family permits edged up 0.5 percent in DFW but dipped further in Texas (Chart 5). Despite the pickup in February, single-family permit issuance was down 30.8 percent in DFW and 34.5 percent in Texas from year-ago levels.
NOTE: Data may not match previously published numbers due to revisions.
About Dallas–Fort Worth Economic Indicators
Questions or suggestions can be addressed to Laila Assanie at laila.assanie@dal.frb.org. Dallas–Fort Worth Economic Indicators is published every month after state and metro employment data are released.