Dallas-Fort Worth Economic Indicators

| DFW economy dashboard (May 2023) | |||
| Job growth (annualized) Feb.–May '23 |
Unemployment rate |
Avg. hourly earnings |
Avg. hourly earnings growth y/y |
| 1.9% | 3.8% | $33.77 | 1.4% |
The Dallas–Fort Worth economy expanded in May. Employment growth continued but slowed from April’s brisk pace. Average hourly earnings fell but remained above year-ago levels. Home sales and single-family housing permits rose, while inventories dipped.
Labor market
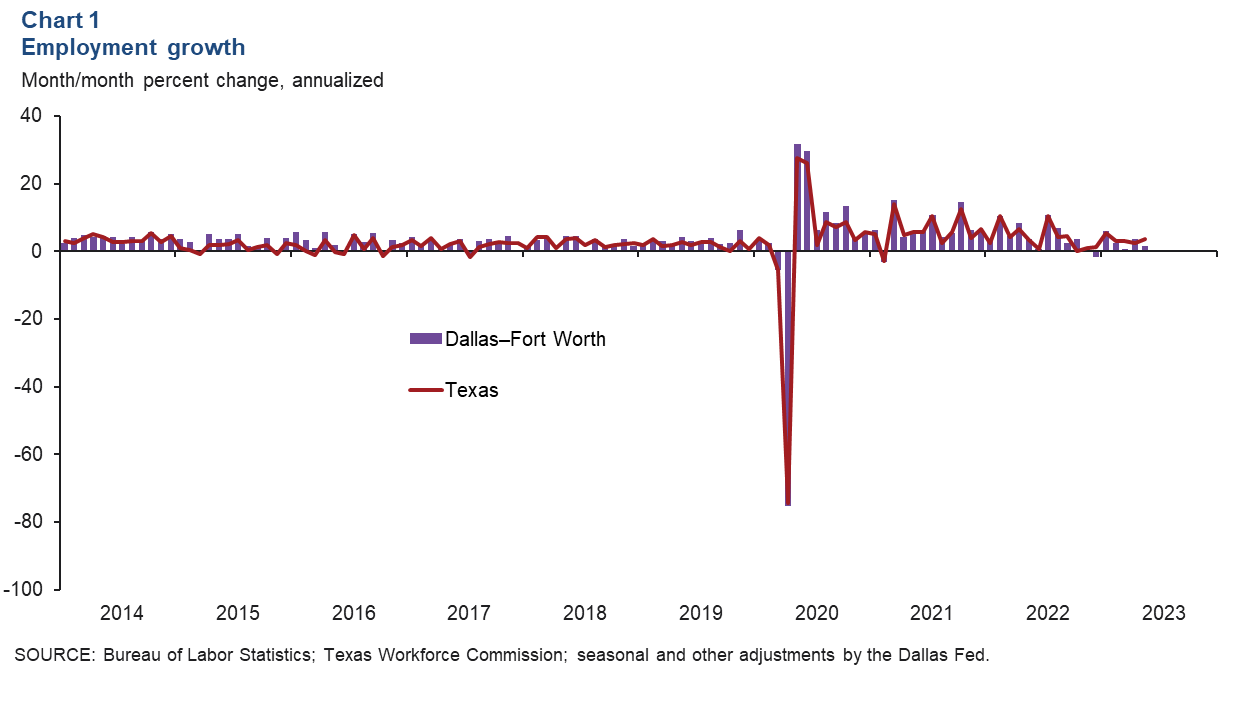
Job growth moderates
DFW job growth slowed to an annualized 1.6 percent (5,500 jobs) in May from 3.6 percent in April (Chart 1). Meanwhile, Texas payrolls rose 3.6 percent in May. In the three months through May, DFW employment was up an annualized 1.9 percent, below its trend growth rate and slower than the state’s 3.1 percent annualized increase. Job gains were mixed during this period. Payrolls contracted in construction and mining and in trade, transportation and utilities—the metro’s largest employment sector. Growth was modest—at or below an annualized 2 percent—in manufacturing, leisure and hospitality, and professional and business services. The DFW unemployment rate ticked up to 3.8 percent in May but was below the jobless rate in the state.
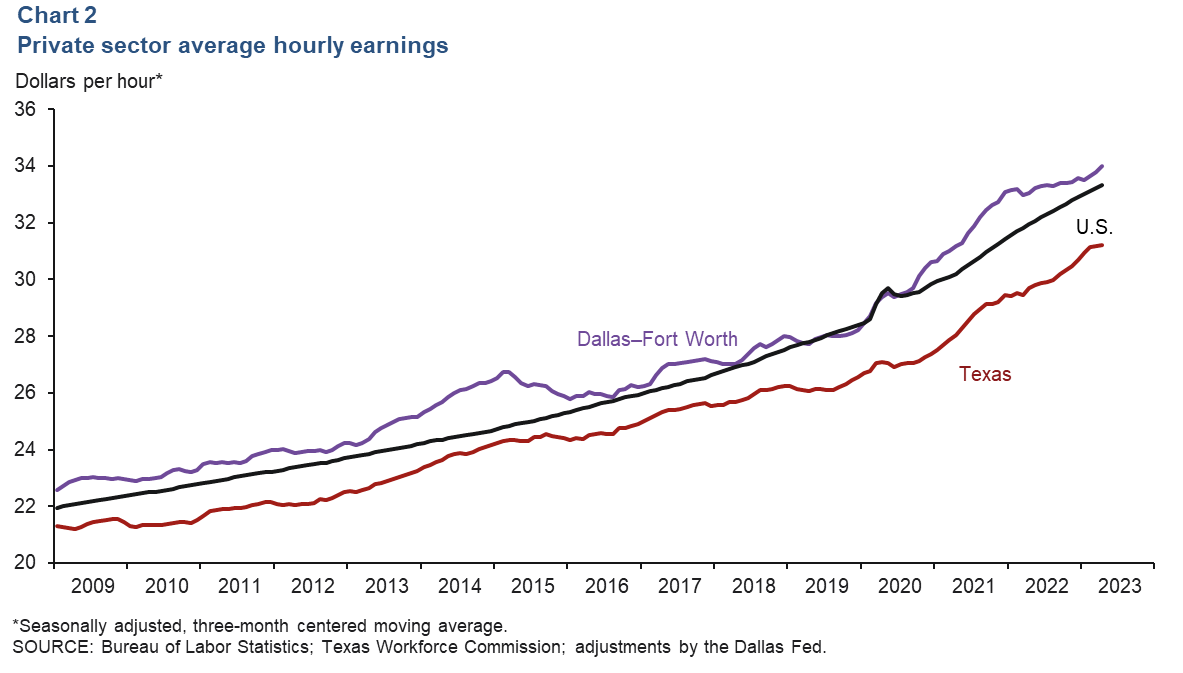
Hourly wages dip
DFW private hourly earnings were $33.77 in May, below April’s figure of $34.40. The three-month moving average of hourly earnings ticked up to $33.99 and remained above both the state average of $31.21 and the national average of $33.32 (Chart 2). In the past year, DFW’s wages have increased 1.4 percent—less than gains of 4.2 percent in Texas and 4.3 percent in the U.S.
Housing
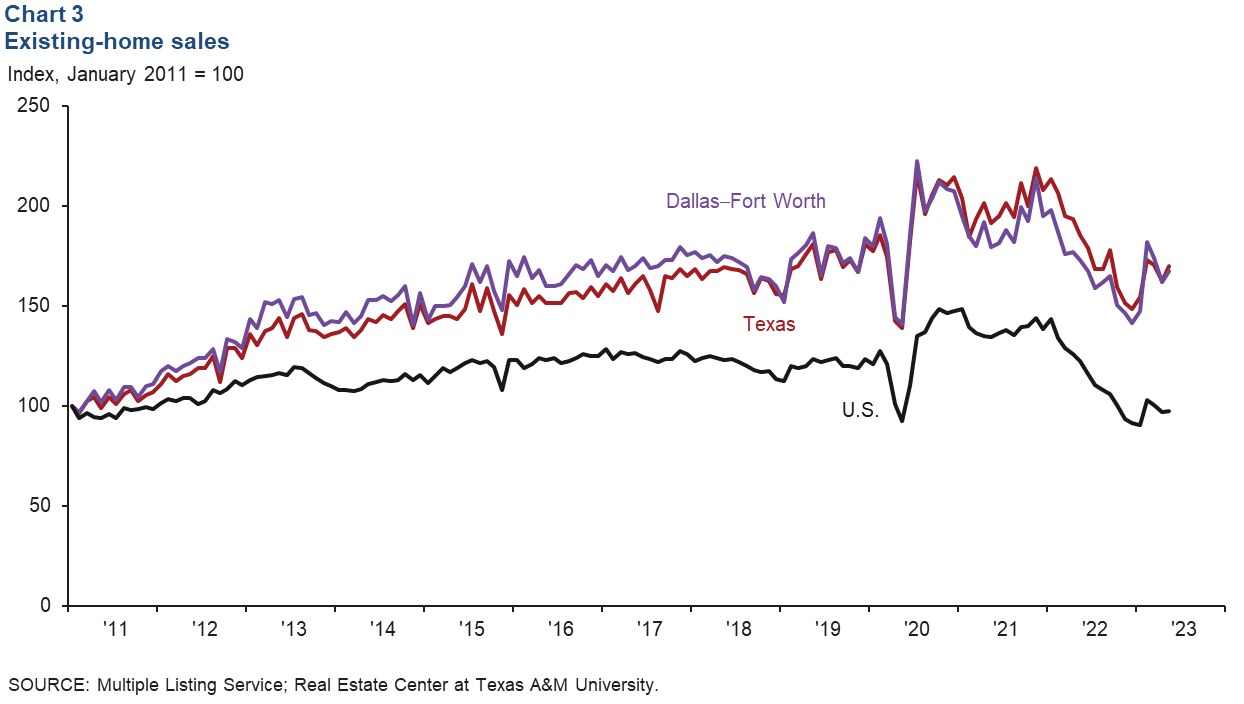
Existing-home sales rise
Activity in the housing market improved. DFW existing-home sales rose 3.5 percent in May following declines in the previous two months (Chart 3). Statewide sales were up 4.7 percent, while sales were flat nationally. Relatively stable home prices and mortgage rates are helping drive demand. According to business contacts, buyer traffic has held up, and demand for new homes is solid, particularly for speculative homes. Prices are flat, and incentives such as rate buydowns continue to be offered.
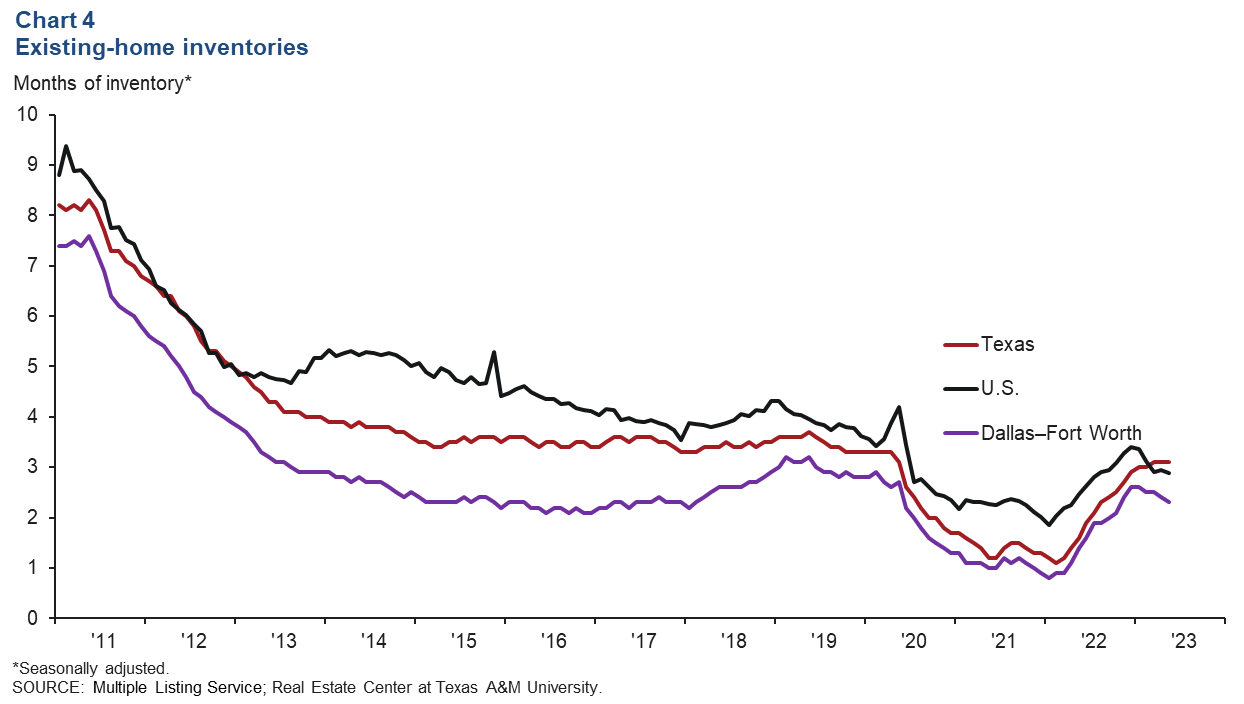
Home inventories stay low
DFW home inventories dipped in May as sales rose. Existing-home inventories edged down to 2.3 months in DFW but were flat in Texas at 3.1 months and slipped to 2.9 months in the U.S. (Chart 4). Inventories in the metroplex, state and nation remain tight and below the six-month benchmark for a normal market, in part because many homeowners were able to lock in record-low mortgage rates prior to the recent surge in interest rates.
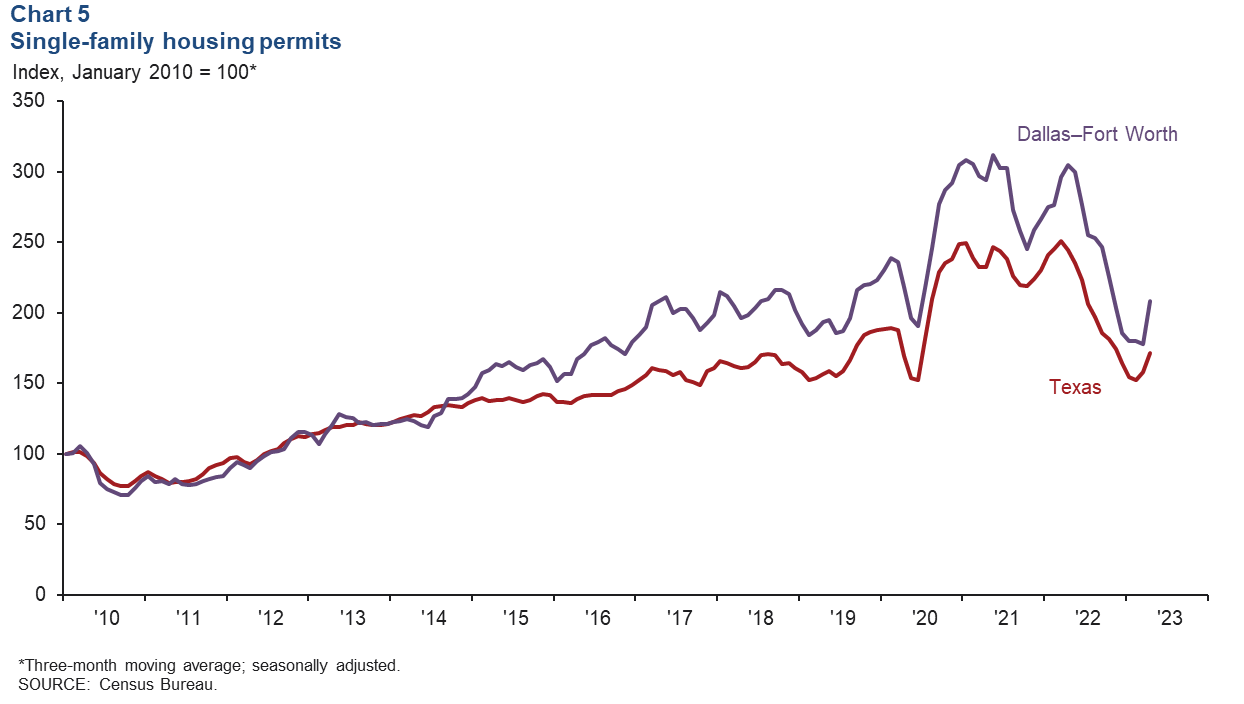
Single-family permits surge
Single-family permit issuance, which leads home construction, climbed 38.6 percent in DFW in May. The three-month moving average of single-family permits rose 17.0 percent in DFW and 8.9 percent in Texas (Chart 5). Despite the pickup, single-family permit issuance in May was down 18.0 percent in DFW and 21.9 percent in Texas from year-ago levels.
NOTE: Data may not match previously published numbers due to revisions.
About Dallas–Fort Worth Economic Indicators
Questions or suggestions can be addressed to Laila Assanie at laila.assanie@dal.frb.org. Dallas–Fort Worth Economic Indicators is published every month after state and metro employment data are released.