Dallas-Fort Worth Economic Indicators
| DFW economy dashboard (July 2023) | |||
Job growth (annualized)
April–July '23 |
Unemployment rate |
Avg. hourly earnings |
Avg. hourly earnings growth y/y |
4.7% |
4.2% | $34.92 | 5.0% |
The Dallas–Fort Worth economy expanded in July. Payroll employment grew, but unemployment ticked up as more workers joined the labor force. The DFW retail sales tax collections—a proxy for consumer spending in the metropolitan statistical area—increased in July, outpacing the state.
Labor market
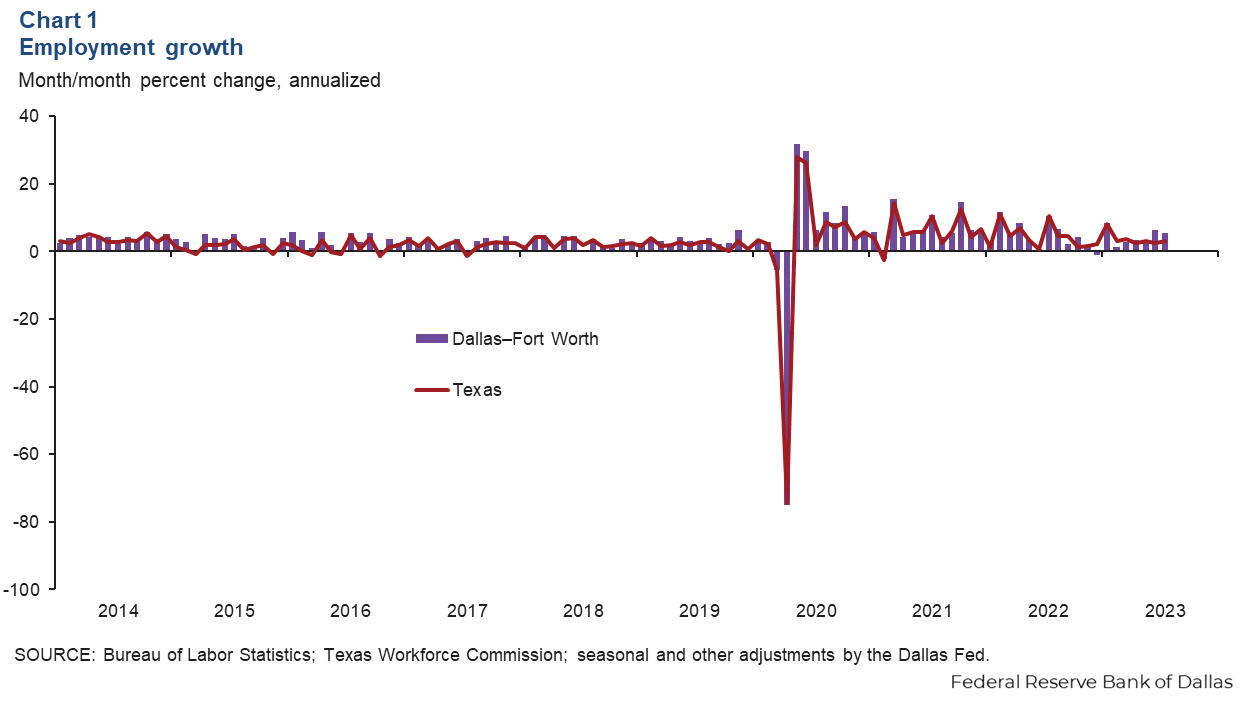
Job growth still strong in July
DFW jobs grew an annualized 5.5 percent in July, down from June’s 6.2 percent growth, but greater than Texas’ 3.0 percent increase (Chart 1). Year over year, DFW employment rose 3.6 percent, higher than the state’s 3.3 percent rise and the nation’s 3.2 percent increase.
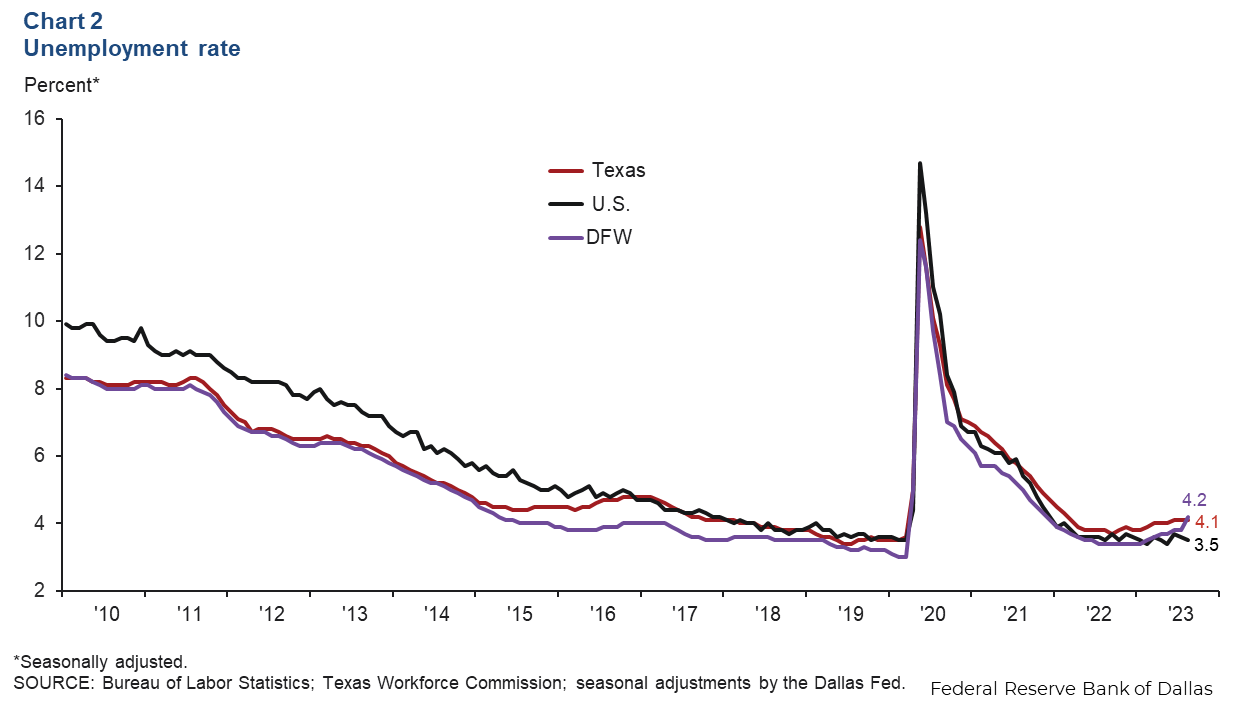
DFW unemployment rises
DFW’s unemployment rate increased to 4.2 percent in July, slightly higher than the state’s jobless rate of 4.1 percent (Chart 2). However, the area’s increase was largely driven by growth in the civilian labor force. In July, the labor force grew by an annualized 10.9 percent, much greater than June’s increase of 3.1 percent. The increase in the labor force is a sign that workers expect continued expansion in the metro.
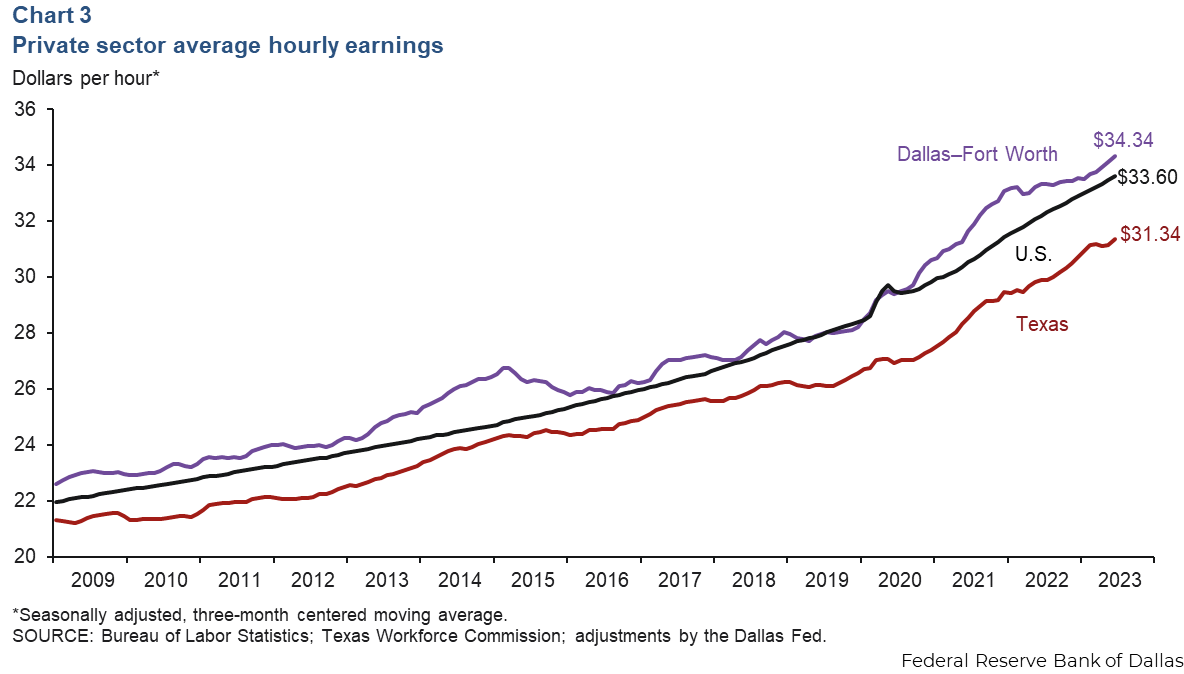
Hourly wages tick up
DFW average private hourly earnings were $34.92 in July, up from June’s figure of $32.92. The three-month moving average for hourly earnings edged up to $34.34 and remained above both the state average of $31.34 and the national average of $33.60 (Chart 3). In the past year, average wages in DFW have increased 5.0 percent, greater than gains of 4.4 percent in the U.S. but less than the 6.5 percent increase in Texas.
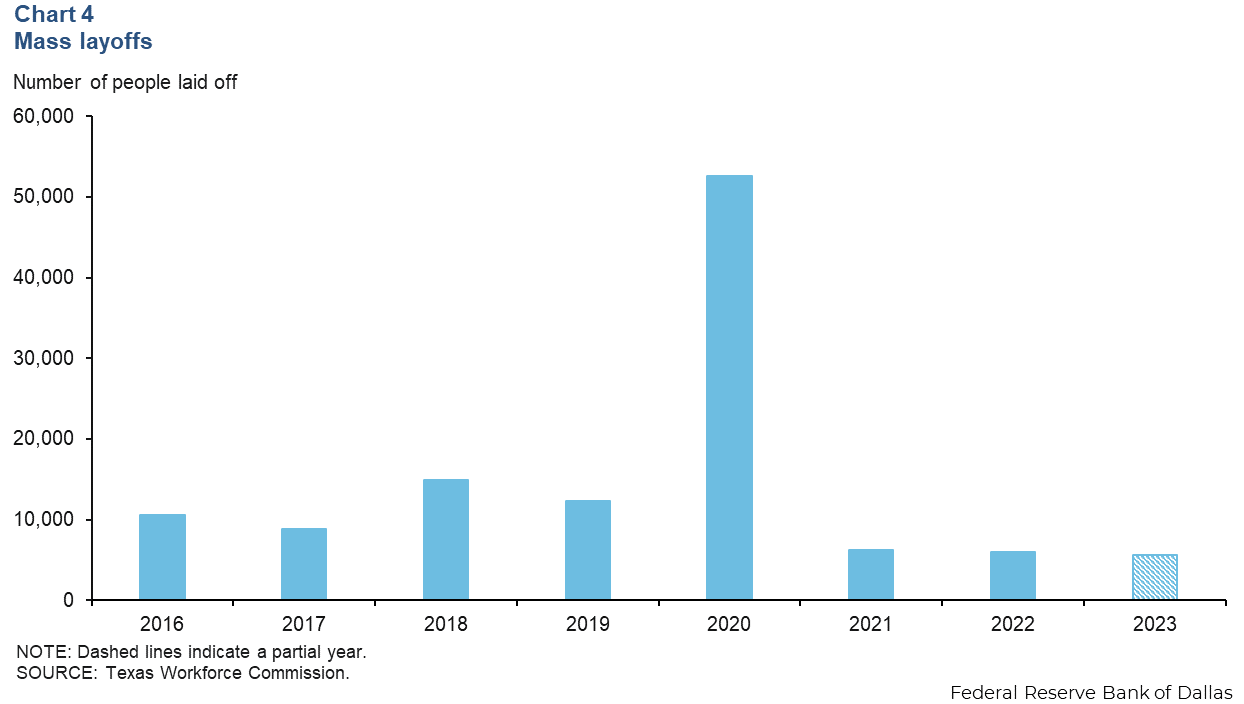
Mass layoffs continue in August
As of Aug. 21, 5,575 workers in the DFW metroplex were laid off under the Worker Adjustment and Retraining Notification (WARN) Act—accounting for 38.9 percent of all layoffs in Texas year to date . If the current trend persists, WARN layoffs in DFW are on track to exceed levels seen in the past two years, but they would still be below prepandemic levels (Chart 4 ).
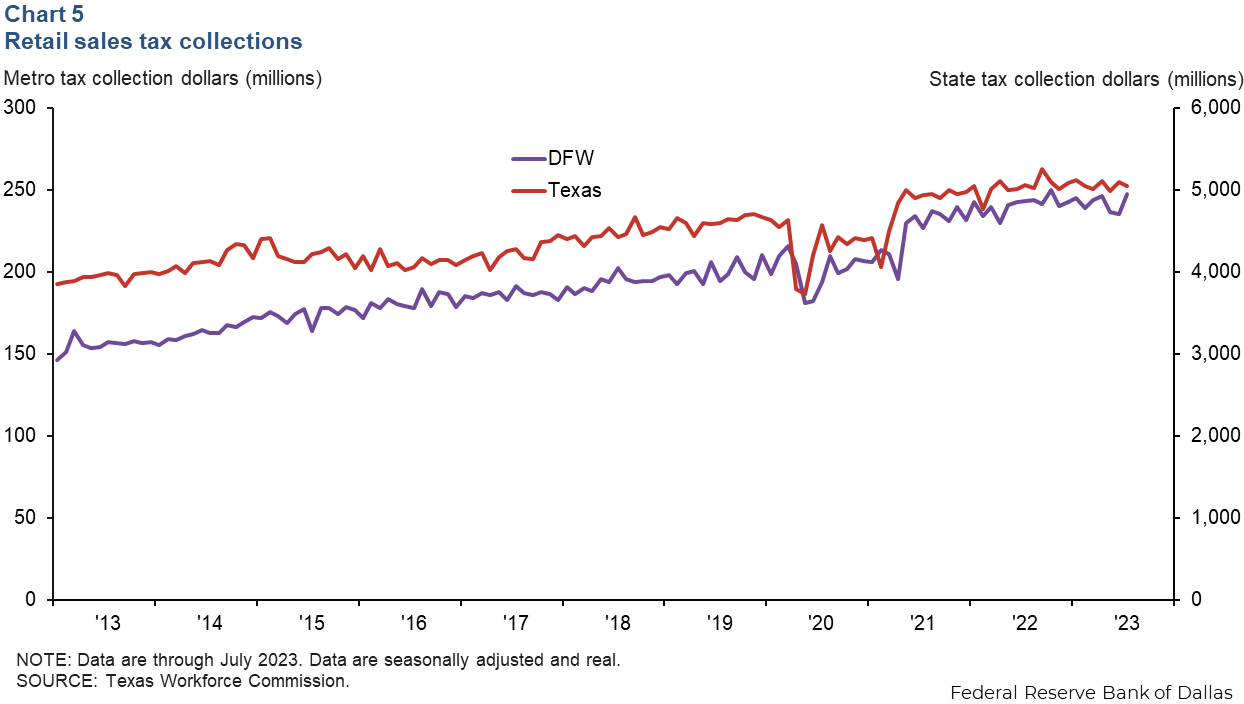
Retail sales tax collections
In July, real and seasonally adjusted DFW retail sales tax collections increased by 5.4 percent, outpacing the state’s collections, which declined 0.9 percent (Chart 5 ). Year over year, the metro retail sales tax collections grew 1.9 percent, contrasting Texas’ collections, which fell 0.2 percent.
NOTE: Data may not match previously published numbers due to revisions.
About Dallas–Fort Worth Economic Indicators
Questions or suggestions can be addressed to Laila Assanie at laila.assanie@dal.frb.org. Dallas–Fort Worth Economic Indicators is published every month after state and metro employment data are released.