Dallas-Fort Worth Economic Indicators

| DFW economy dashboard (October 2023) | |||
Job growth (annualized)
July–Oct. '23 |
Unemployment rate |
Avg. hourly earnings |
Avg. hourly earnings growth y/y |
3.2% |
3.8% | $34.40 | 2.5% |
The Dallas–Fort Worth economy slowed in October. Payroll employment fell, while unemployment was little changed. Average hourly earnings ticked up and remained above year-ago levels. Home sales declined in October. House prices rose, and affordability dipped in the third quarter.
Labor market
Payrolls decline
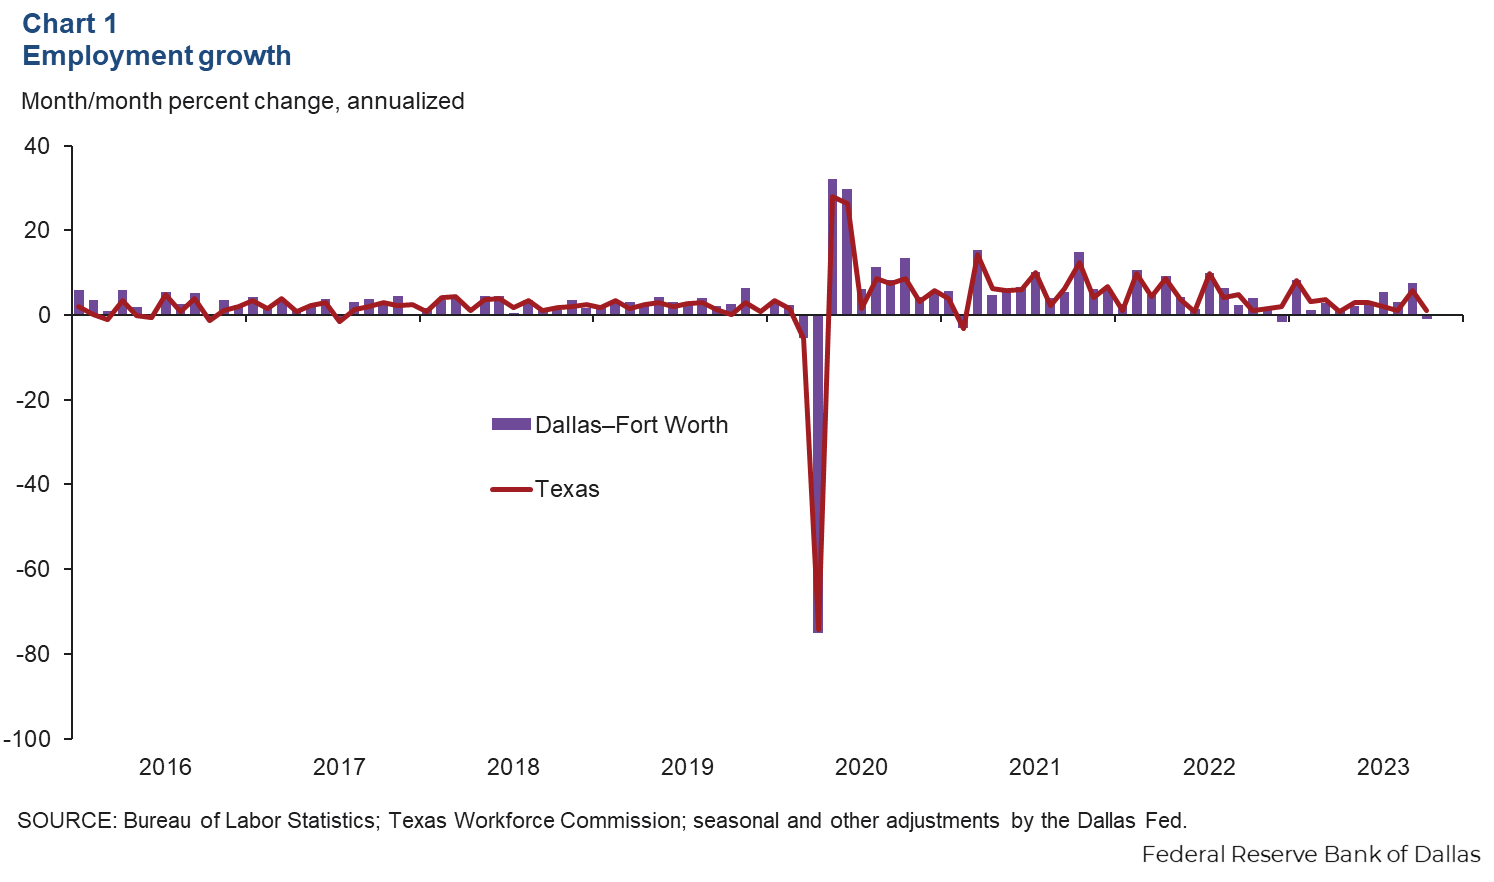
DFW job growth weakened in October. Payroll employment fell an annualized 1.0 percent (-3,650 jobs) in October following robust growth in prior months (Chart 1). Employment in Dallas was flat, while payrolls in Fort Worth dropped an annualized 4.2 percent, and Texas job growth slowed to an annualized 1.2 percent in October. In the three months through October, DFW employment was up an annualized 3.2 percent, above its trend growth rate and faster than the state’s 2.6 percent annualized increase. The DFW unemployment rate ticked down to 3.8 percent in October and remained below the state’s 4.1 percent jobless rate.
Hourly wages tick up
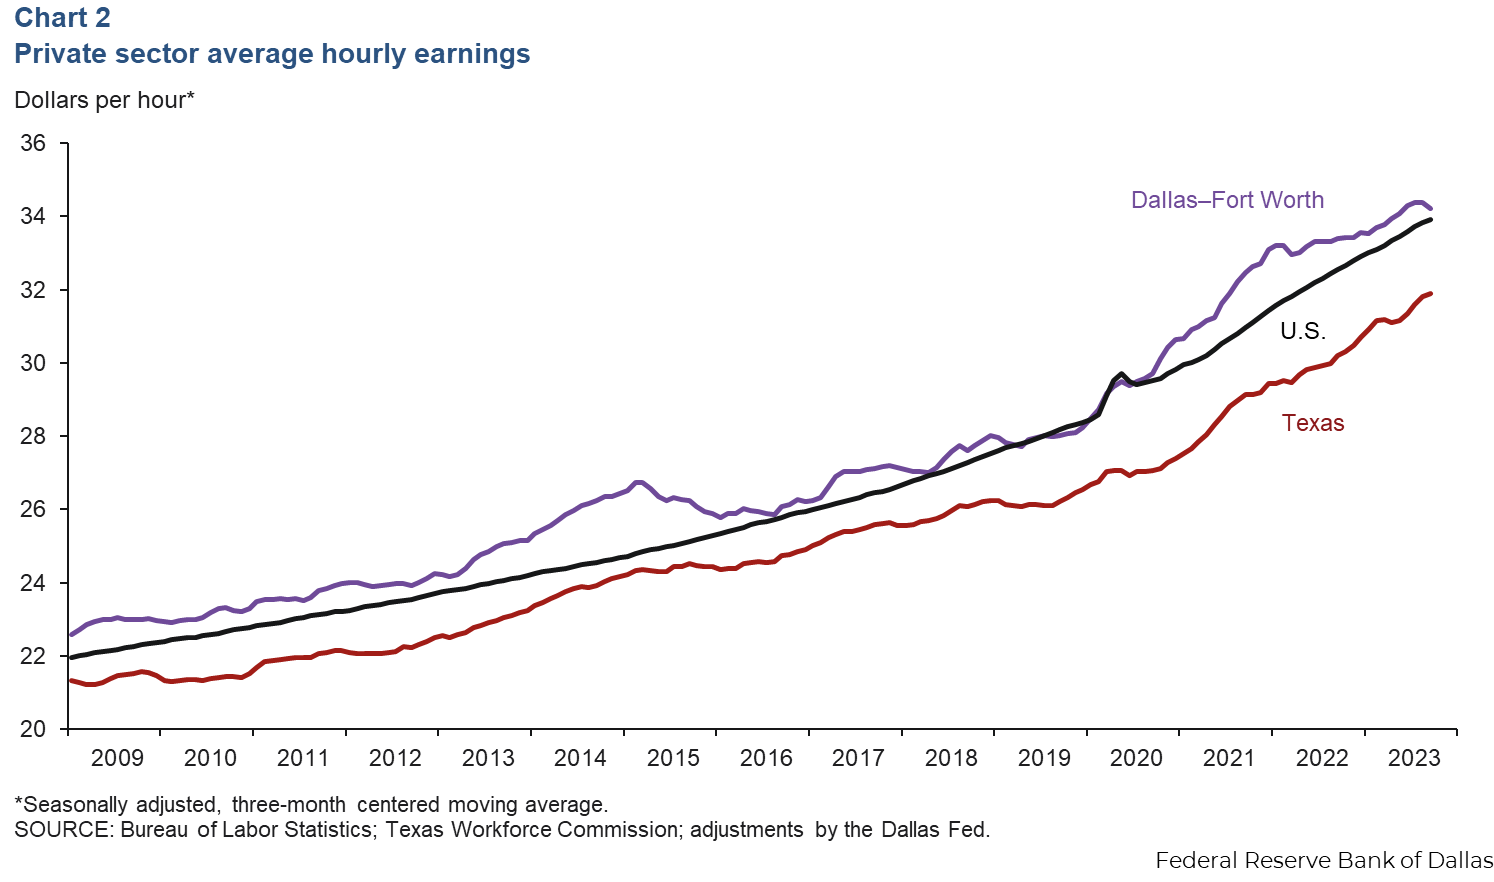
DFW average private hourly earnings edged up to $34.40 in October, up from September’s figure of $34.24. The three-month moving average for hourly earnings ticked up to $34.21 and remained above both the state average of $31.91 and the national average of $33.92 (Chart 2). In the past year, average wages in DFW have increased 2.5 percent, narrower than gains of 5.2 percent in Texas and 4.1 percent in the U.S.
Housing
Home prices rise
Home prices in DFW increased in the third quarter, according to recently released data from the Federal Housing Finance Agency. Compared with the second quarter, prices were up 2.3 percent in Dallas and 0.8 percent in Fort Worth. Prices rose 1.2 percent in Texas and 2.1 percent in the U.S. over the same period. Year over year, prices increased 1.1 percent in Fort Worth, 3.2 percent in Dallas and 2.7 percent in Texas, all slower than the nation’s 5.5 percent increase (Chart 3). Median home sales prices rose further in October to $397,500.

Affordability remains low
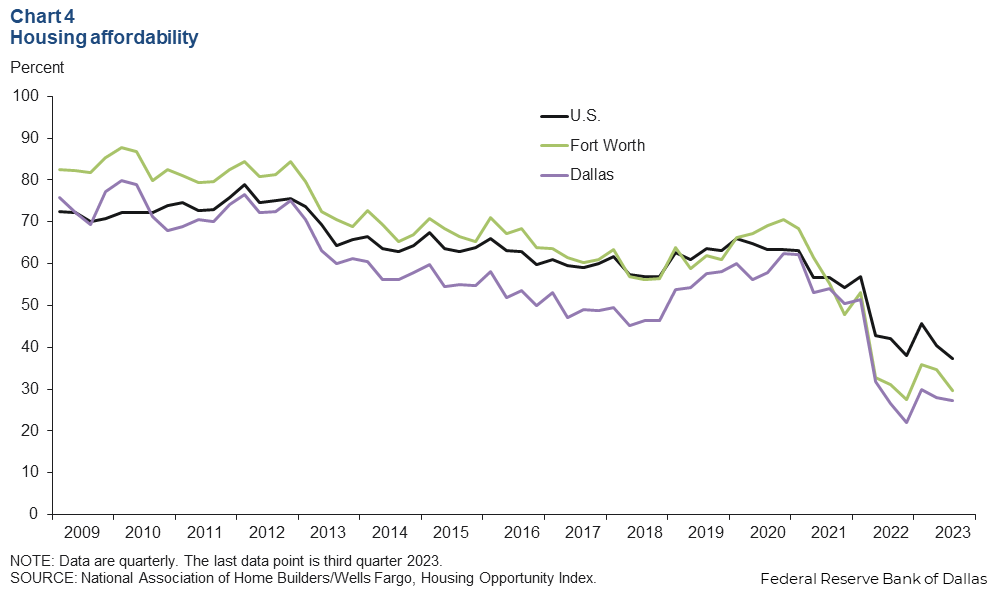
Housing affordability fell in the third quarter due to a combination of high home prices and mortgage rates (Chart 4). In Dallas, the share of homes sold that the median-income household could afford dipped from 28.1 percent in the second quarter to 27.3 percent in the third. Affordability in Fort Worth dropped 5.1 percentage points to 29.7 percent in the third quarter. Affordability fell in the U.S. as well last quarter, down 3.1 percentage points to 37.4 percent. Affordability in DFW is well below the national average as well as below Houston’s and San Antonio’s averages.
Existing-home sales decline
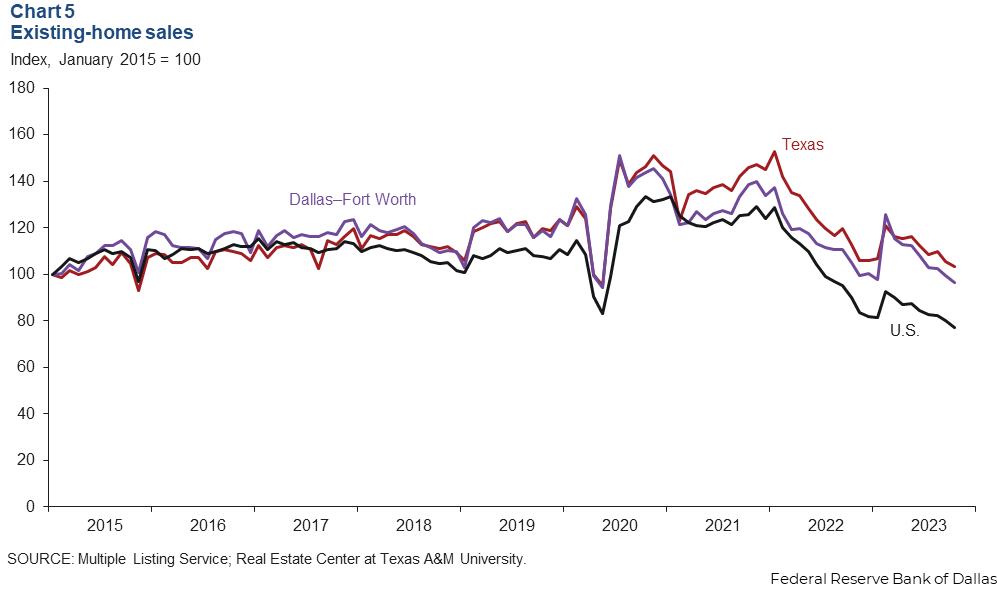
Housing demand weakened in October. DFW existing-home sales declined 2.9 percent—the eighth straight month of declines (Chart 5). Statewide, sales dropped 2.1 percent, while they fell 4.1 percent nationally. According to business contacts, mortgage rates eclipsing 8 percent in October dampened home sales, slowed buyer traffic and increased contract cancellations. Prices were flat to up, and incentives such as rate buydowns remained prevalent.
NOTE: Data may not match previously published numbers due to revisions.
About Dallas–Fort Worth Economic Indicators
Questions or suggestions can be addressed to Laila Assanie at laila.assanie@dal.frb.org. Dallas–Fort Worth Economic Indicators is published every month after state and metro employment data are released.