Dallas-Fort Worth Economic Indicators

| DFW economy dashboard (November 2023) | |||
Job growth (annualized)
Aug.–Nov. '23 |
Unemployment rate |
Avg. hourly earnings |
Avg. hourly earnings growth y/y |
2.4% |
3.8% | $33.85 | 1.2% |
The Dallas–Fort Worth economy weakened in November. Payroll employment fell, while unemployment dipped. Retail sales tax collections and apartment demand rose in December, while single-family housing permits were relatively flat in November.
Labor market
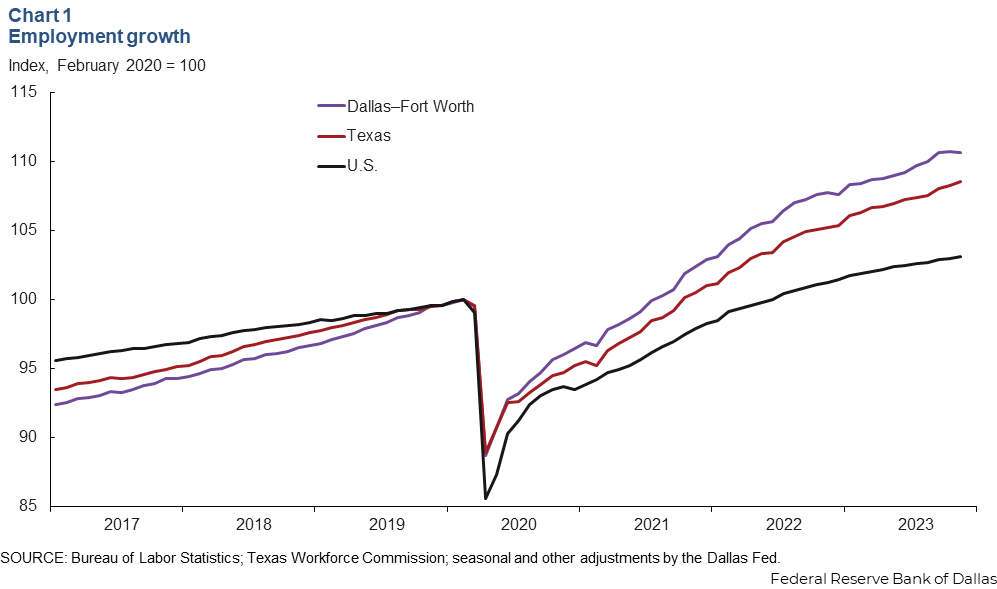
Payrolls shrink
DFW payroll employment fell an annualized 1.2 percent (-4,400 jobs) in November, though October job growth was revised up to 1.1 percent (Chart 1). In the three months through November, employment was up an annualized 2.4 percent in DFW—in line with its trend growth rate. Job gains were mostly broad based across sectors during this period, though government payrolls contracted, and growth was a sluggish 0.2 percent annualized in the metroplex’s largest employment sector—trade, transportation and utilities. Texas payrolls rose an annualized 3.8 percent in the three months ending in November, while U.S. employment increased 1.4 percent.
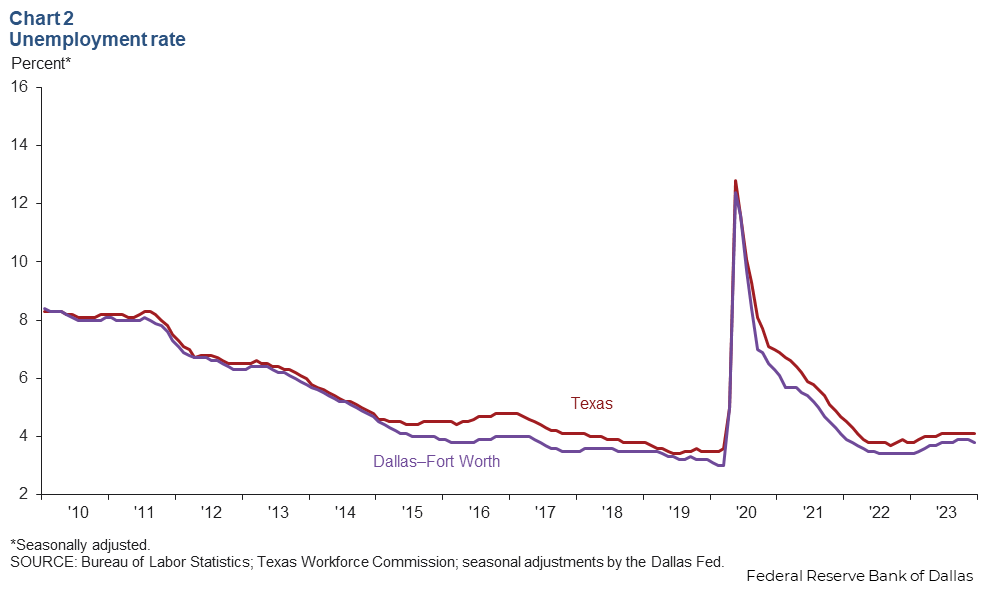
Unemployment dips
The DFW labor market continued to be tight. The DFW unemployment rate dipped to 3.8 percent in November, remaining below the state’s jobless rate of 4.1 percent (Chart 2). This decline in unemployment occurred despite the labor force expanding an annualized 3.5 percent in DFW from August through November—faster than the state’s 2.2 percent increase and the nation’s 0.7 percent rise.
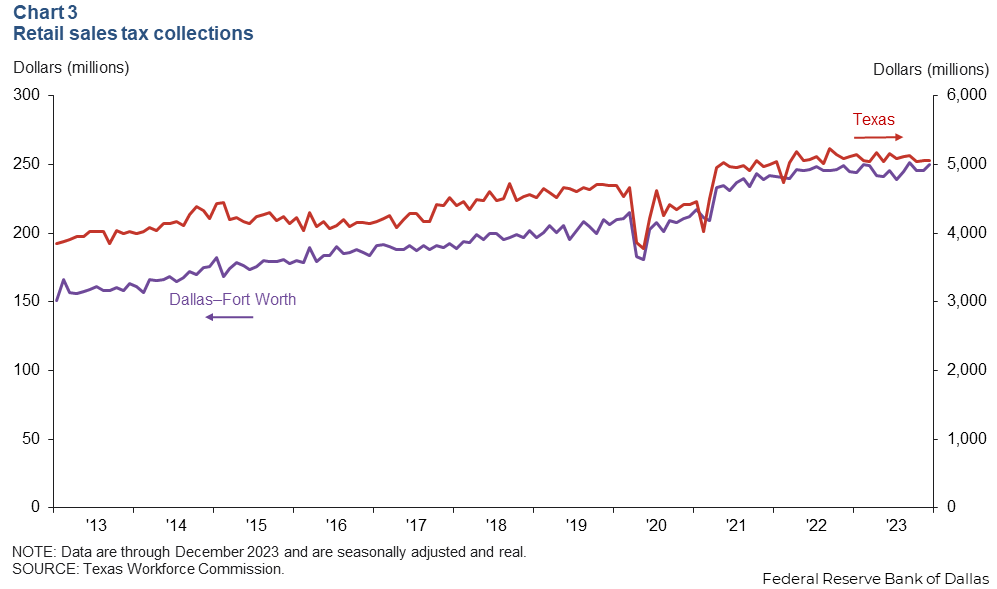
Retail sales tax collections
In December, DFW retail sales tax collections rose 1.8 percent to $250 million (Chart 3). Sales tax collections were up 1.6 percent in Dallas and 1.9 percent in Fort Worth in December. However, the state’s collections were essentially flat. In 2023, the region’s retail sales tax collections were up 0.3 percent from 2022 totals, and Texas’ collections rose 0.4 percent.
Construction and real estate
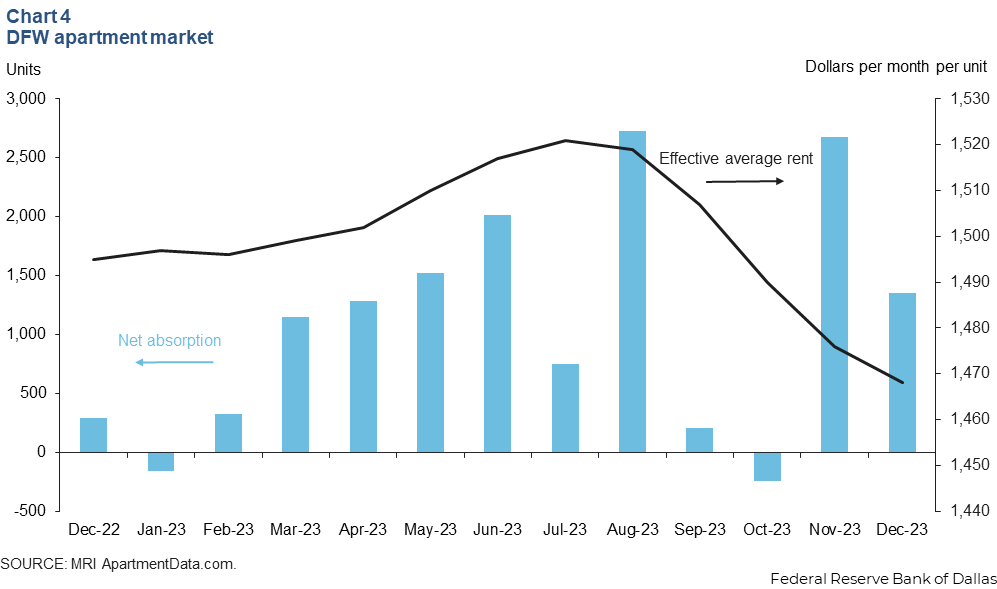
Apartment demand stays firm
DFW apartment absorption was solid at year-end. Net absorption was nearly 3,800 units from October through December following an increase of about 3,700 units from June through September (Chart 4). Even with demand holding up, effective monthly rents in DFW dipped to $1,468 per unit in December, down 1.8 percent from year-ago levels. Occupancy was stable at around 90.2 percent, and contacts note that while leasing activity is healthy, an elevated level of apartment completions is weighing down rent growth.
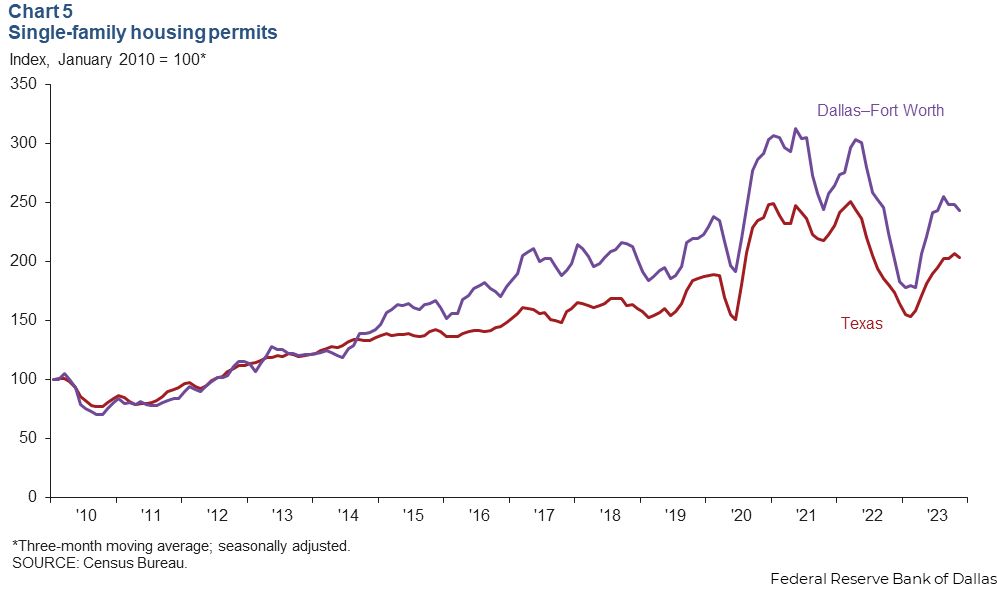
Single-family construction rises
Single-family permit issuance, which leads home construction, held steady in November. Permit issuance was up 0.4 percent in DFW but fell 2.2 percent in Texas. The three-month moving average of single-family permits dipped in DFW and the state (Chart 5). Despite the steady increase seen for most of 2023, single-family permit issuance through November was down 11.2 percent in DFW and 10.4 percent in Texas compared with the same period in 2022.
NOTE: Data may not match previously published numbers due to revisions.
About Dallas–Fort Worth Economic Indicators
Questions or suggestions can be addressed to Laila Assanie at laila.assanie@dal.frb.org. Dallas–Fort Worth Economic Indicators is published every month after state and metro employment data are released.