El Paso Economic Indicators

Moderate expansion continued in the El Paso economy, with job growth remaining mixed among sectors. Trade through the ports was down 7.3 percent in August from a year prior due to a decline in imports. September industrial production on both sides of the border slumped as U.S. auto sales fell.
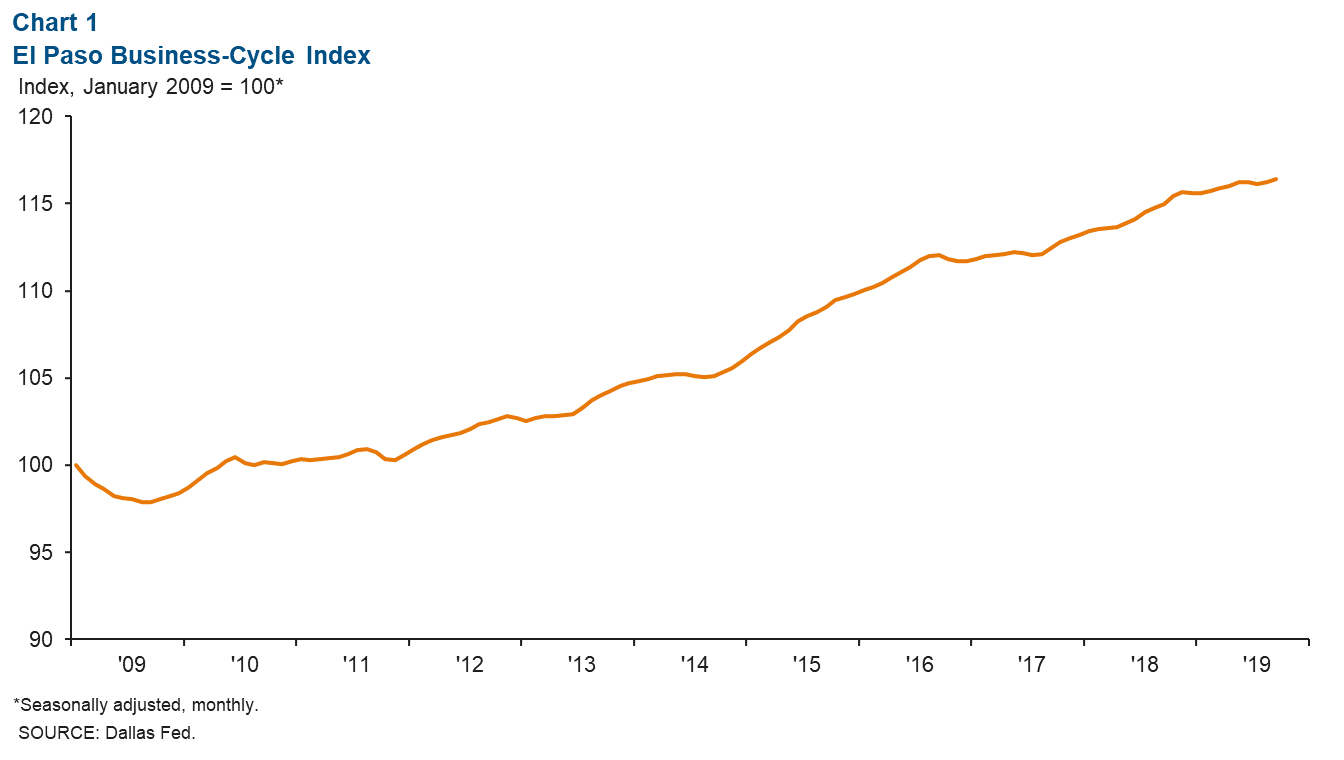
Business-Cycle Index
The El Paso Business-Cycle Index grew at a 1.7 percent annualized rate from August to September (Chart 1). Growth in the index is attributed to employment gains.
Labor Market
El Paso total nonfarm jobs rose by 2.0 percent in September (Chart 2). The trade, transportation and utilities, financial activities, and other services sectors posted declines in the month, which were offset by gains in other industries, especially construction and mining.
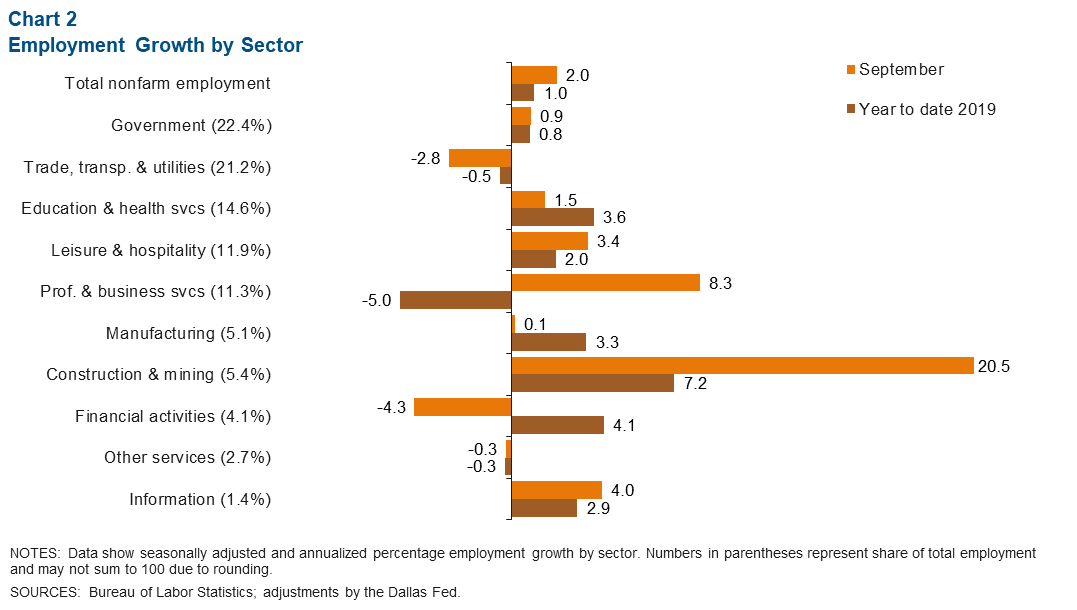
Year to date, El Paso employment is up 1.0 percent, or an addition of nearly 2,380 jobs. Most of the job gains have been in the educational and health services sector (1,270 jobs), while the majority of employment losses have occurred in the professional and business services sector (-1,380 jobs).
The El Paso unemployment rate remained at 3.8 percent from August to September. The Texas monthly unemployment rate also was unchanged at 3.4 percent for a fourth straight month, while the U.S. monthly unemployment rate hit a 50-year low of 3.5 percent.
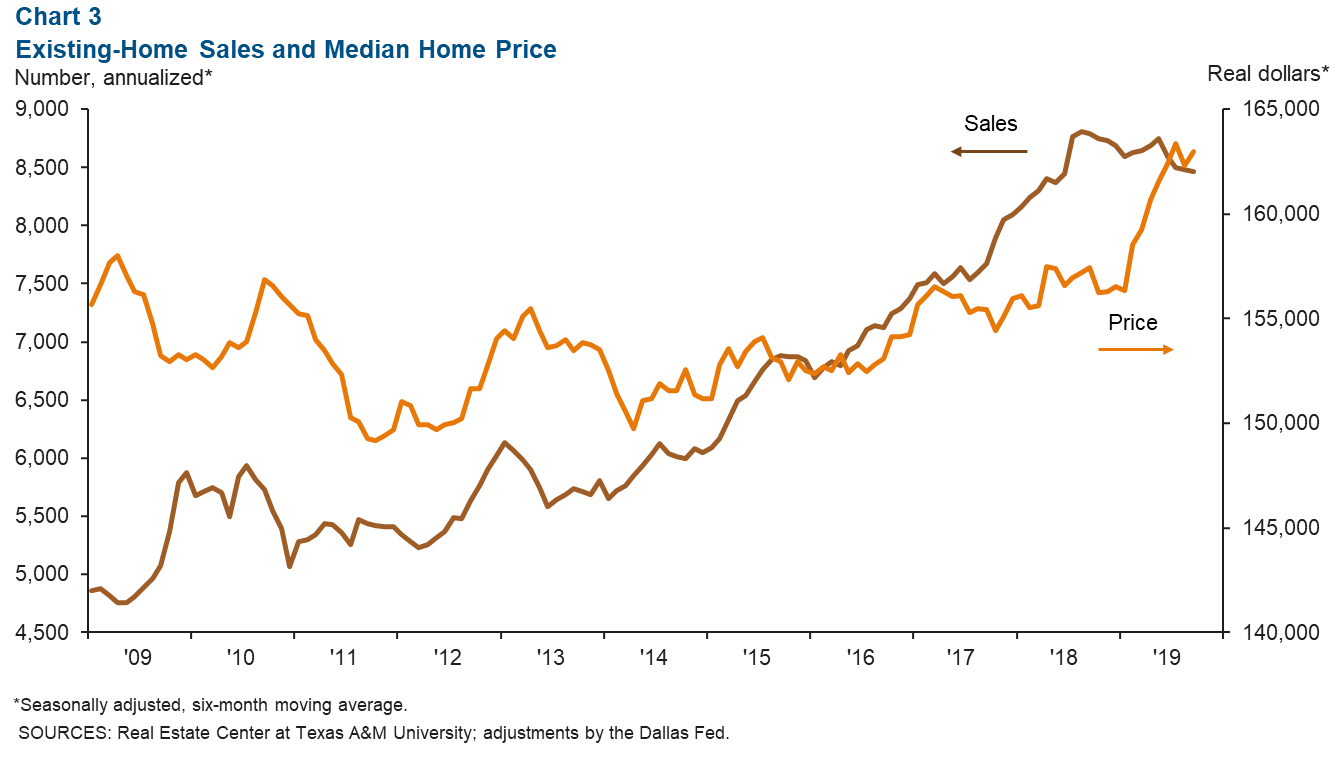
Housing Market
Year-over-year homes sales in El Paso fell for the third straight month in September to 8,464 units—a decrease of 3.7 percent (Chart 3). The median home price remained close to record highs at $162,969 in September. This represents an appreciation of 3.5 percent from September of last year. September housing inventories stood at 3.6 months, below the six months considered a balanced market.
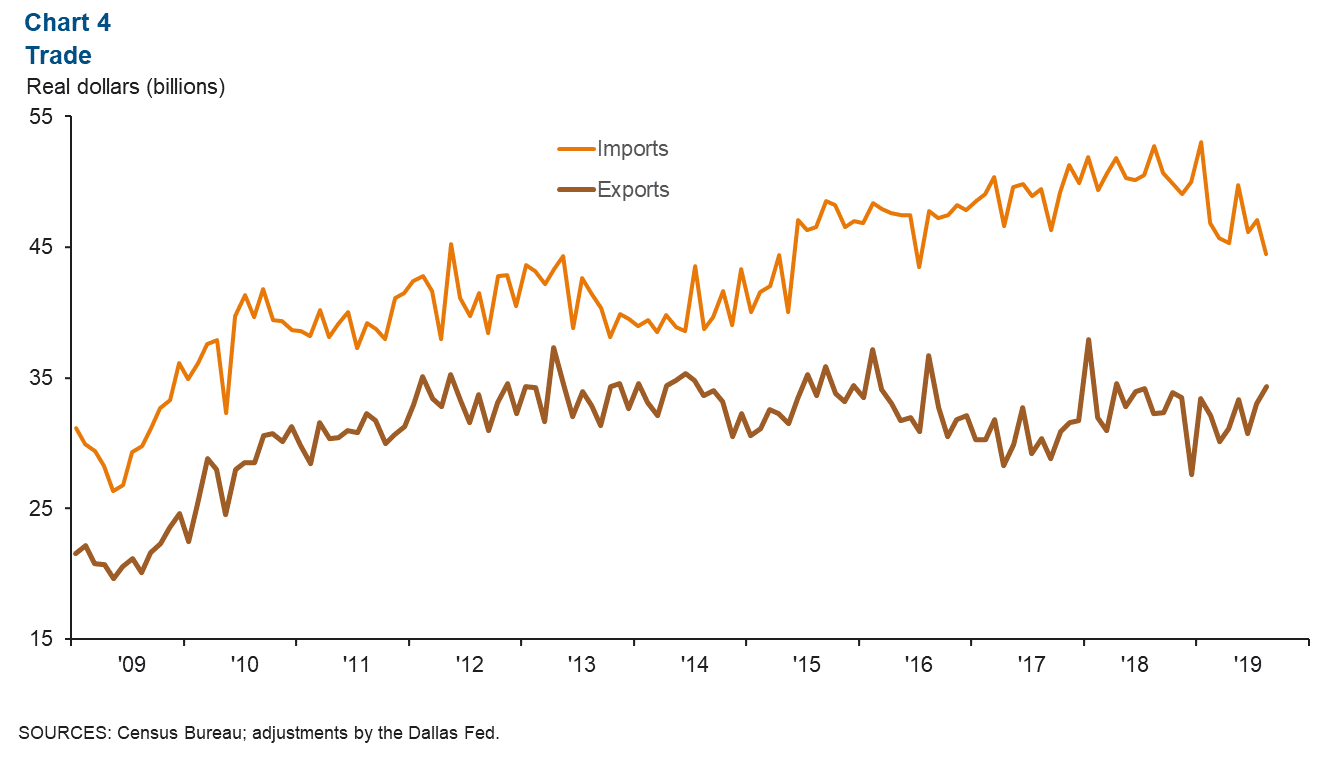
Trade
In August, annualized total trade (exports plus imports) amounted to $78.8 billion, down 1.7 percent from July (Chart 4). Imports contributed to this decline, decreasing 5.6 percent over this period, while exports rose 3.8 percent.
Industrial Production and Maquiladora Activity
U.S. industrial production contracted 0.1 percent year over year in September (Chart 5). This is the first negative reading for the industrial production index since November 2016. Mexico’s industrial production continued its 11-month decline, decreasing 1.0 percent in September from a year earlier. The U.S. Institute for Supply Management manufacturing index also decreased, from 49.1 in August to 47.8 in September. Reductions in the new orders index, production index and employment index contributed to this decline—primarily driven by a lack of demand. U.S. and Mexican production and manufacturing trends are important to the local economy because of cross-border manufacturing relationships.
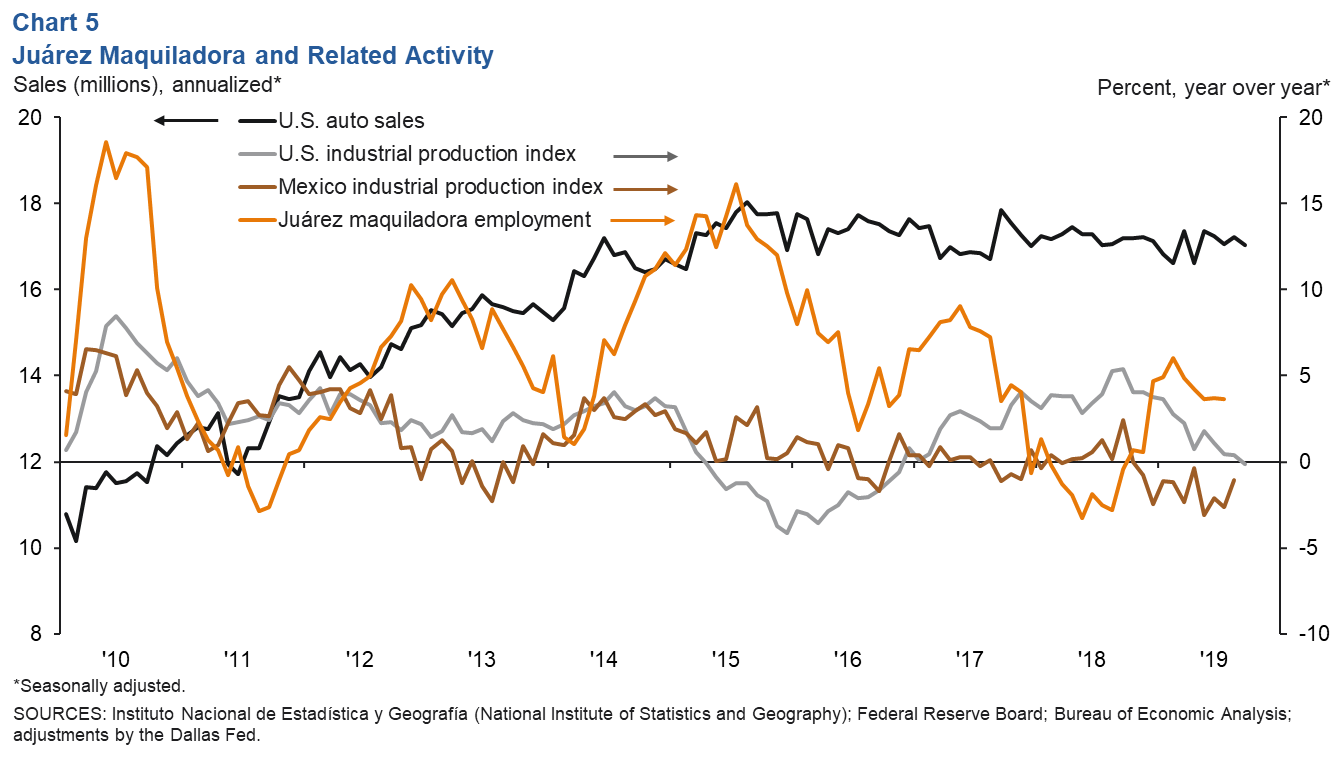
U.S. auto and light-truck production declined to 10.4 million units in September from 11.3 million a year earlier. U.S. auto sales also dropped by 0.8 percent from 17.2 million sold in September 2018 to 17.0 million in September 2019. Auto sales are closely linked to the local economy because roughly half of maquiladoras in Juárez are auto related.
NOTE: Data may not match previously published numbers due to revisions. The El Paso metropolitan statistical area includes El Paso and Hudspeth counties.
About El Paso Economic Indicators
Questions can be addressed to Keighton Allen at keighton.allen@dal.frb.org. El Paso Economic Indicators is released on the fourth Wednesday of every month.