Permian Basin Economic Indicators

The Permian Basin economy remains robust, reaching highs in production, employment and home prices. However, there are signs of moderation. Rig counts have stayed steady, while year-over-year growth in employment and oil production is decelerating.
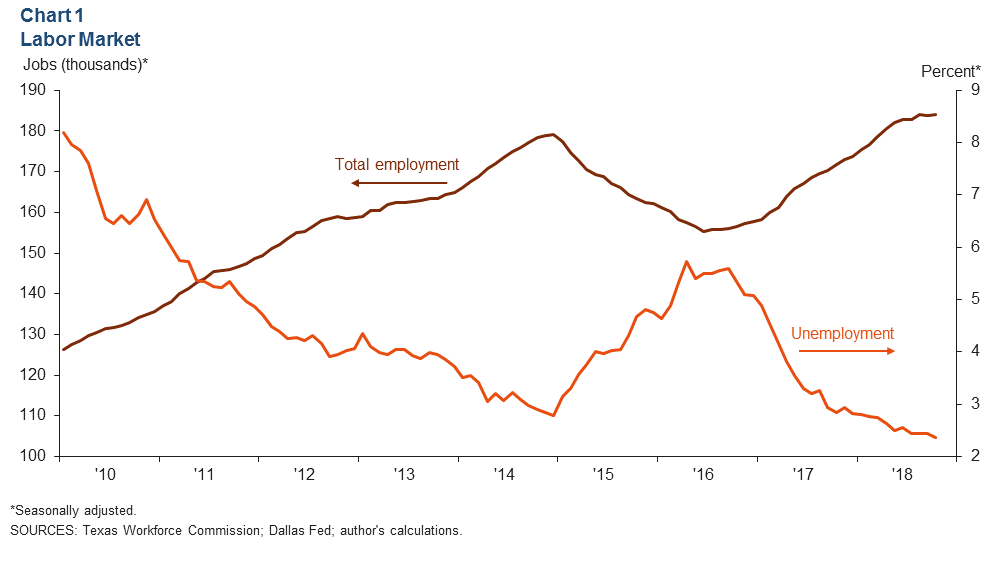
Labor Market
Permian Basin employment inched up to 184,100 between September and October, growing at a 1.4 percent monthly annualized rate (Chart 1). Despite this record-high level of employment, growth has slowed significantly in the second half of 2018 after expanding at an 11 percent annualized rate in the first half. A possible reason for the slowdown over the past few months is pipeline constraints. In the Dallas Fed's October 2018 Beige Book report, contacts reported that constraints in the Permian have held back growth in the rig count and demand for some production-related services. The Permian Basin's unemployment rate remained little changed for the fourth month in a row.
Energy
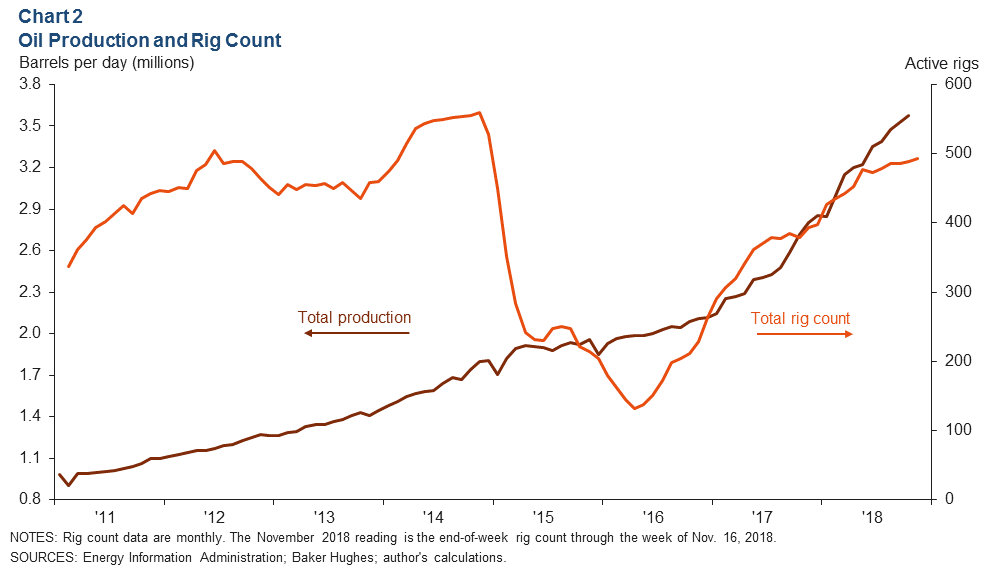
Oil Production Reaches Record Highs; Rig Count Still Subdued
Permian Basin oil production is estimated to have reached 3.58 million barrels per day in October, an increase of about 50,000 barrels from September (Chart 2). Production continues to set new highs in the Permian Basin, but the rig count has remained stable. The Permian Basin added just three rigs between August and October. The Permian's weekly rig count readings in November have shown further improvement.
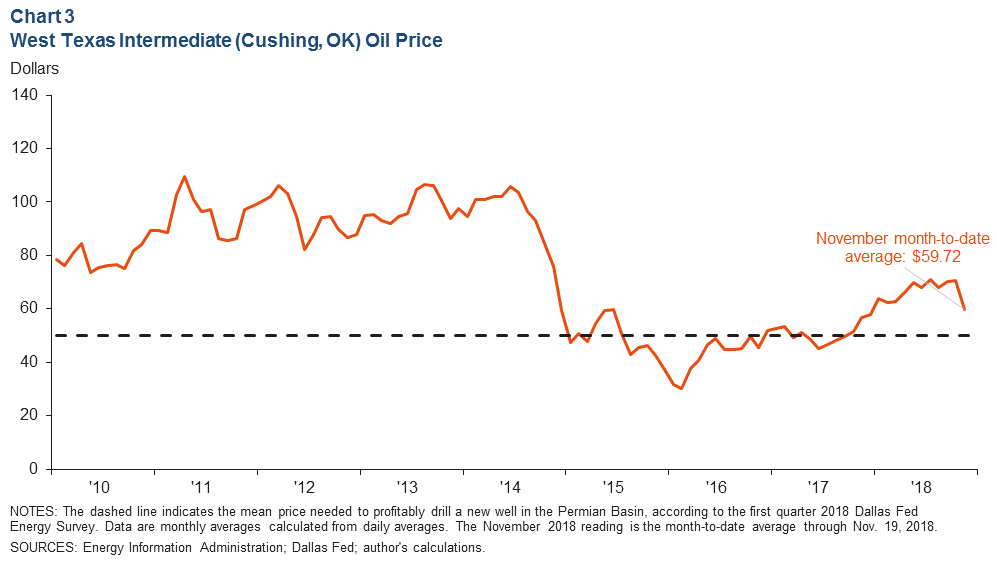
Price of West Texas Intermediate Drops in November
West Texas Intermediate oil prices fell in November after hovering around $70 per barrel for several months (Chart 3). Contributing to the drop in oil prices is a fear that there is an oversupply of oil; the International Energy Agency reports record output from the U.S., Saudi Arabia and Russia is offsetting declines in Iran and Venezuela. Prices are significantly below what most third-quarter Dallas Fed Energy Survey participants reported that they expected prices to be by the end of 2018.
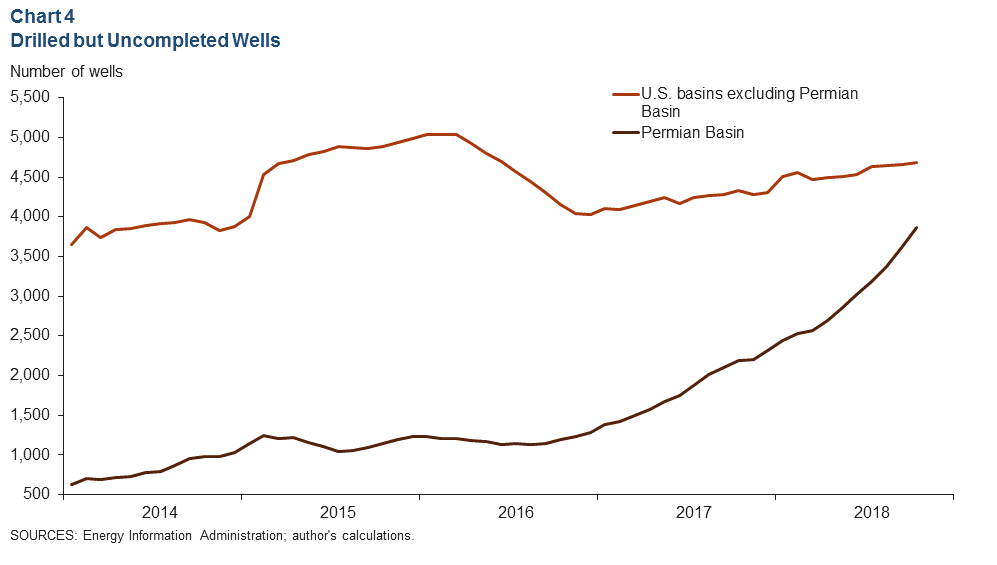
Drilled but Uncompleted Wells Rise Steadily
The Permian Basin's number of drilled but uncompleted wells (DUCs) increased from 3,617 to 3,866 between September and October (Chart 4). The Permian Basin has added over 1,500 DUCs this year as completions have significantly lagged the number of wells drilled. The rest of the U.S. has only added 377 DUCs this year.
Housing
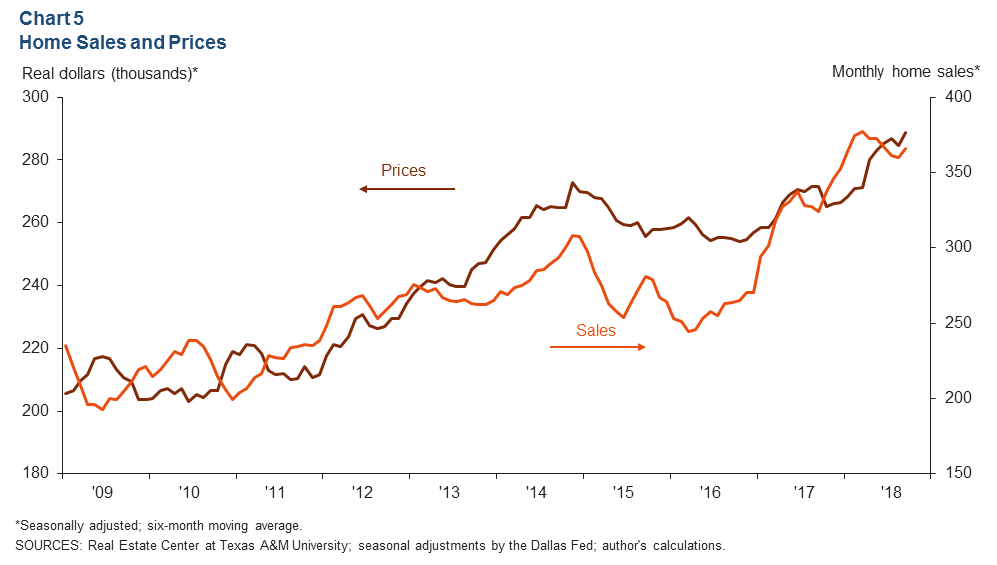
Prices Reach New High; Sales Pick Up in September
Existing-home sales and prices remained elevated in September, with prices hitting a new high for the series. The six-month moving average for Permian Basin home prices rose to about $289,000, a 1.6 percent increase from August (Chart 5). Home sales increased for the first time in three months, and year-over-year growth stayed in the double digits.
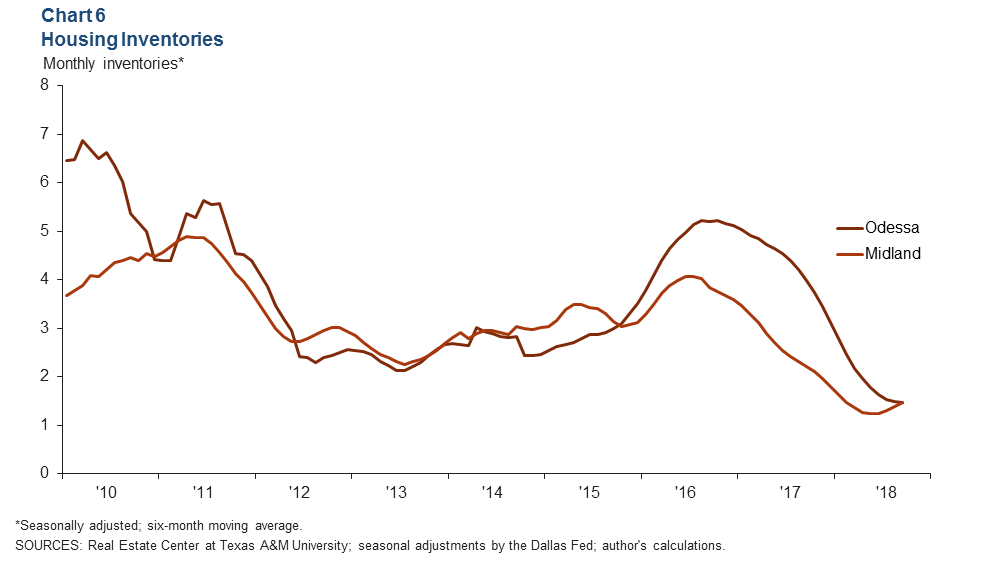
Inventory Remains Tight but Rises in Midland
The inventories of single-family homes remain tight in Midland and Odessa (Chart 6). Midland's inventory has steadily crept up in the second half of the year, while Odessa's has remained at record-low levels. Midland's inventory of existing homes has risen as total listings have increased. Though still well below the level seen last year, listings have risen from 288 in May to 335 in September.
NOTES: Data are for the Midland–Odessa metropolitan statistical area (Martin, Midland and Ector counties), except for energy data, which cover the 55 counties in West Texas and southern New Mexico that make up the Permian Basin region. Data may not match previously published numbers due to revisions.
About Permian Basin Economic Indicators
Questions can be addressed to Dylan Szeto at Dylan.Szeto@dal.frb.org. Permian Basin Economic Indicators is released on the third Wednesday of every month.