San Antonio Economic Indicators

March 18, 2022
Broad measures of the San Antonio economy continued to be positive in January. The San Antonio Business-Cycle Index grew slightly as employment rose and the unemployment rate remained unchanged at a low level. Annualized net job growth the past three months was slightly above the rate for all of 2021. Dining-out activity was strong in February and March, rebounding strongly after the COVID-19 omicron wave peaked. Home prices in San Antonio continued to reach record highs, while the share of affordable homes continued to decrease.
Business-cycle index
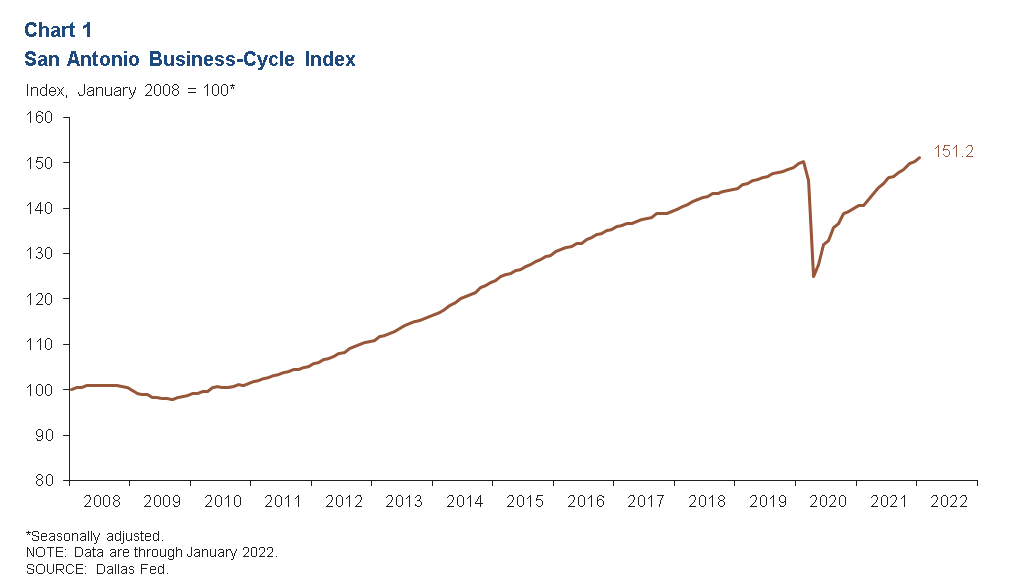
The San Antonio Business-Cycle Index—a broad measure of economic activity in the metro—grew at an annualized rate of 6.8 percent in January after rising 5.1 percent in December (Chart 1).
Labor market
Unemployment rate holds steady near pandemic lows
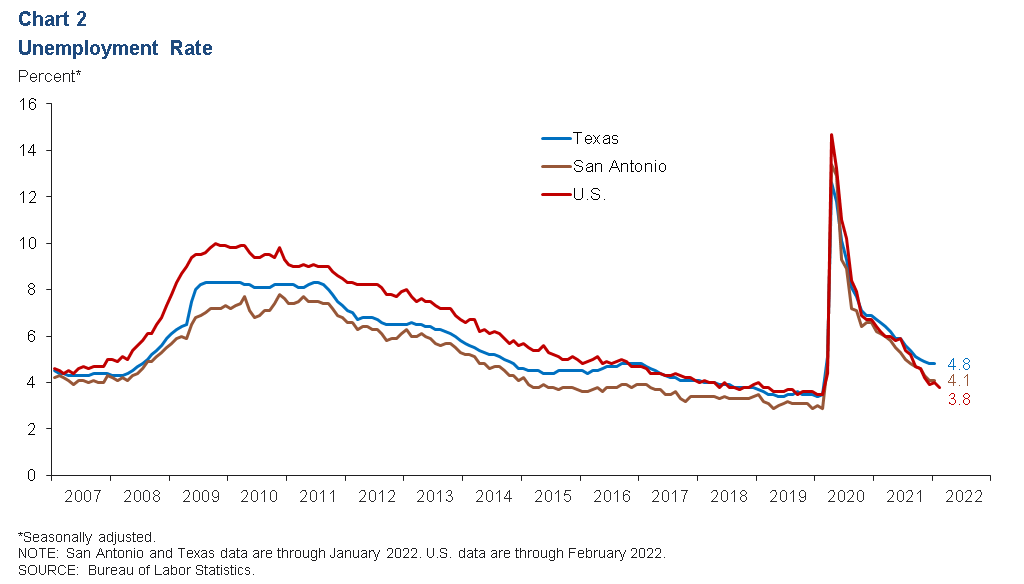
The metro’s unemployment rate remained constant in January at 4.1 percent, one of the lowest rates since the start of the pandemic (Chart 2). The state’s jobless rate remained constant as well in January at 4.8 percent, while the nation’s rate increased slightly to 4.0 percent. However, recently released U.S. data show that the nation’s rate fell to 3.8 percent in February. San Antonio’s labor force expanded an annualized 13.1 percent in January, well above Texas’ gain of 4.3 percent and the nation’s gain of 10.8 percent. In February, the nation’s labor force expanded 2.3 percent.
Recent job gains mostly positive
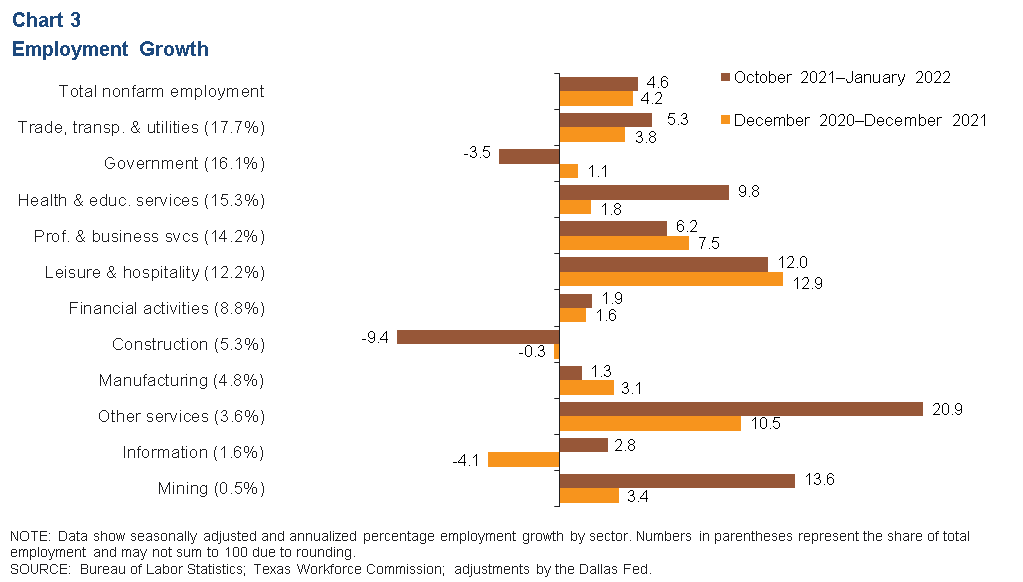
San Antonio payrolls expanded an annualized 4.6 percent (12,022 jobs) in the three months ending in January (Chart 3). Among the major sectors, leisure and hospitality led three-month growth (12.0 percent, or 3,723 jobs) and was followed by health and education services (9.8 percent, or 3,840 jobs). Industries that posted contractions the past three months were construction (-9.4 percent, or 1,424 jobs) and government (-3.5 percent, or 1,523 jobs). In March and April 2020 combined, 138,332 jobs were lost in the metro as the pandemic hit. As of January 2022, 99.5 percent of those jobs had been recovered.
Home prices
Home prices continue to reach new heights
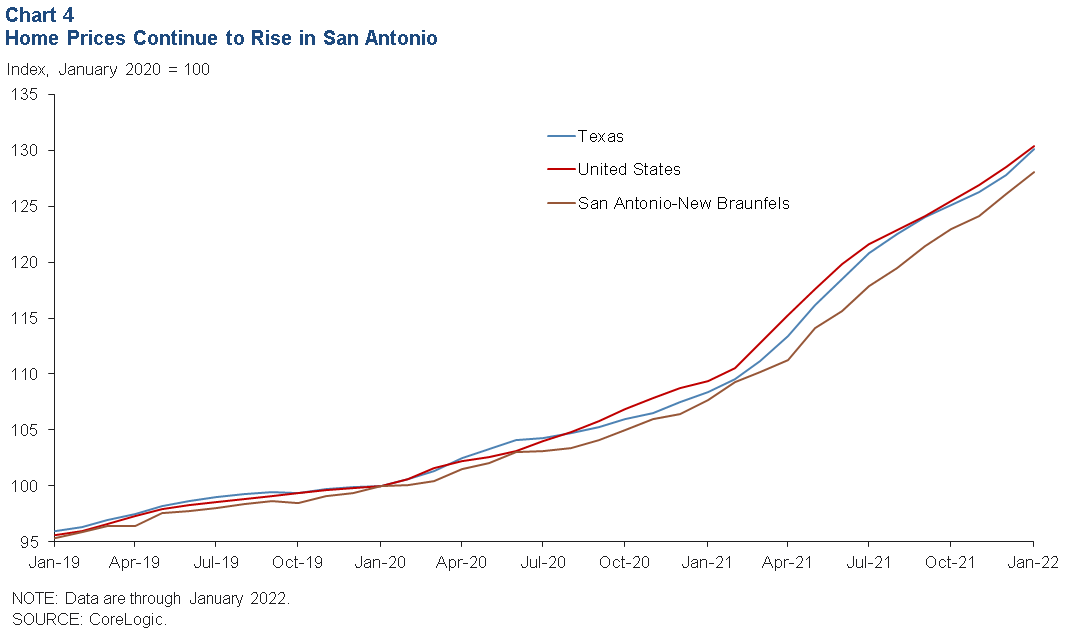
Data from CoreLogic’s Home Price Index indicate San Antonio’s home prices continue to reach record highs (Chart 4). Over the past 12 months, prices have surged 18.9 percent. While this is less than Texas’ rate of 20.1 percent and the nation’s rate of 19.1 percent, this still puts San Antonio’s home price appreciation well above the 10-year average of 8.9 percent. According to data from the Multiple Listing Service, median home prices in San Antonio stood at $310,193 as of January 2022.
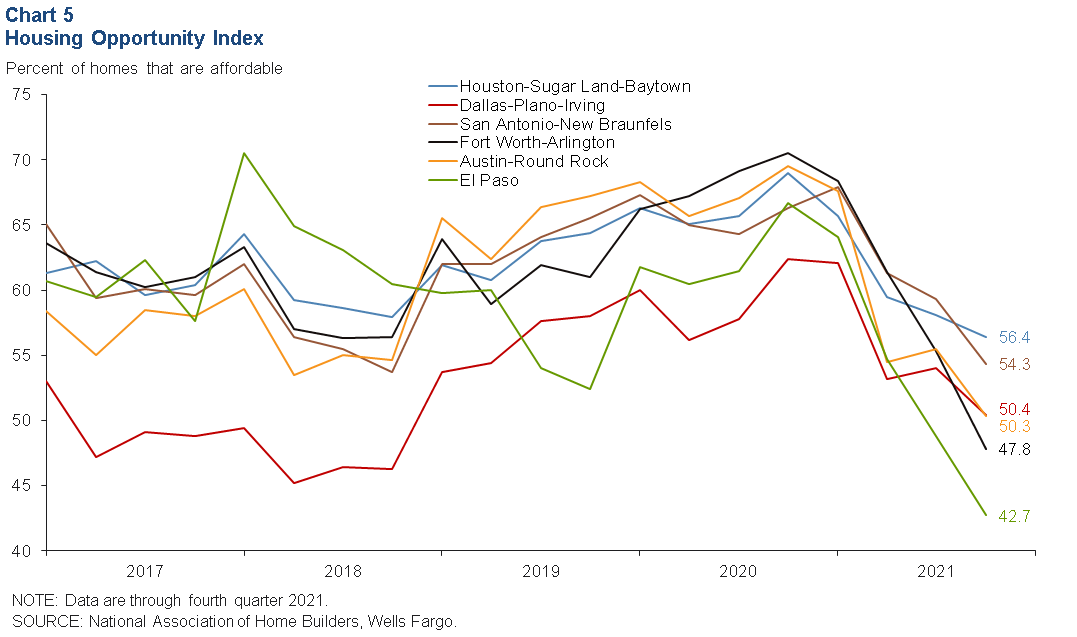
Housing affordability declines sharply
Coinciding with the increased rate of home price increases has been a decrease in the affordability of San Antonio homes (Chart 5). The National Association of Home Builders/Wells Fargo Housing Opportunity Index indicates that just 54.3 percent of homes in San Antonio were affordable to families making the median local income as of fourth quarter 2021. This is 13.6 percentage points lower compared with first quarter 2021, though it compares more favorably most than other Texas metros, which have seen steeper declines in affordability.
Dining activity
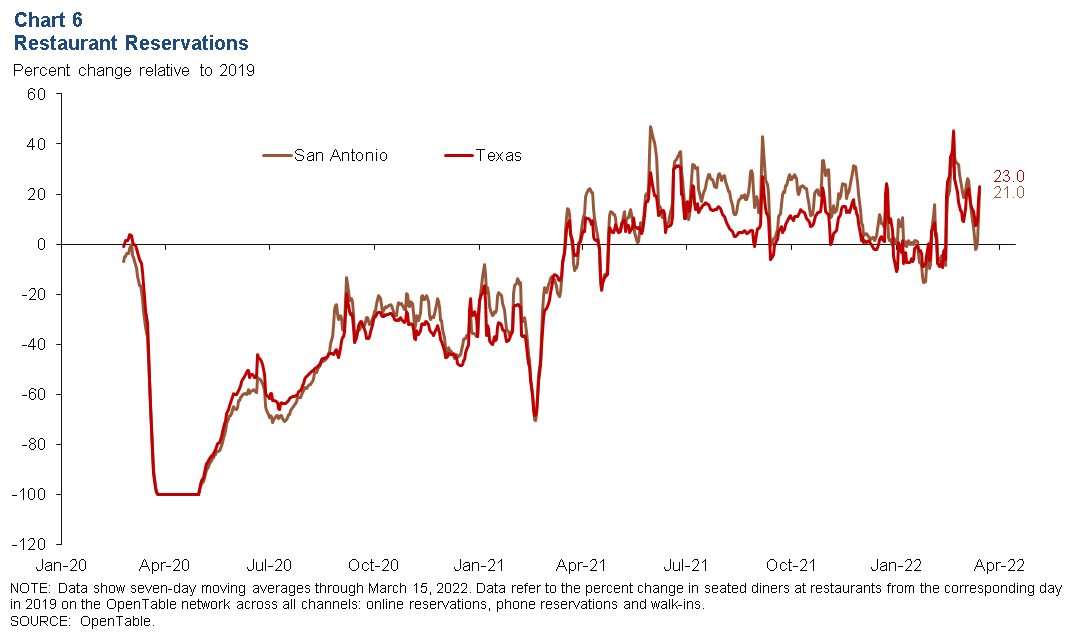
San Antonio dining activity fell briefly near the beginning of 2022 but has since recovered strongly (Chart 6). While January 2022 saw dining levels fall as far as 15.2 percent below 2019 levels, local dining activity is now 21.0 percent higher than it was three years ago.
NOTE: Data may not match previously published numbers due to revisions.
About San Antonio Economic Indicators
Questions can be addressed to James Lee at James.Lee@dal.frb.org. San Antonio Economic Indicators is published every month during the week after state and metro employment data are released.