San Antonio Economic Indicators
July 28, 2022 (updated August 4, 2022)
Broad measures of the San Antonio economy remained positive in June. Both the business activity and employment grew as the unemployment rate fell. Wages in San Antonio largely stayed the same, though the metro’s wage growth still outpaced both the state and national averages over the past 12 months. Local dining-out activity slowed in July but remained above prepandemic levels.
Business-cycle index
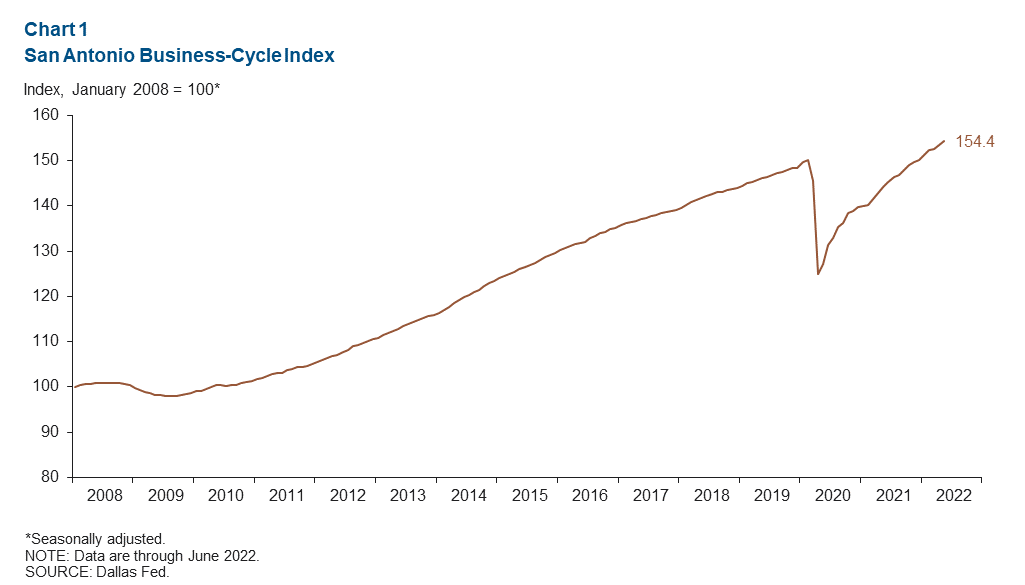
The San Antonio Business-Cycle Index —a broad measure of economic activity in the metro—grew at an annualized rate of 8.3 percent in June, faster than the 4.6 percent growth in May (Chart 1).
Labor market
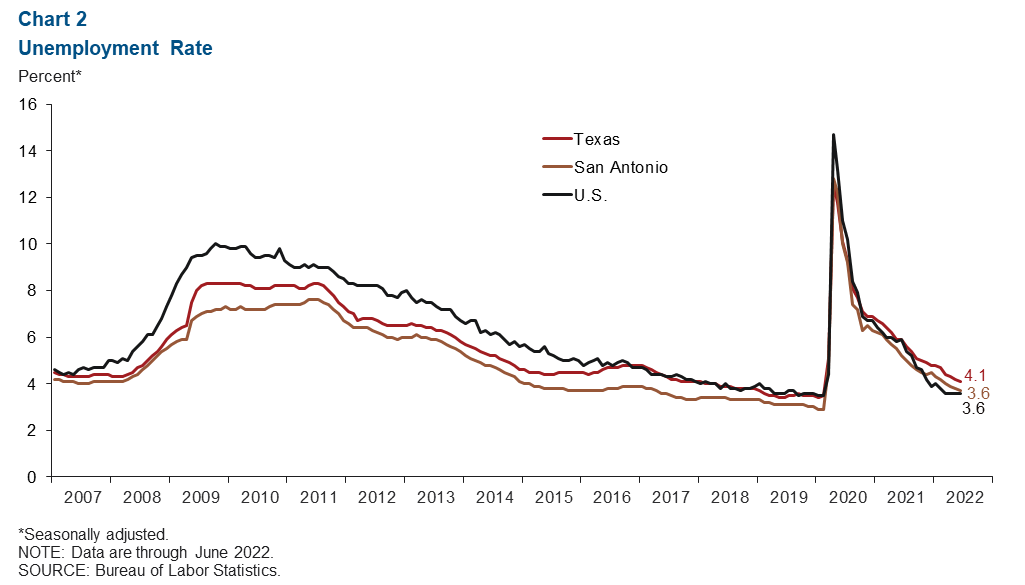
Unemployment rate decreases slightly in June
The San Antonio unemployment rate decreased to 3.6 percent in June (Chart 2). The metro’s unemployment rate is on par with the U.S. jobless figure of 3.6 percent but below the state rate of 4.1 percent. The regional labor force expanded at a 6.2 percent annualized rate—3.7 percent above its peak in February 2022.
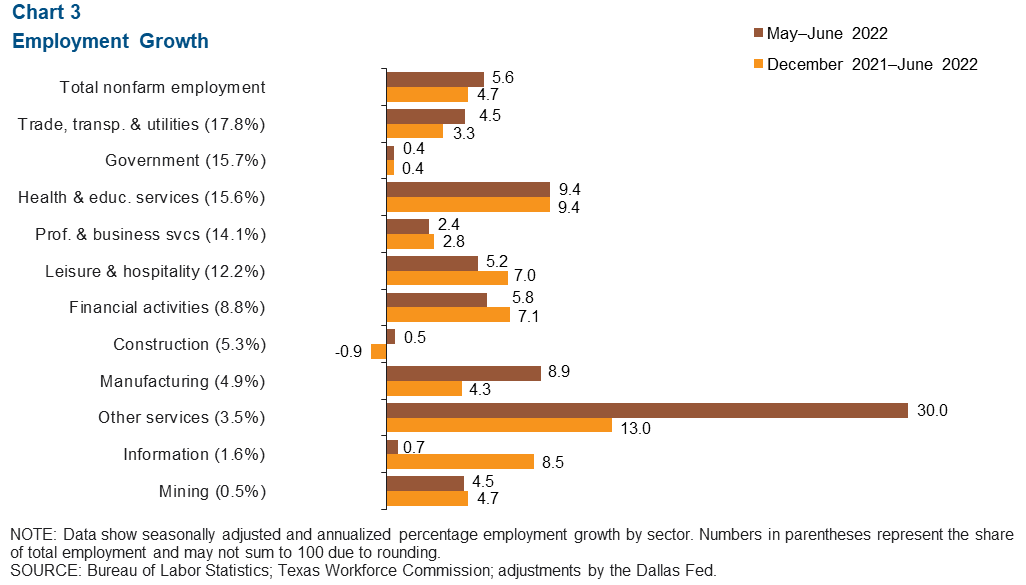
Recent job gains remain solid
San Antonio payrolls expanded 5.6 percent from May to June (5,017 jobs) (Chart 3). Among the major sectors, other services grew the most at 30.0 percent (864 jobs) followed by health and education, up 9.4 percent (1,298 jobs) and manufacturing, up 8.9 percent (386 jobs). Government and construction grew minimally at 0.4 and 0.5 percent growth respectively (63 and 25 jobs). With the overall increase in June employment, San Antonio has gained approximately 155,000 jobs since the depths of the pandemic in April 2020 and has surpassed prepandemic employment.
Wages
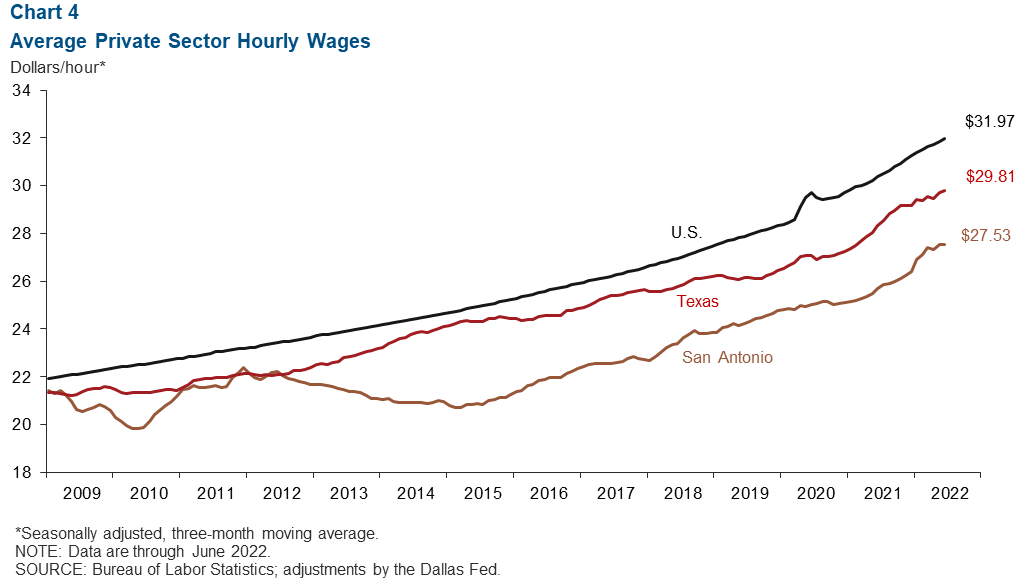
San Antonio wages stayed steady in June (Chart 4). The three-month moving average of hourly wages in San Antonio was $27.53, below the state average of $29.81 and the national average of $31.97. The 12-month growth in wages rose slightly to 8.1 percent in San Antonio, still outpacing gains of 5.8 percent for Texas and 5.5 percent for the U.S.
COVID-19
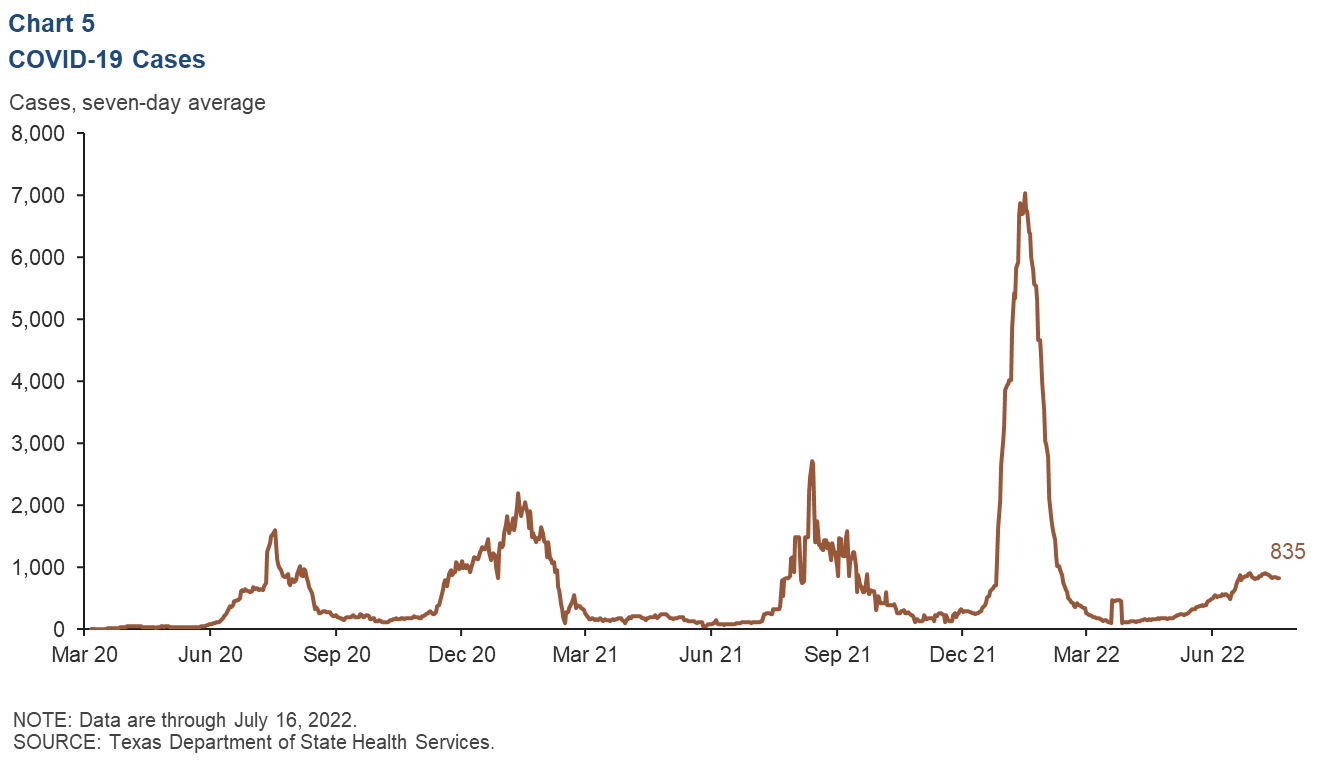
COVID-19 cases rose amid the spread of the BA.4 and BA.5 subvariants, reaching 835 reported cases in the week ending July 16 but remaining well below its peak in January (Chart 5). It’s also possible cases are being underreported due to the greater availability of at-home testing.
Dining activity
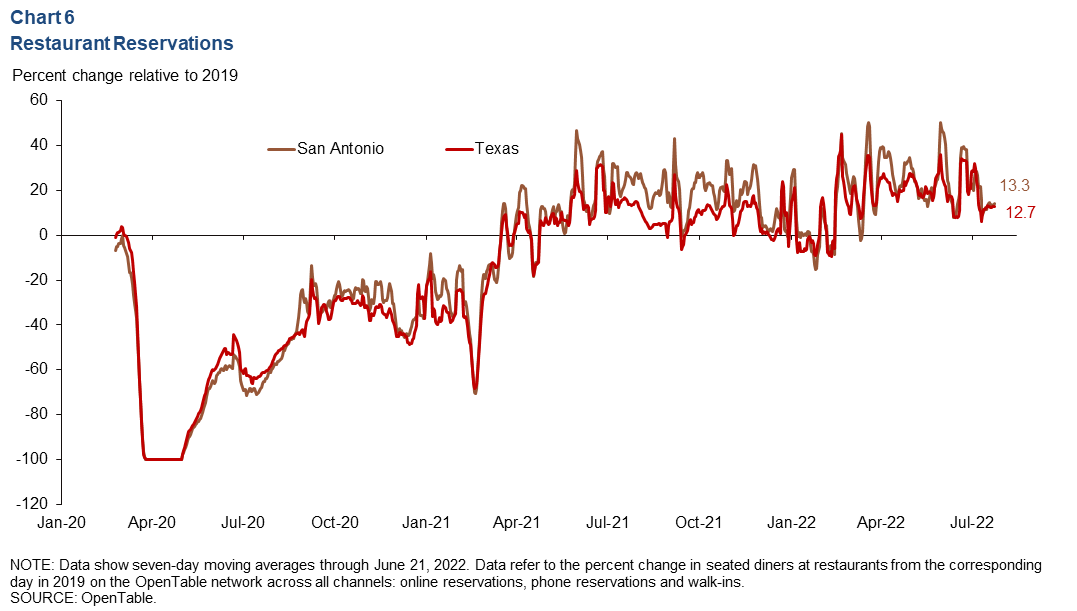
San Antonio dining-out activity stayed above 2019 levels through the summer but declined from its peak in June (Chart 6). As of July 24, dining-out activity was 13.3 percent higher than it was in 2019 and greater than the 12.7 percent increase for Texas.
NOTES: The San Antonio payroll employment data and corresponding chart (Chart 3) were updated August 4, 2022. Data may not match previously published numbers due to revisions.
About San Antonio Economic Indicators
Questions can be addressed to Vee Kalkunte at Prithvi.Kalkunte@dal.frb.org. San Antonio Economic Indicators is published every month during the week after state and metro employment data are released.