San Antonio Economic Indicators

November 30, 2022
| San Antonio Economy Dashboard (October 2022) | |||
| Job growth (annualized) Sept.–Oct. '22 |
Unemployment rate |
Avg. hourly earnings |
Avg. hourly earnings growth y/y |
| 5.1% | 3.7% | $27.83 | 6.4% |
In October, the San Antonio economy experienced wage and job growth. The unemployment rate increased slightly due to an increase in the labor force. The housing market continued to show signs of cooling as home-price growth decelerated. Housing affordability continued to decline due to rising mortgage rates.
Labor market
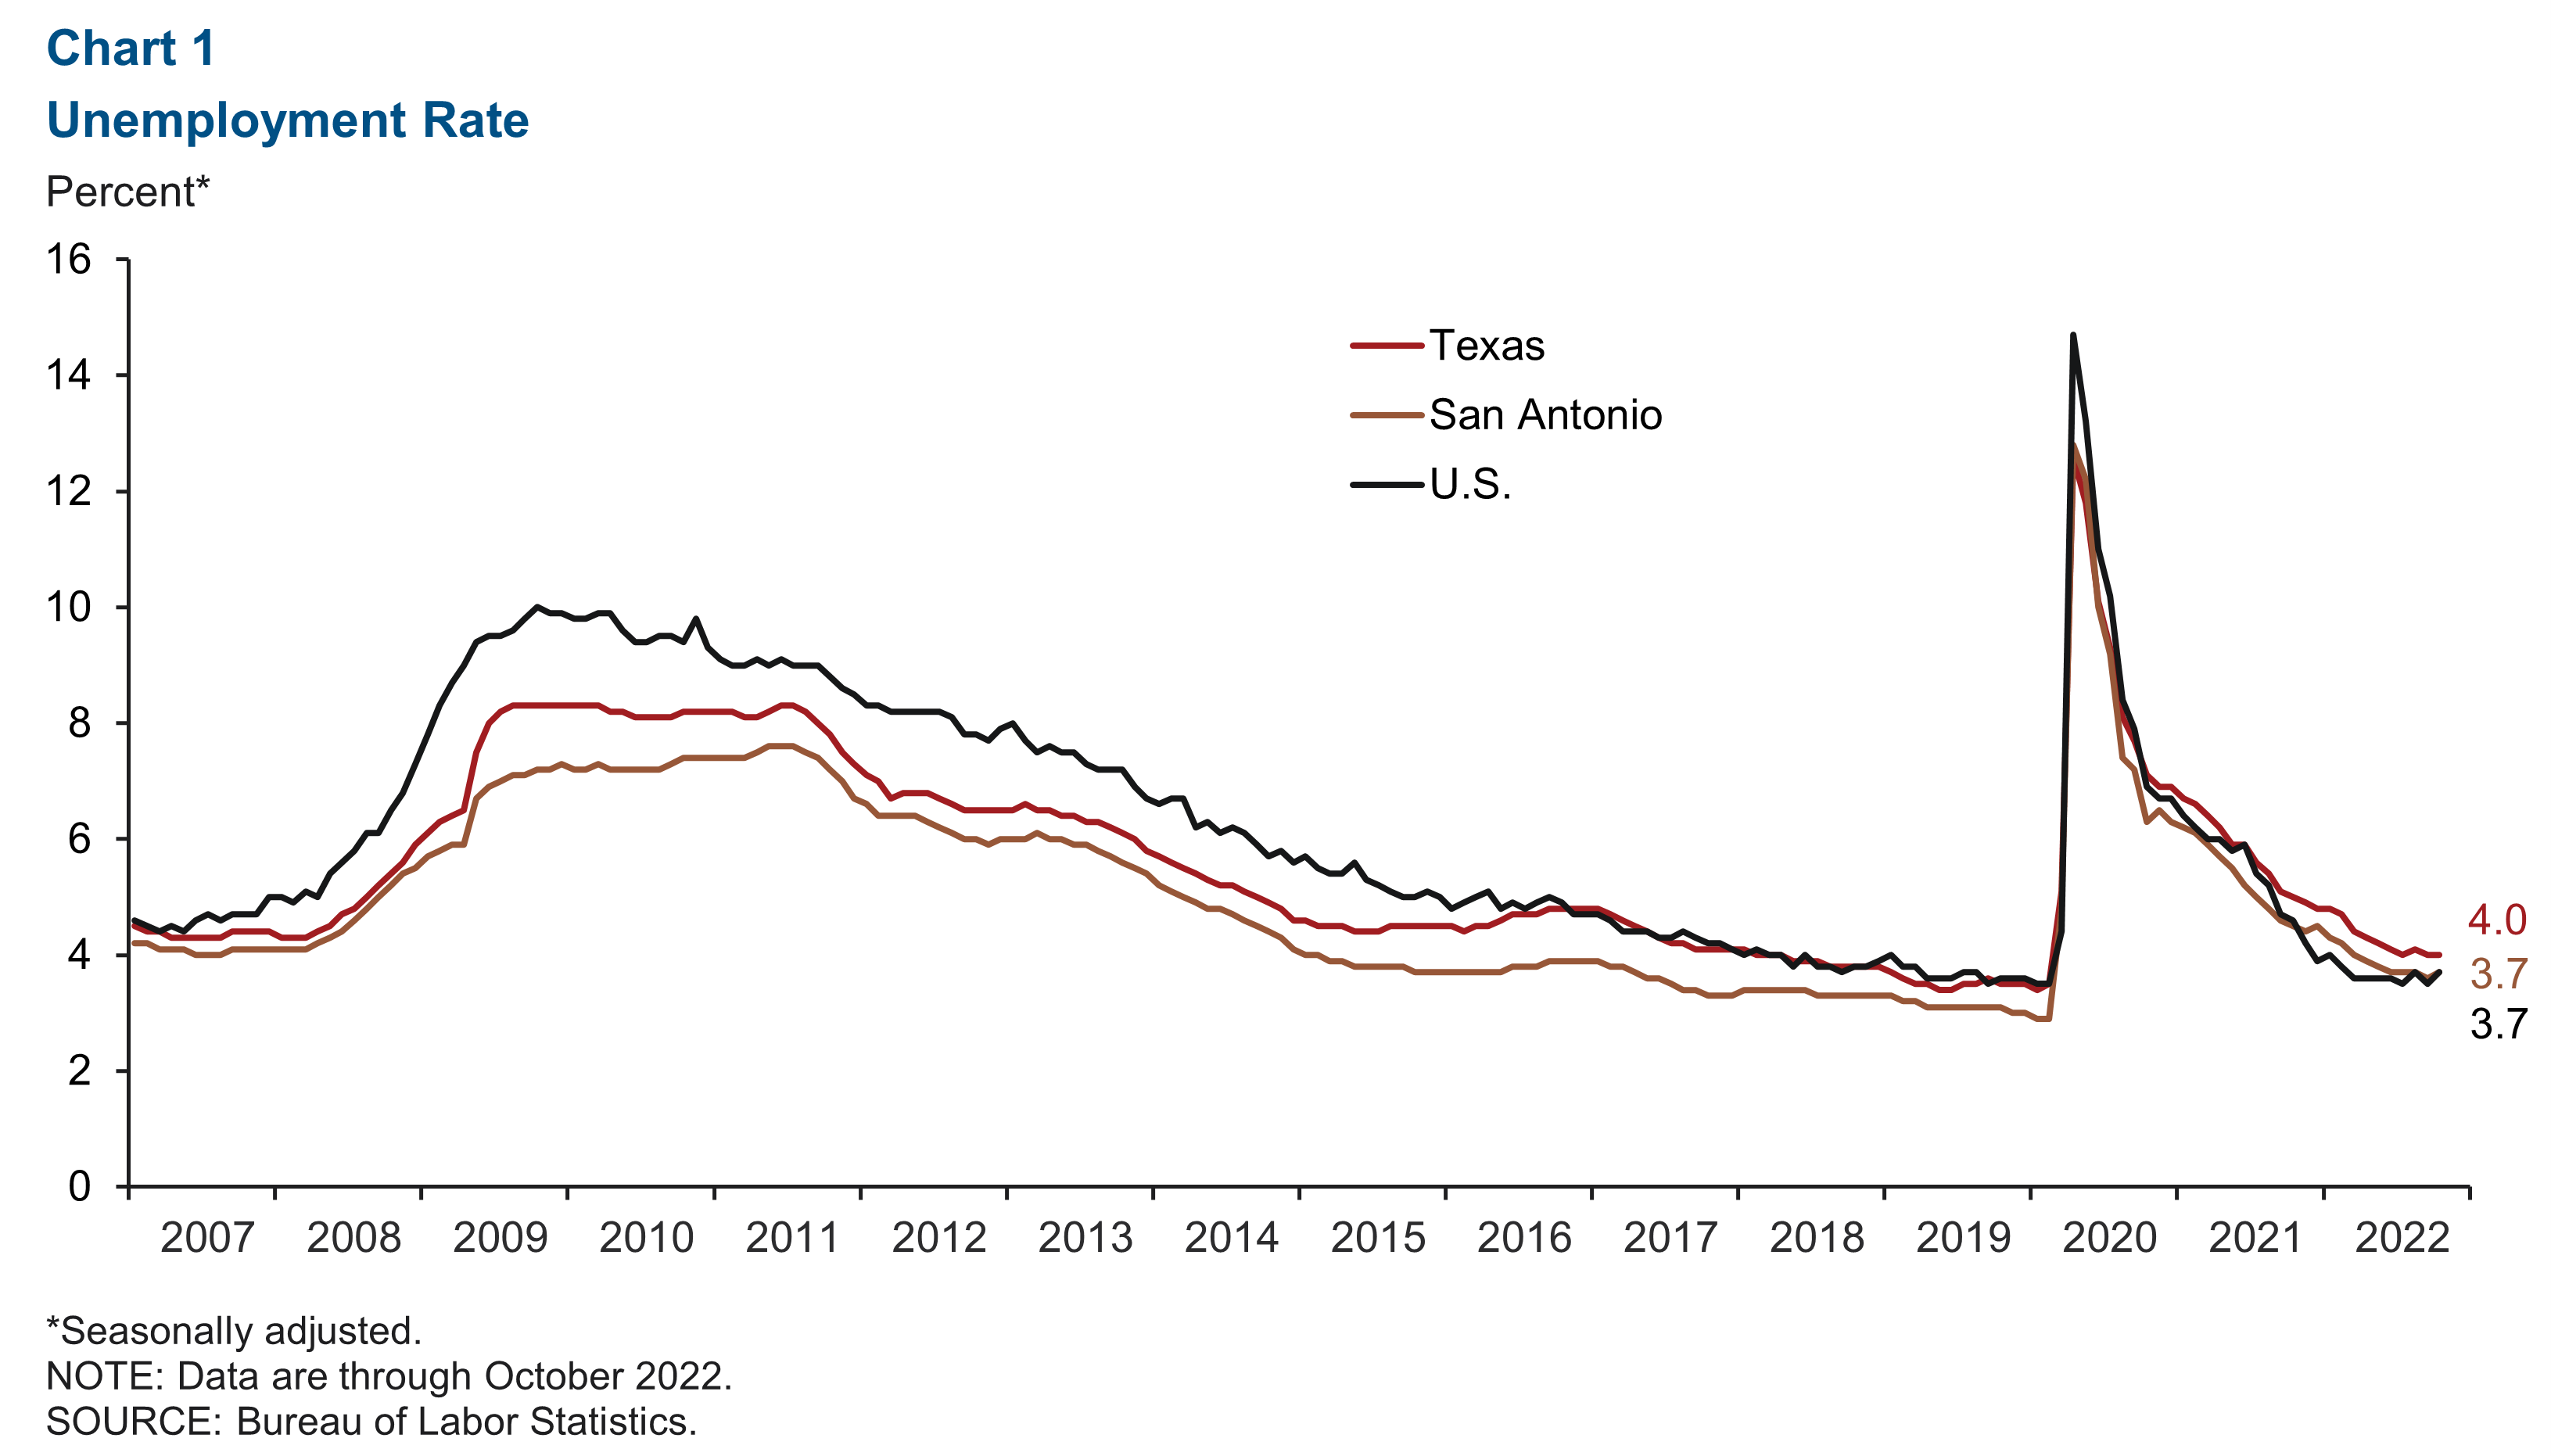
Unemployment rate Increases slightly in October
The San Antonio unemployment rate ticked up to 3.7 percent in September from 3.6 in August (Chart 1). The metro’s unemployment rate is on par with the U.S rate but below the state’s 4.0 percent. In October, San Antonio’s labor force grew at a 9.7 percent annualized rate.
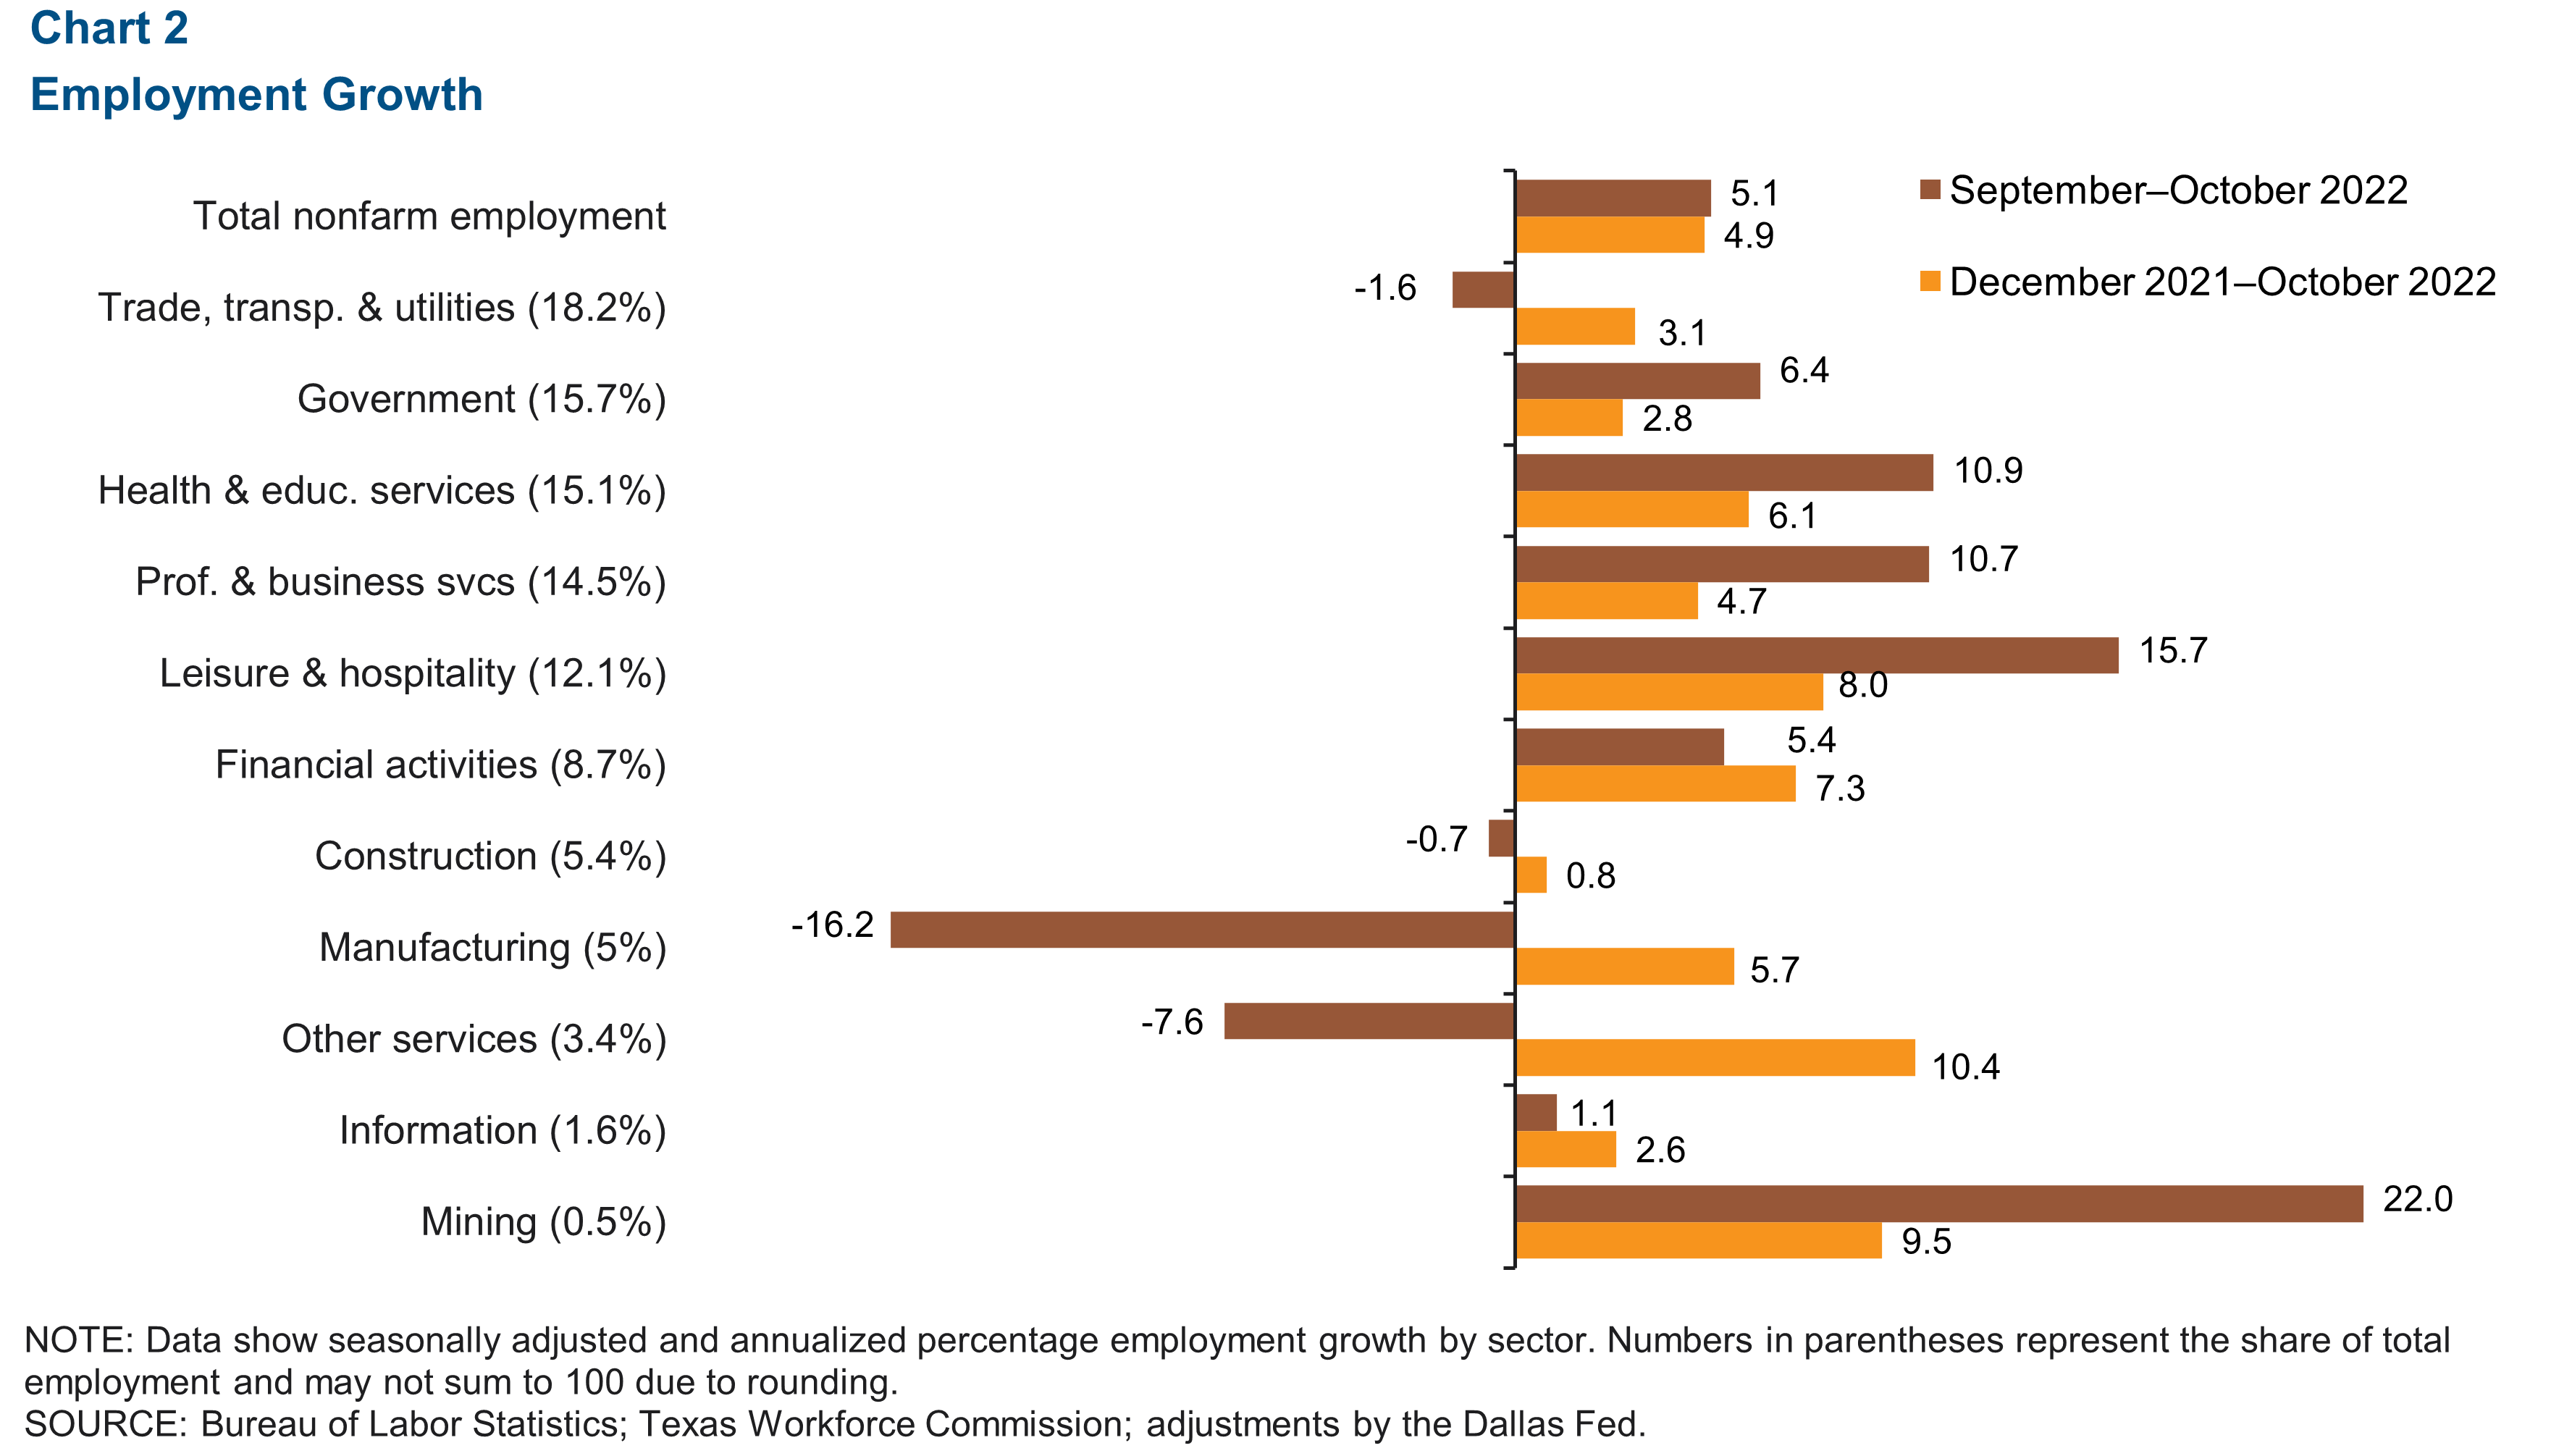
Most job sectors see growth
San Antonio payrolls grew at 5.1 percent from September to October (4,660 jobs) (Chart 2). Along the major sectors, mining jumped an annualized 22.0 percent (105 jobs), followed by leisure and hospitality increasing 15.7 percent (1,680 jobs). On the other hand, manufacturing saw a decline of 16.2 percent annualized (835 jobs). Since April 2020, San Antonio has gained 174,679 jobs, which remains above prepandemic levels.
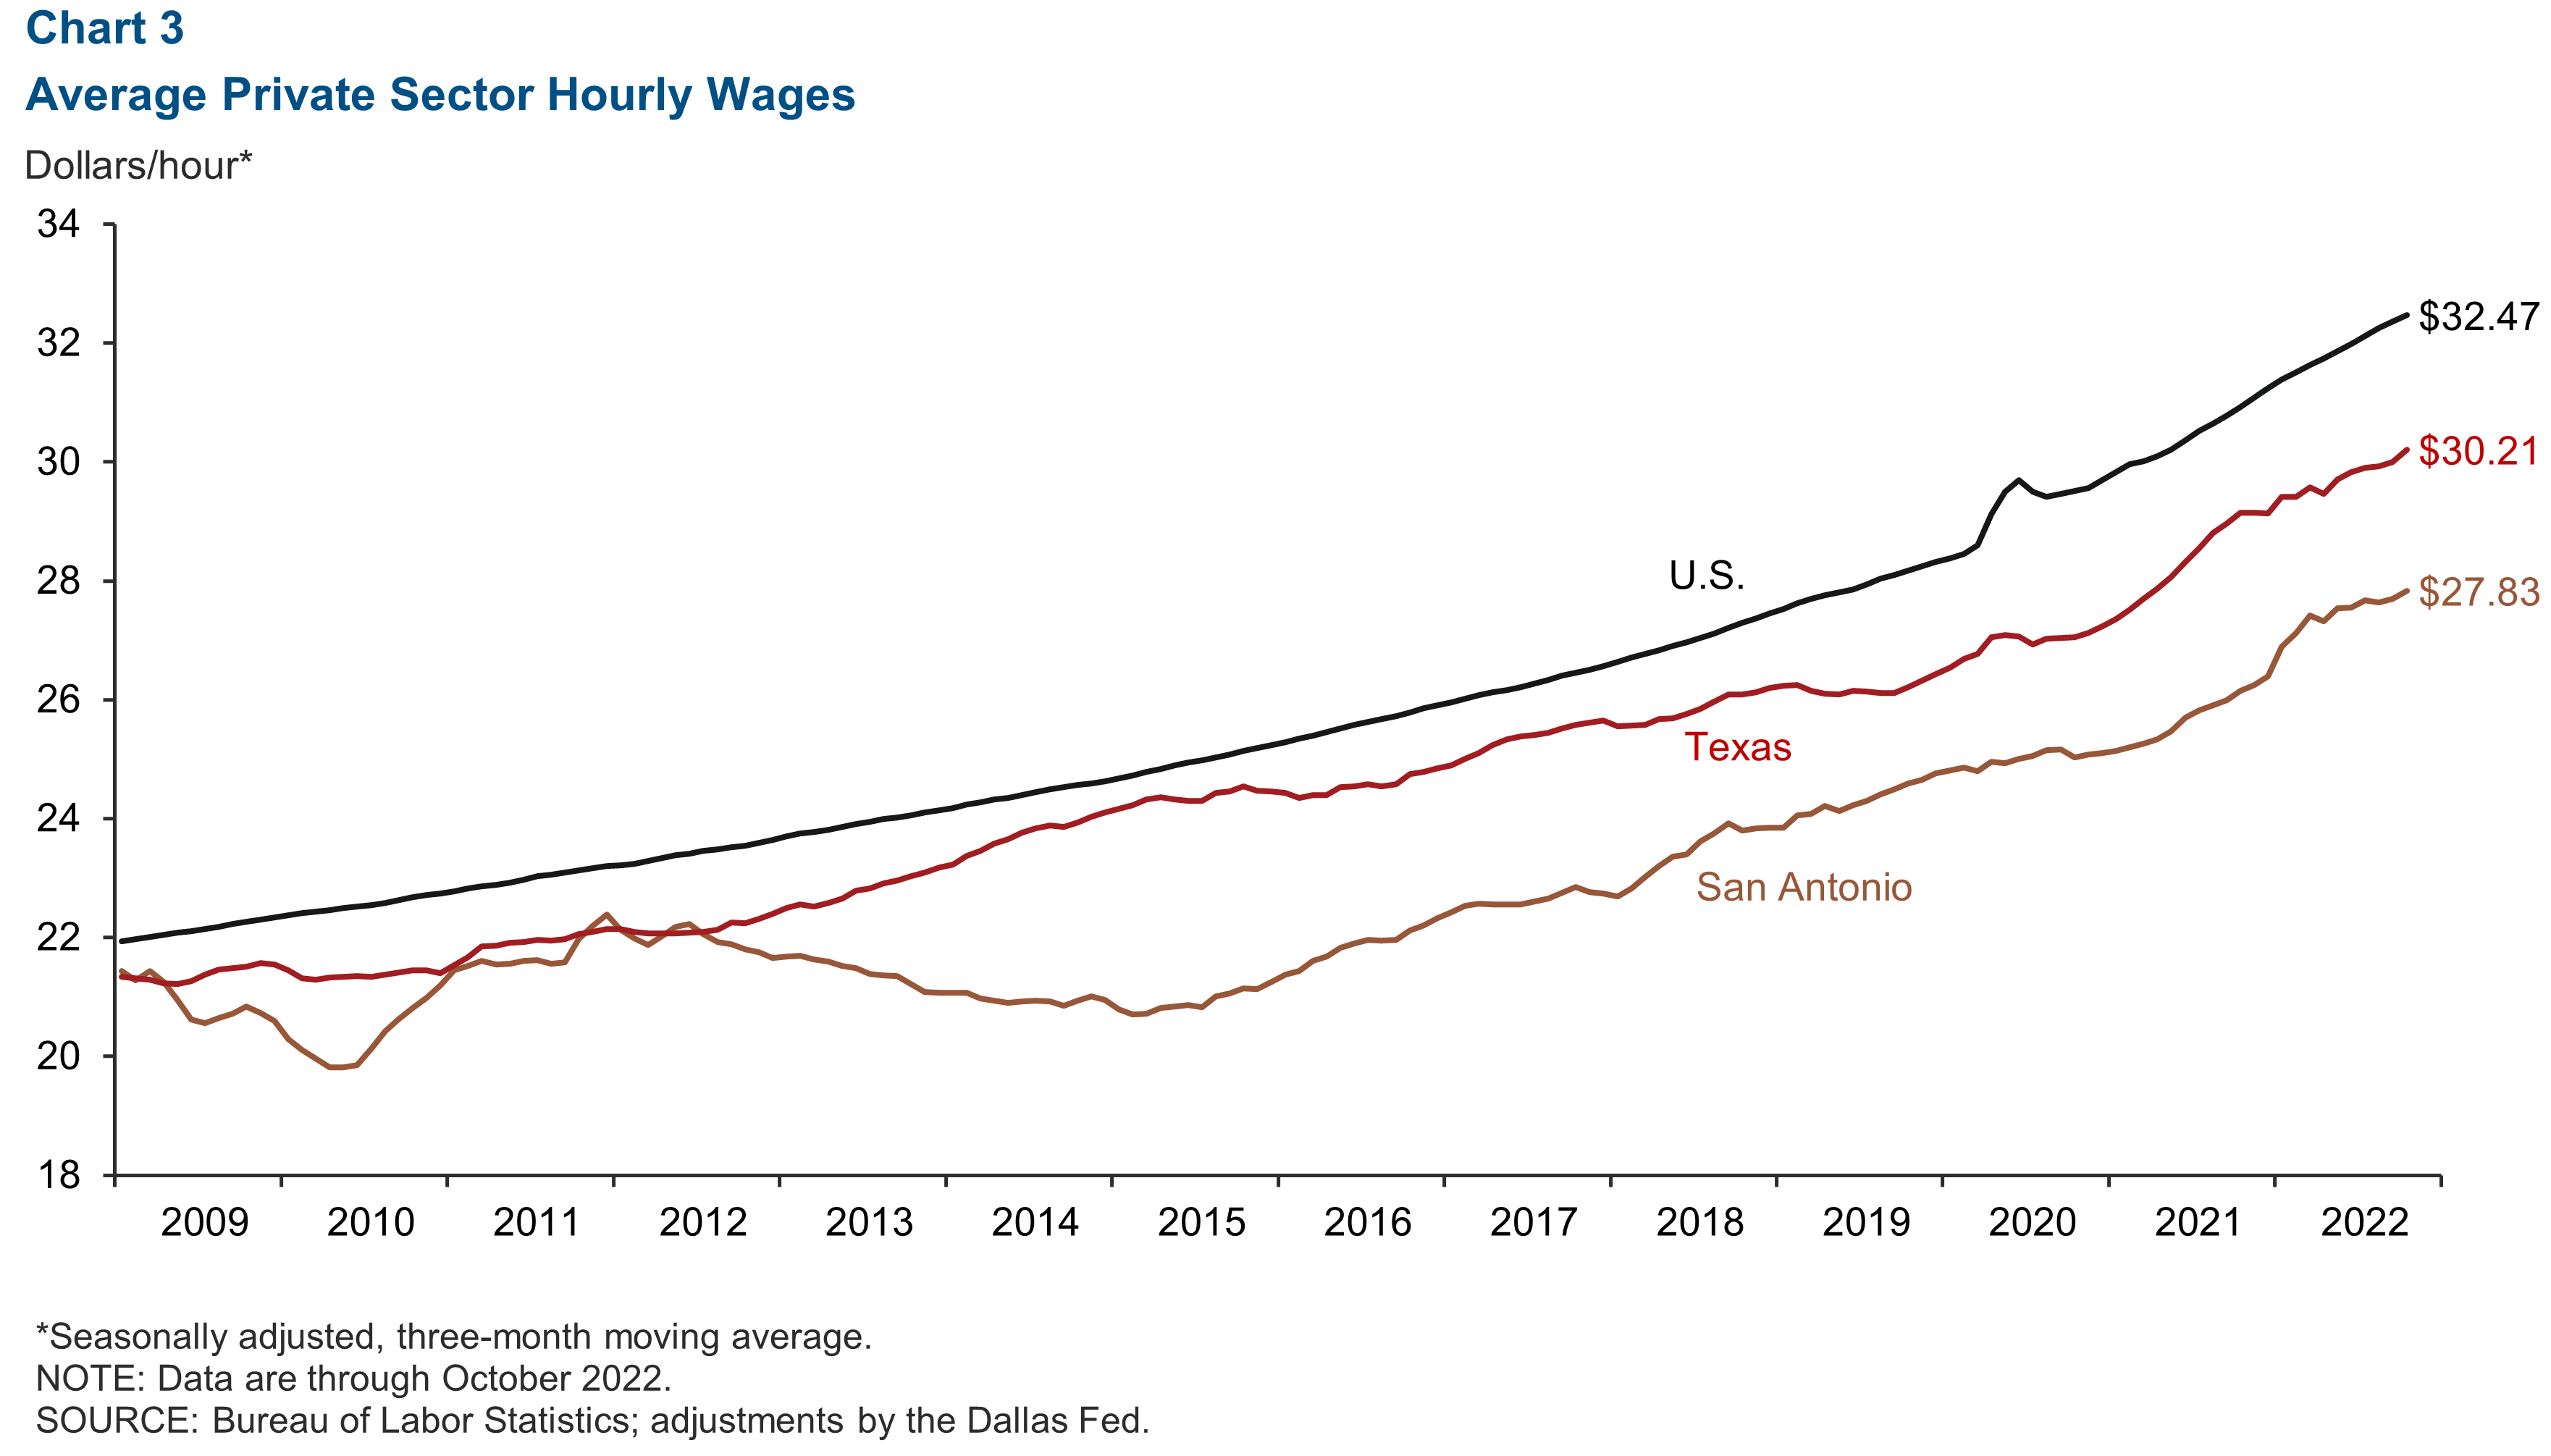
Wages climb higher
San Antonio wages grew at an annualized 6.0 percent in October. The three-month moving average of hourly wages rose to $27.83, remaining below the state average of $30.21 and the national average of $32.47 (Chart 3). The 12-month growth in wages in San Antonio was 6.4 percent, outpacing gains of 3.6 percent for Texas and 5.0 percent for the U.S.
Housing
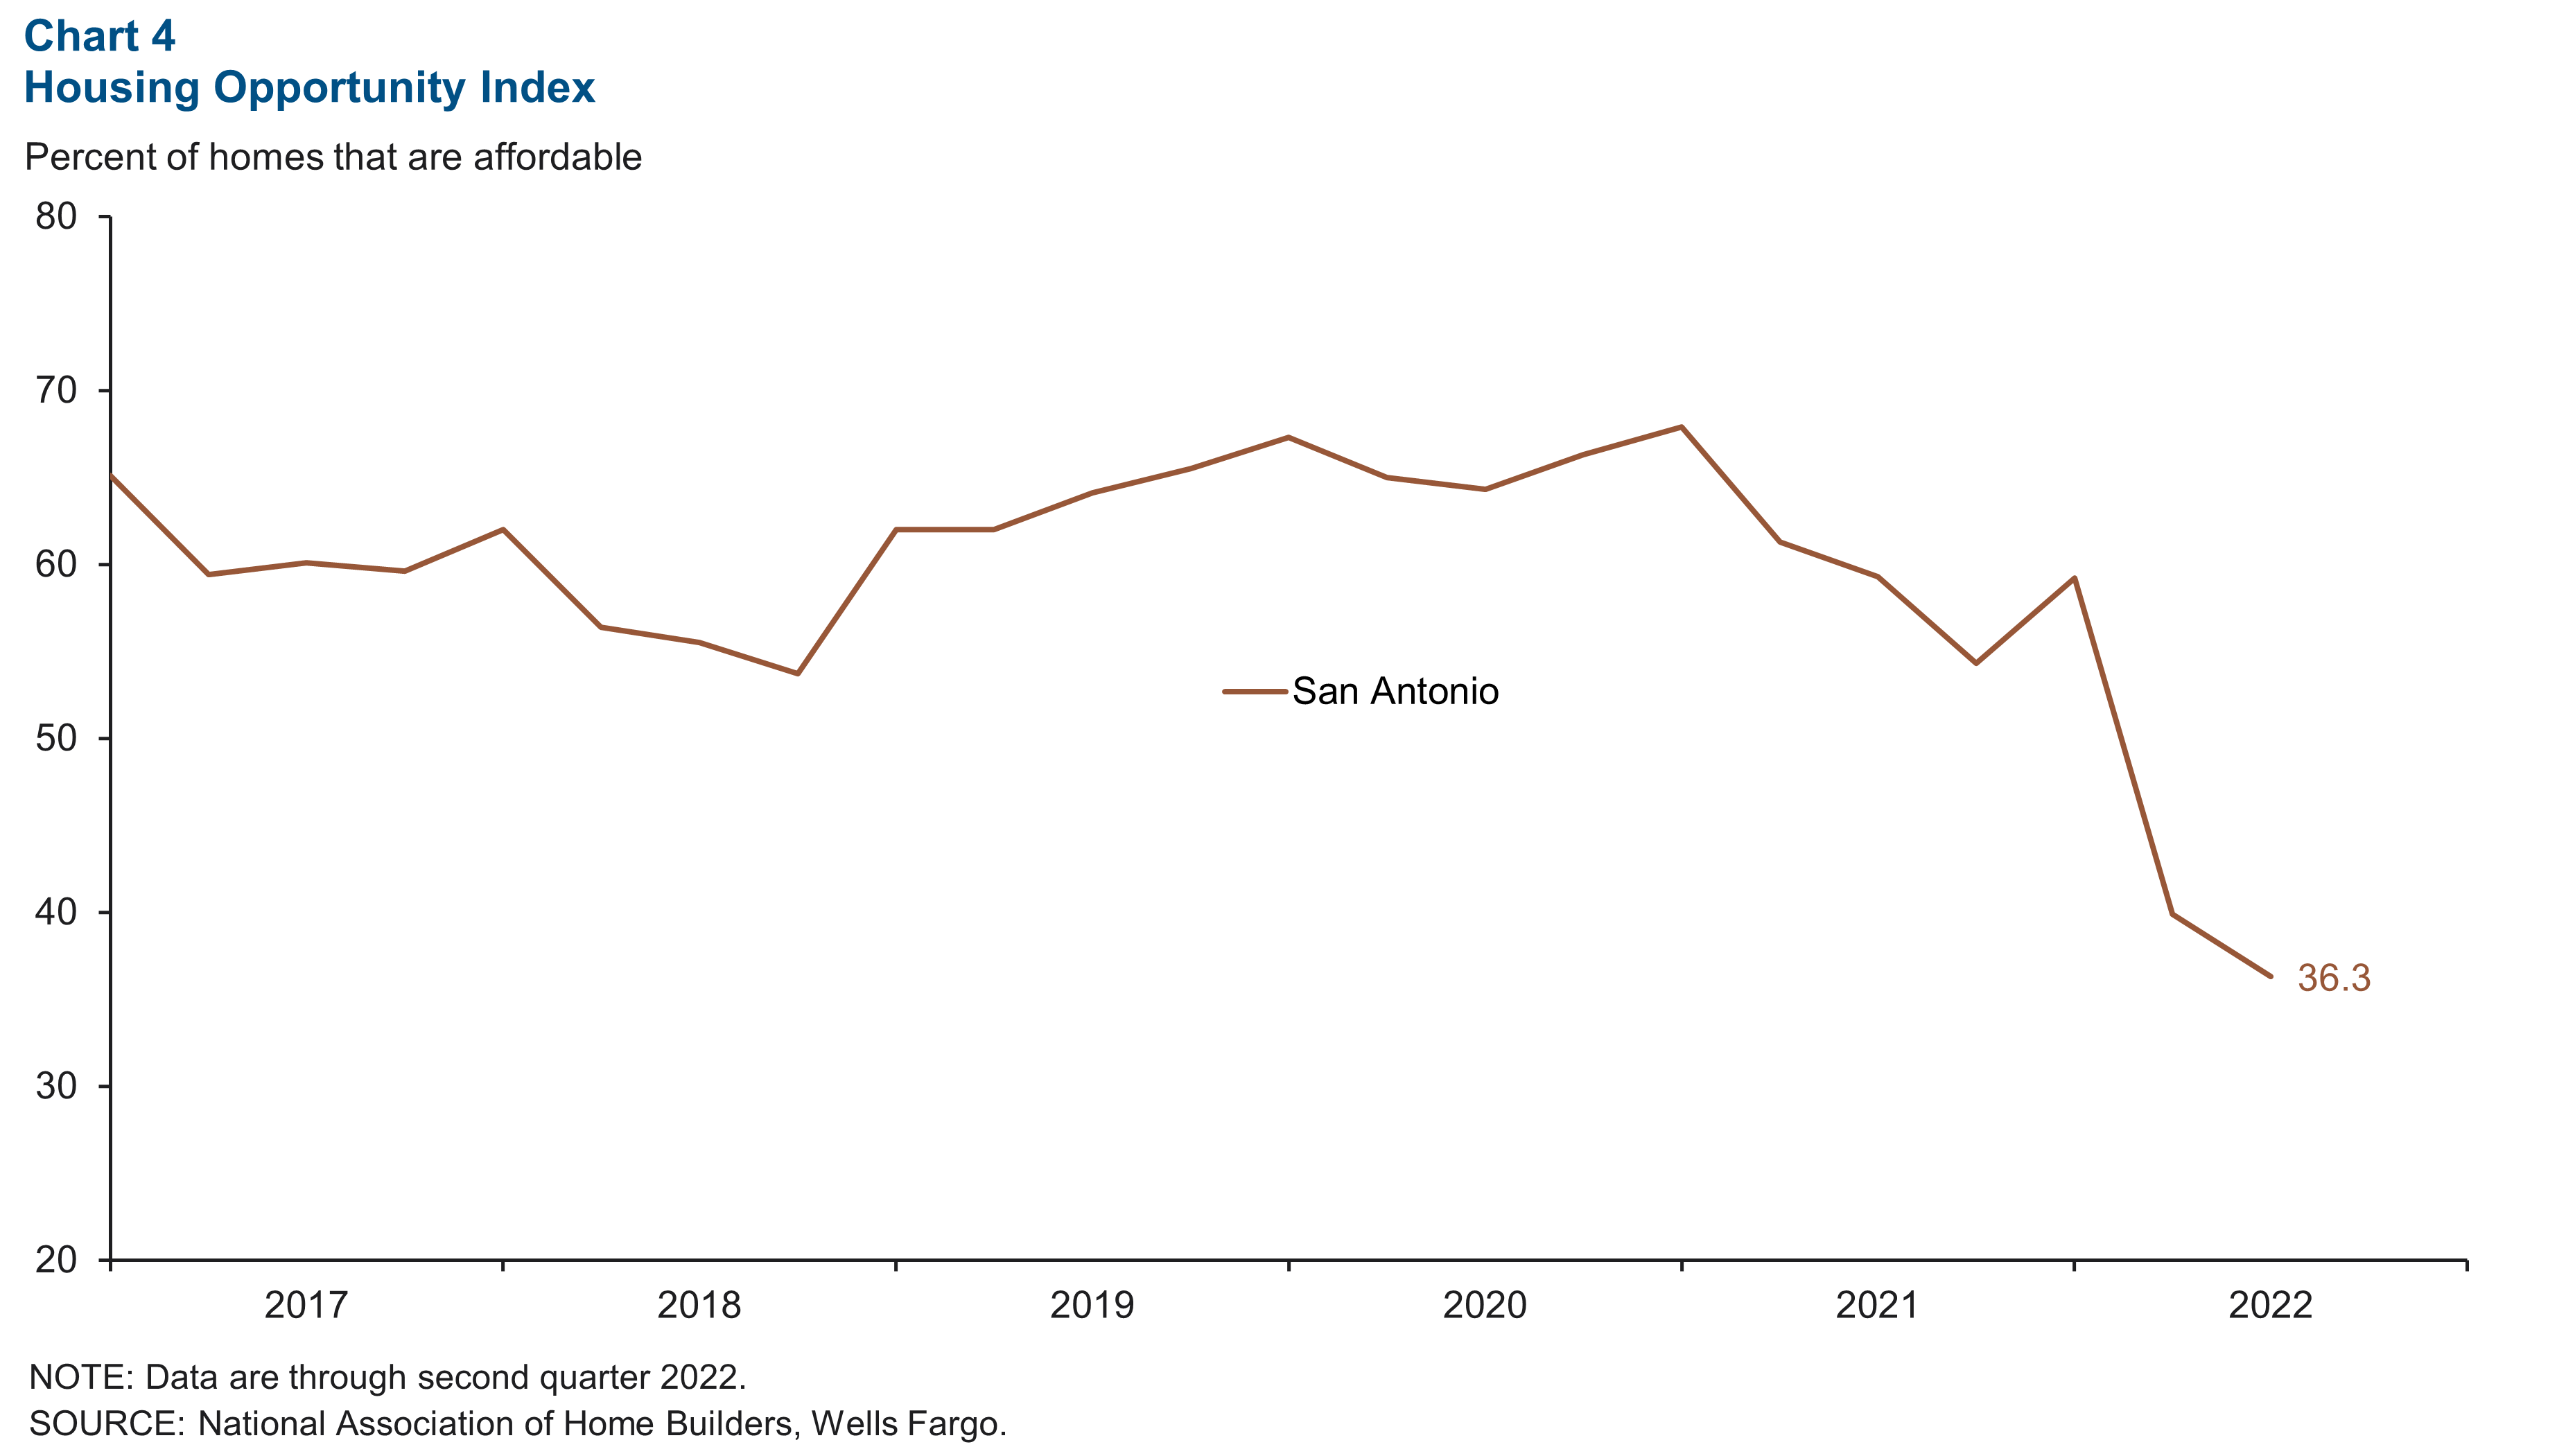
Housing affordability declines slightly
Home affordability in San Antonio continued to fall during third quarter 2022, as a little more than one-third of all homes sold in San Antonio were affordable to households earning the median income in the area (Chart 4). This is lower than the national average of 42.2 percent.
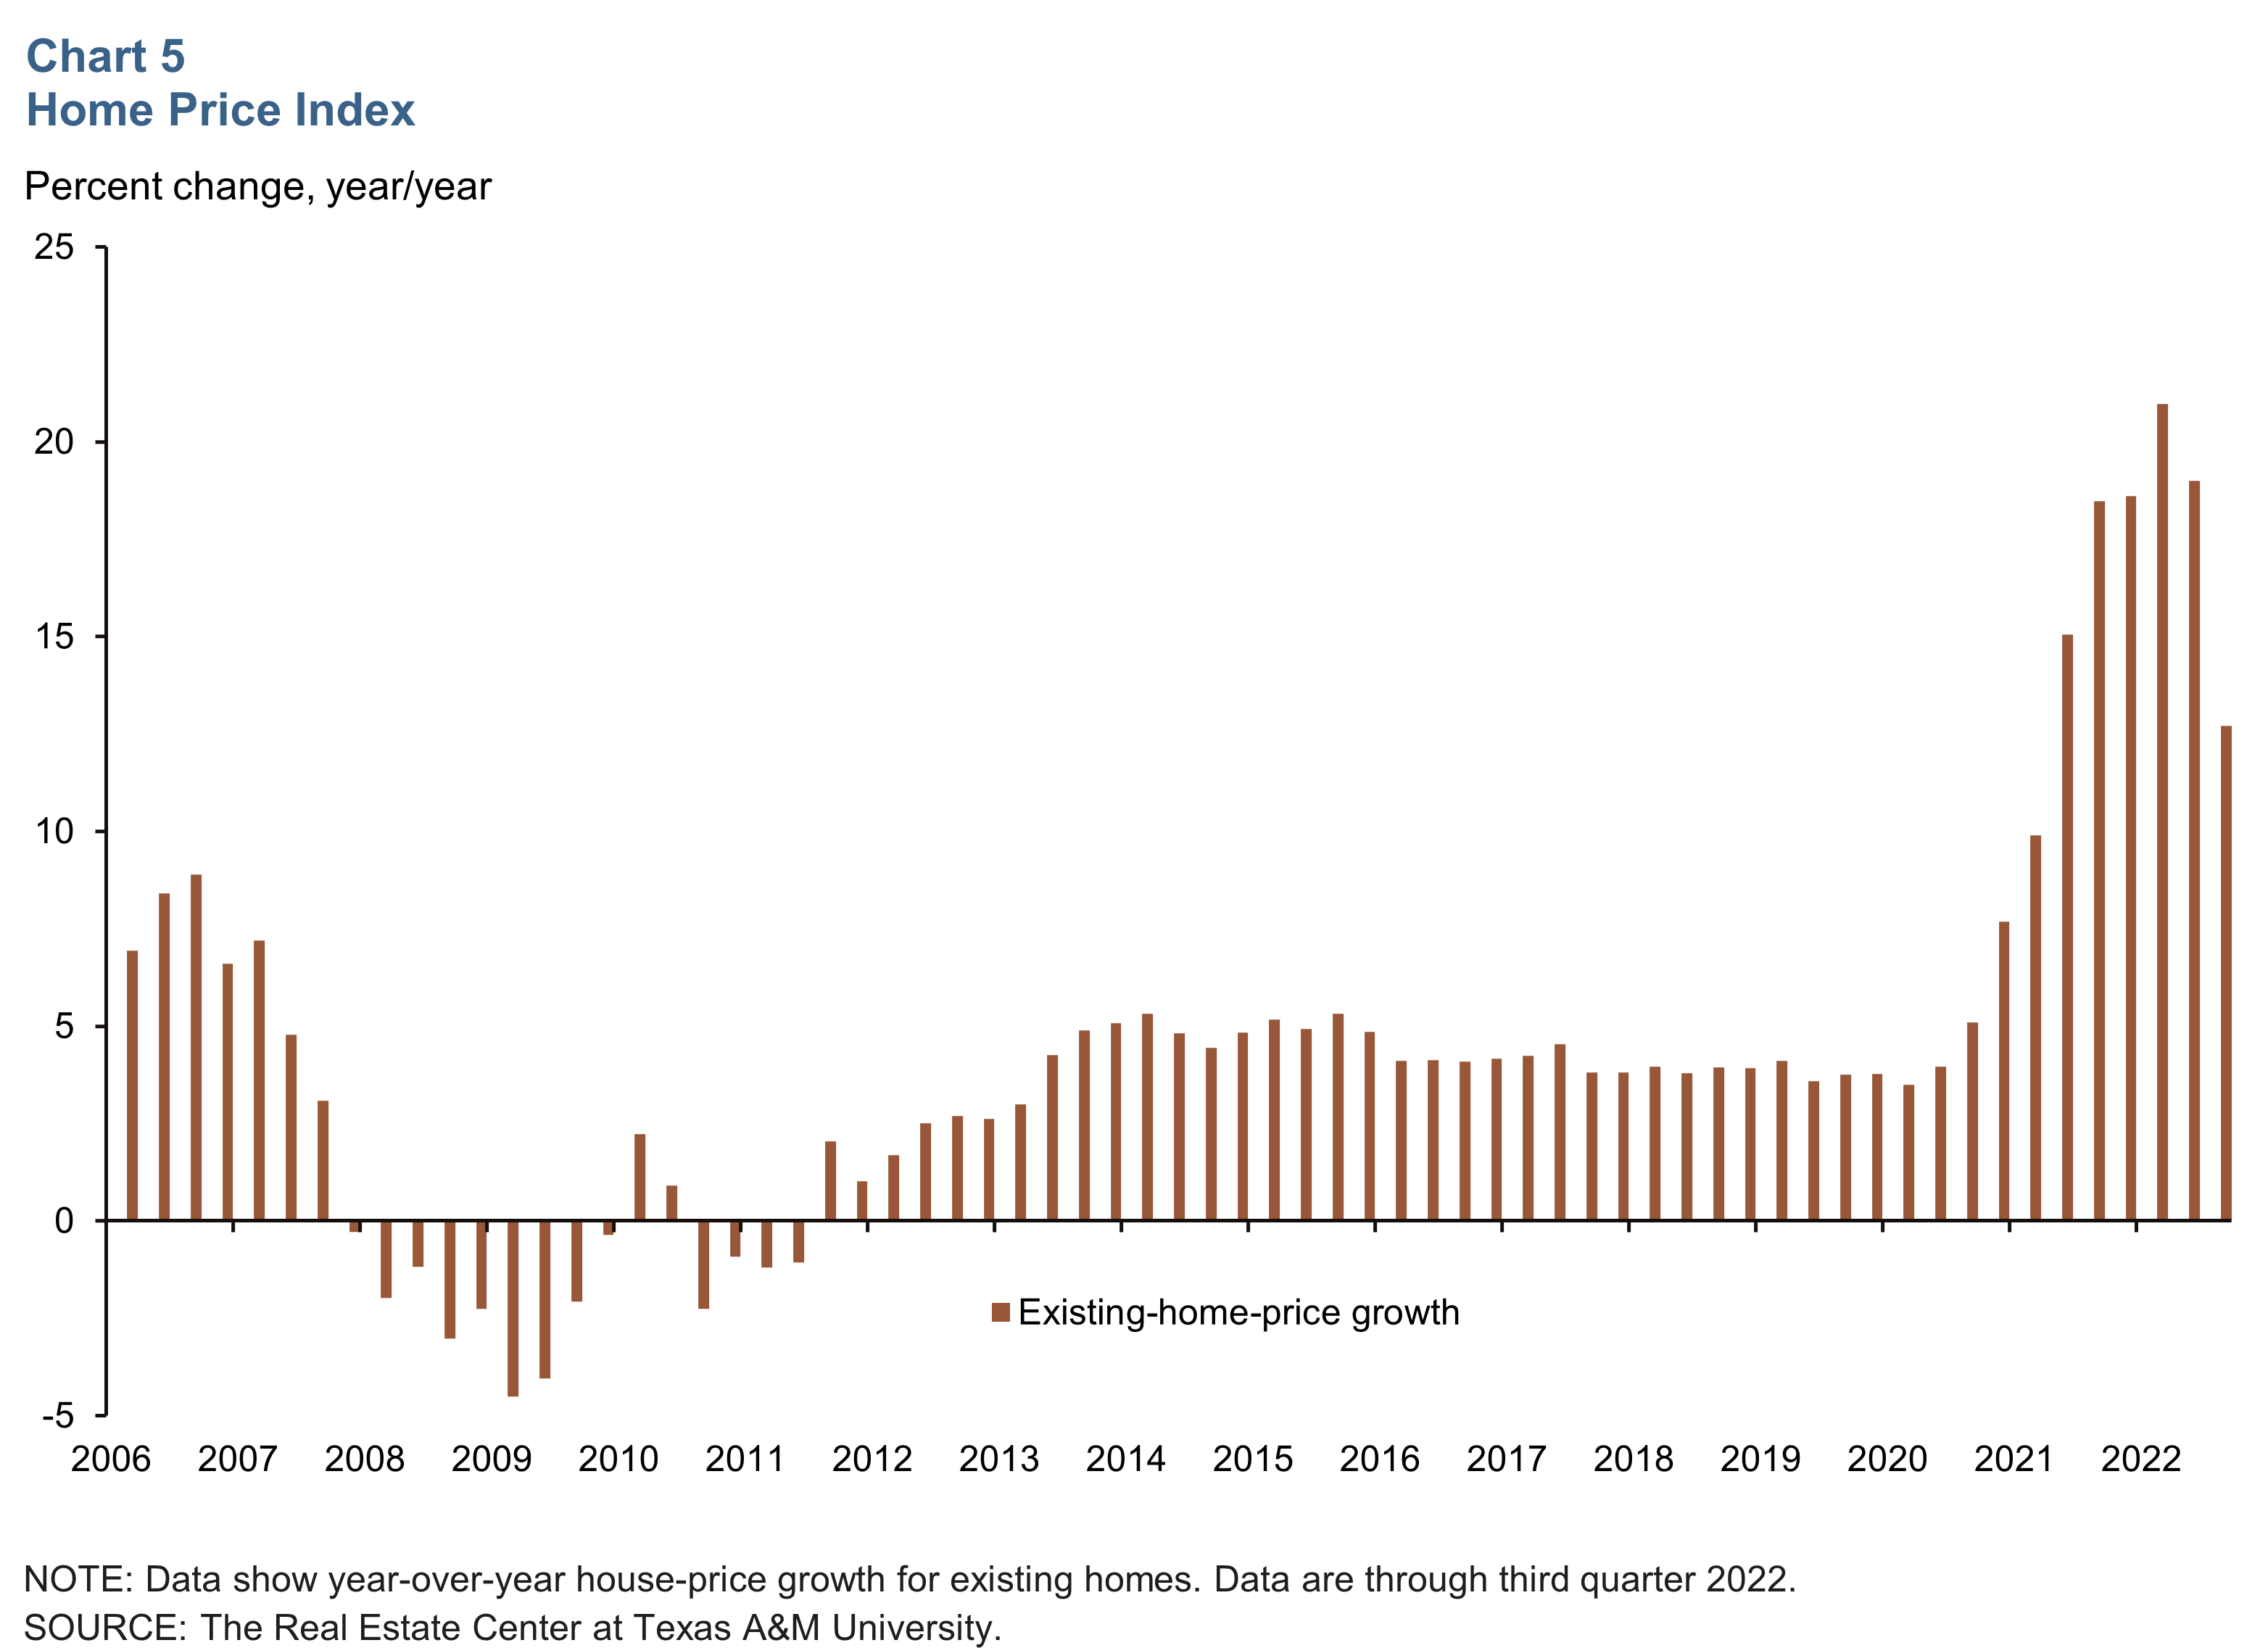
Home-price growth slows
Home-price growth slowed further during the third quarter based on the Home Price Index, a repeat sales index. Year-over-year home-price growth reached a peak at the start of the year and has now recorded declines for two straight quarters (Chart 5). In the third quarter, San Antonio’s Home Price Index grew by 12.7 percent, less than the peak growth rate of 21.0 percent in the first quarter.
NOTE: Data may not match previously published numbers due to revisions.
About San Antonio Economic Indicators
Questions or suggestions can be addressed to Vee Kalkunte at Prithvi.Kalkunte@dal.frb.org. San Antonio Economic Indicators is published every month during the week after state and metro employment data are released.