San Antonio Economic Indicators

January 6, 2022
| San Antonio Economy Dashboard (November 2022) | |||
| Job growth (annualized) Aug.–Nov. '22 |
Unemployment rate |
Avg. hourly earnings |
Avg. hourly earnings growth y/y |
| 5.0% | 3.6% | $27.88 | 6.2% |
The San Antonio economy continued to expand in November as nearly all sectors experienced employment gains, and the business-cycle index increased. As interest rates shot up and the housing market cooled, existing-home sales declined and rent growth steadied.
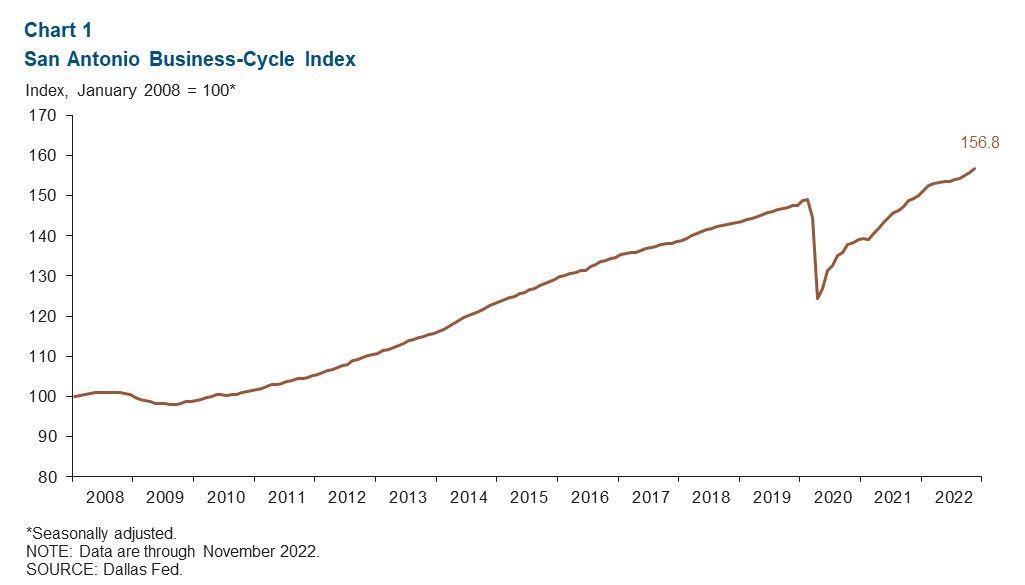
Business-cycle index
The San Antonio Business-Cycle Index —a broad measure of economic activity in the metro—grew an annualized 7.3 percent in November, faster than the 7.0 annualized growth in October (Chart 1).
Labor market
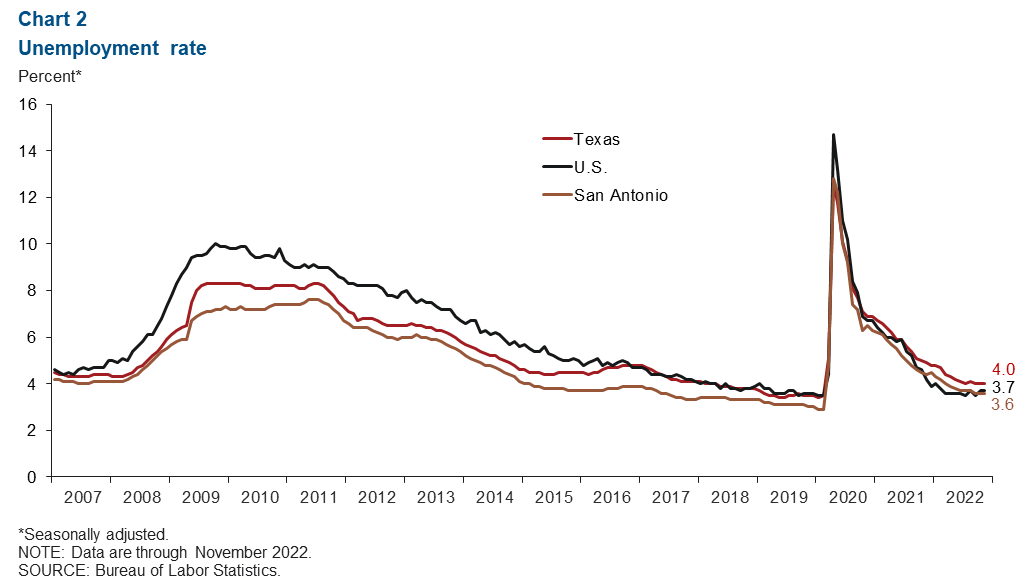
Unemployment rate stays steady
San Antonio’s unemployment rate remained at 3.6 percent in November (Chart 2). The metro’s jobless rate is lower than both the U.S. and the state figures of 3.7 percent and 4.0 percent, respectively. This month, San Antonio’s labor force grew at a 4.0 percent annualized rate.
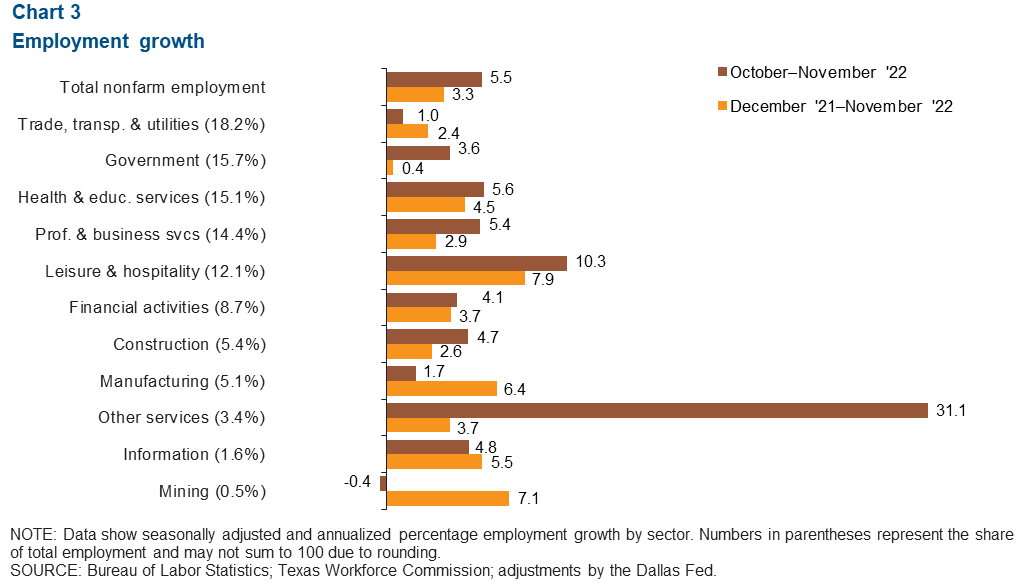
Jobs grow across sectors
San Antonio payrolls grew 5.5 percent from October to November (4,966 jobs) (Chart 3). All sectors except one experienced growth. Mining was the only sector to decline (0.4 percent or 2 jobs). Growth was led by other services (31.1 percent or 869 jobs), leisure and hospitality (10.3 percent or 1,146 jobs), and health and education services (5.6 percent or 781 jobs). Year over year, San Antonio experienced 3.3 percent payroll growth.
Shelter
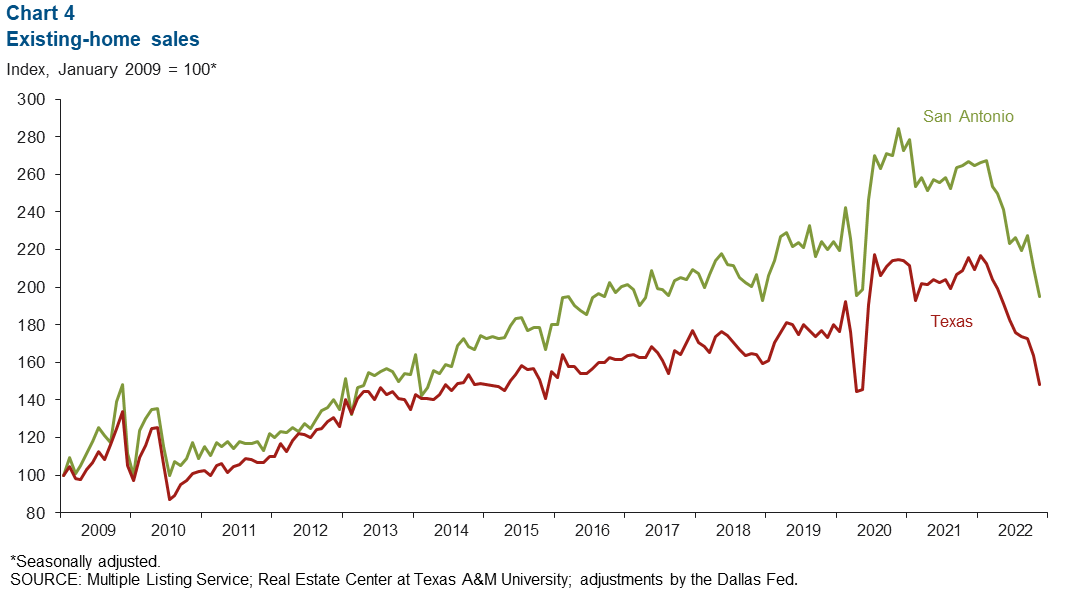
Existing-home sales decline to pandemic levels
San Antonio’s existing-home sales continued to decline during November, falling by 7.3 percent, slower than the 9.3 percent decrease statewide (Chart 4). Similarly, while San Antonio experienced a 26.9 percent decrease in existing-home sales year over year, it remained below the state’s decline of 31.3 percent. Now, existing-home sales rates in both San Antonio and Texas are at levels seen in early 2020.
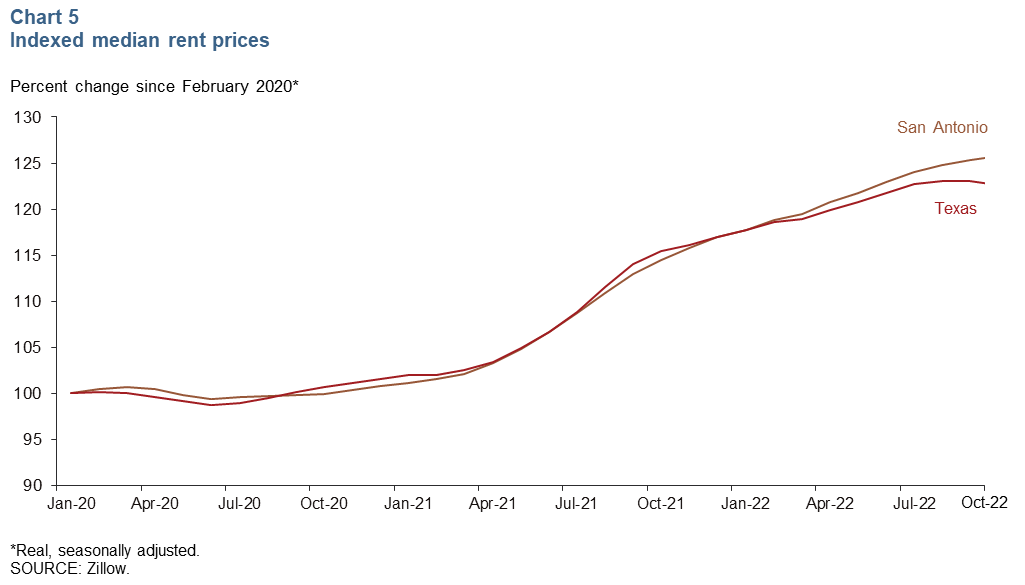
Rent prices steady
In November, San Antonio experienced a 0.7 percent increase in rent prices, less than the 2.1 percent rise for the state, and slower growth for the metro than prior months (Chart 5). Year over year, however, rent-price growth in San Antonio was 8.7 percent, greater than Texas’ 5.8 percent.
NOTE: Data may not match previously published numbers due to revisions.
About San Antonio Economic Indicators
Questions or suggestions can be addressed to Vee Kalkunte at Prithvi.Kalkunte@dal.frb.org. San Antonio Economic Indicators is published every month during the week after state and metro employment data are released.