San Antonio Economic Indicators

April 27, 2023
| San Antonio economy dashboard (March 2023) | |||
| Job growth (annualized) Jan.–March '23 |
Unemployment rate |
Avg. hourly earnings |
Avg. hourly earnings growth y/y |
| 3.5% | 3.5% | $27.78 | 1.3% |
The San Antonio economy grew in March, with average hourly earnings increasing, the unemployment rate decreasing and most sectors experiencing employment growth. In addition, existing-home sales increased, having rebounded since hitting bottom at the end of last year.
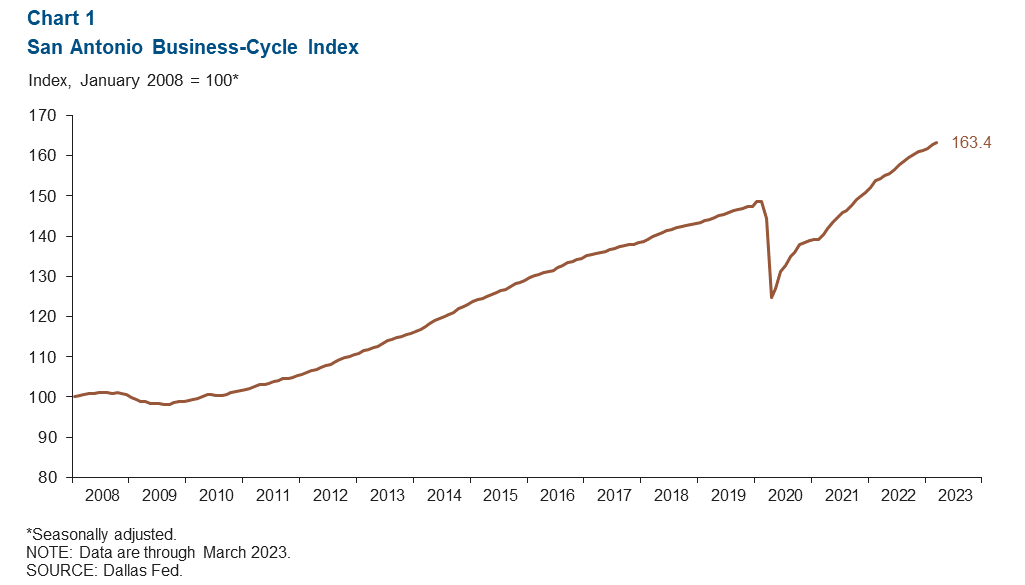
Business-cycle index
The San Antonio Business-Cycle Index increased 5.3 percent from February to March, which is less than the 6.2 percent increase from January to February (Chart 1).
Labor market
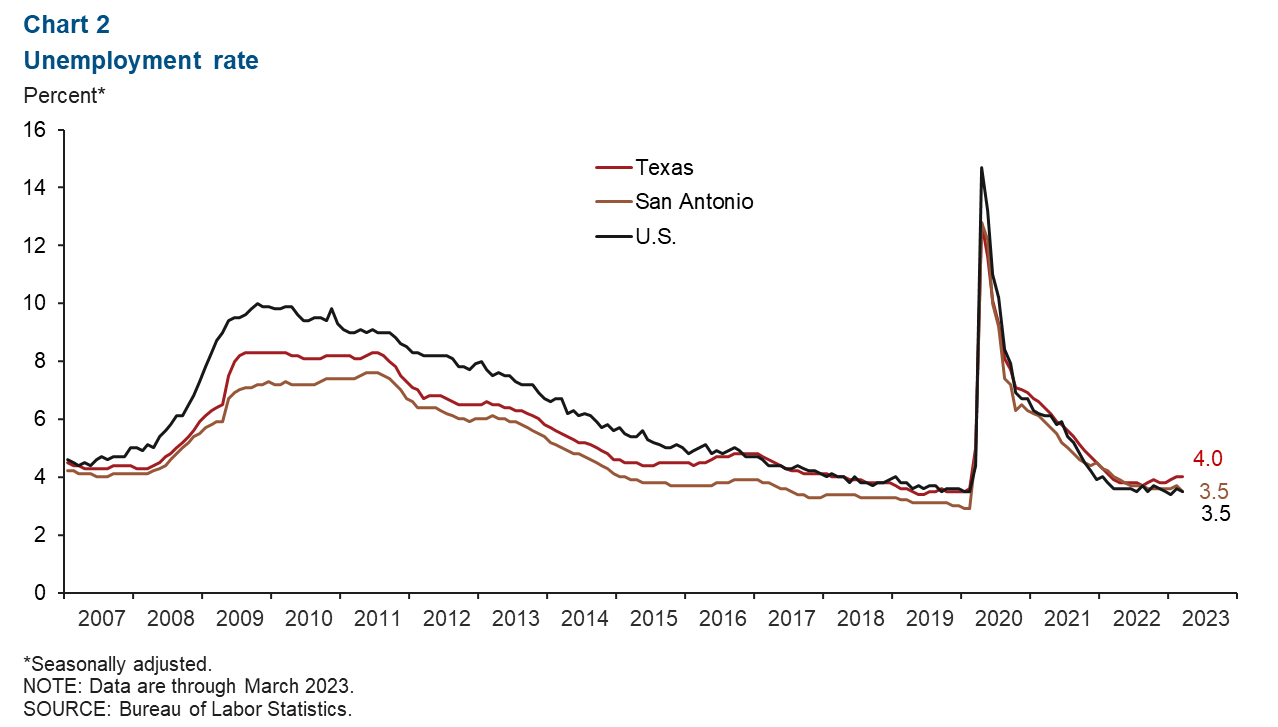
Unemployment rate drops
The San Antonio unemployment rate fell to 3.5 percent in March (Chart 2). The metro’s unemployment rate was the same as the U.S jobless rate of 3.5 percent but lower than the state’s 4.0 percent. This month, San Antonio’s labor force increased by an annualized 1.6 percent—slowing compared with the annualized year-to-date growth of 6.5 percent.
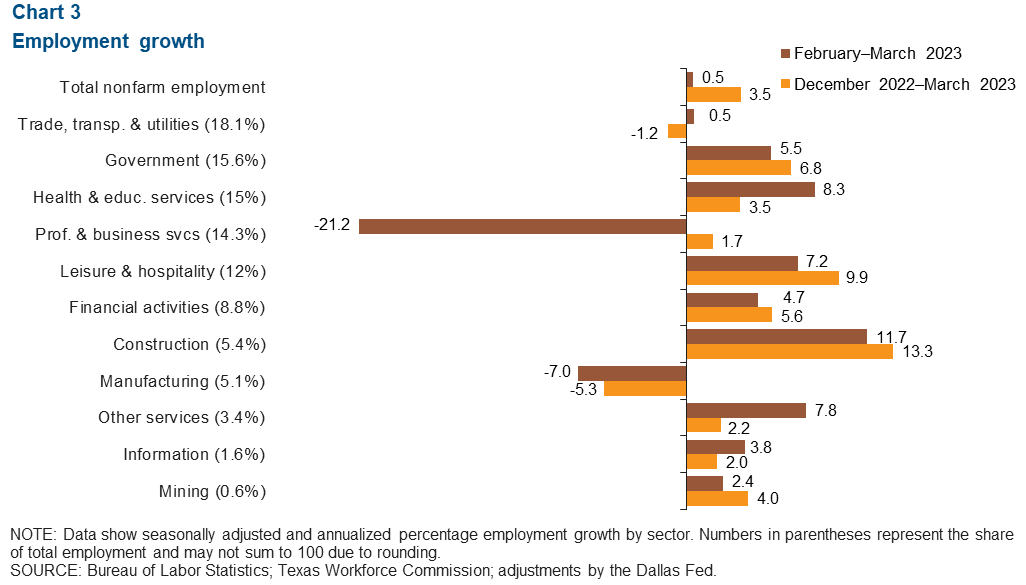
Payrolls tick up overall, but professional and business services plunges
San Antonio payrolls increased an annualized 0.5 percent from February to March (3,810 jobs) (Chart 3). Most sectors experienced growth, with construction (576 jobs, or 11.7 percent) and health and education services (837 jobs, or 7.2 percent) seeing the biggest gains. Sectors seeing decreases were professional and business services (3,215 jobs, or 21.2 percent), and manufacturing (348 jobs, or 7.0 percent). Professional and business services declines were largely driven by its subcategories of administrative support. Year to date, total nonfarm employment in San Antonio grew 3.5 percent—lower than Texas' rate of 3.9 percent but higher than the U.S.' 2.7 percent.
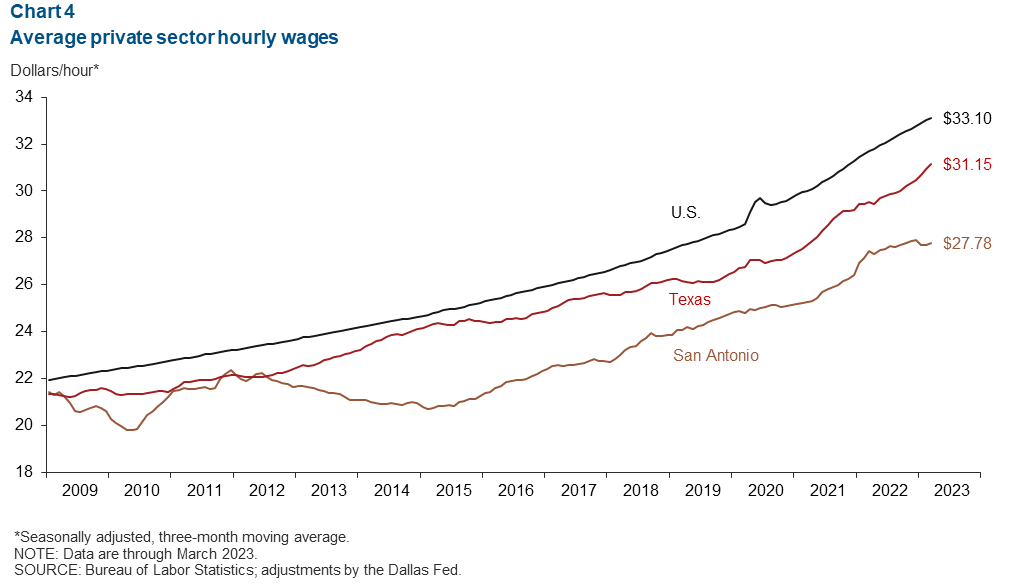
Wages improve
San Antonio wages increased 3.5 percent in March (Chart 4). The three-month moving average of wages in San Antonio was $27.78, below both the state average of $31.15 and the national average of $33.10. In the past year, San Antonio’s wages increased 1.3 percent—lower than gains of 5.4 percent in Texas and 4.4 percent in the U.S.
Real estate
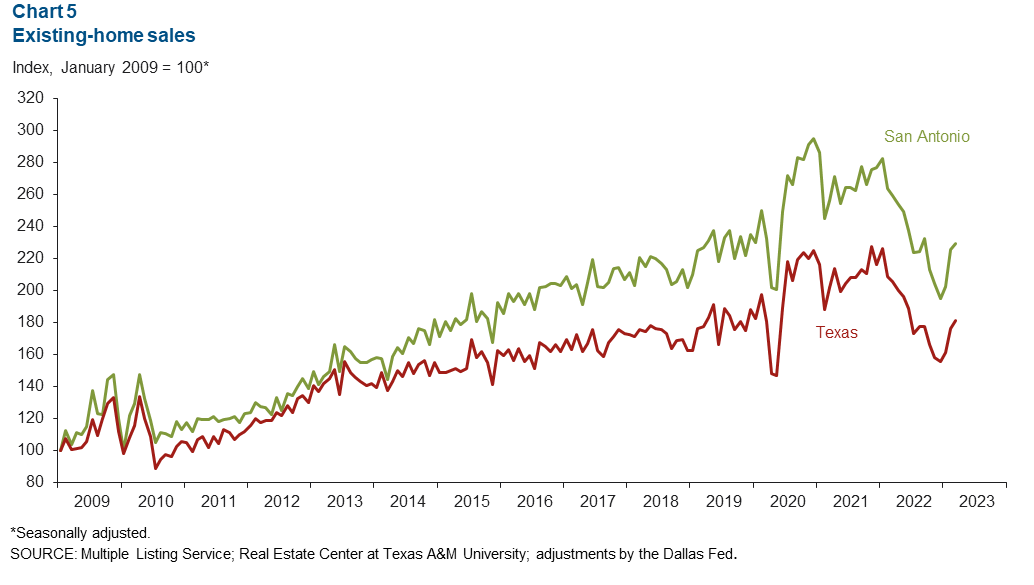
Existing-home sales edge up
San Antonio existing-home sales increased 1.5 percent in March after posting an 11.7 percent gain in February (Chart 5). Home sales have rebounded after reaching a trough at the end of 2022. Statewide, sales increased 2.6 percent, also recovering from the dip seen in late 2022. Year over year, the metro’s home sales were still down 11.6 percent, similar to the state’s decline of 11.9 percent.
NOTE: Data may not match previously published numbers due to revisions.
About San Antonio Economic Indicators
Questions or suggestions can be addressed to Vee Kalkunte at Prithvi.Kalkunte@dal.frb.org. San Antonio Economic Indicators is published every month during the week after state and metro employment data are released.