San Antonio Economic Indicators

| San Antonio economy dashboard (May 2023) | |||
| Job growth (annualized) Feb.–May '23 |
Unemployment rate |
Avg. hourly earnings |
Avg. hourly earnings growth y/y |
| 5.0% | 4.0% | $27.94 | 1.6% |
San Antonio job growth accelerated as nearly all sectors experienced growth in May, and wages continued to rise but at a slower rate than in the prior month. In addition, the business-cycle index rose and existing-home sales increased. However, unemployment went up.
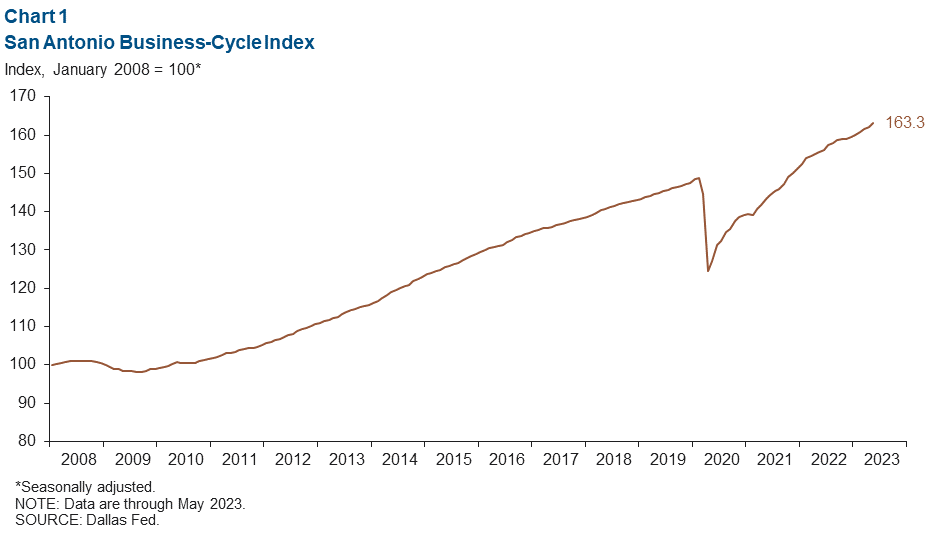
Business-cycle index
The San Antonio Business-Cycle Index—a gauge of economic conditions in the metro—increased 7.9 percent from April to May, up from the 5.7 percent increase from March to April (Chart 1).
Labor market
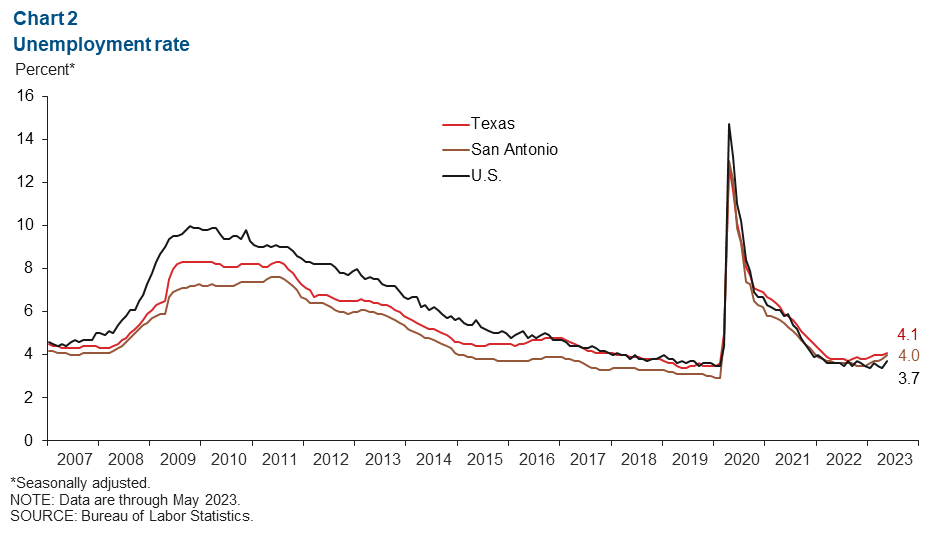
Unemployment rate increases
The San Antonio unemployment rate rose from 3.8 in April to 4.0 percent in May (Chart 2). The metro’s jobless rate was higher than the U.S. rate of 3.7 percent but lower than the state’s 4.1 percent reading. In May, San Antonio’s labor force increased an annualized 4.0 percent—slower than the annualized year-to-date growth of 5.3 percent.
Employment expands in May
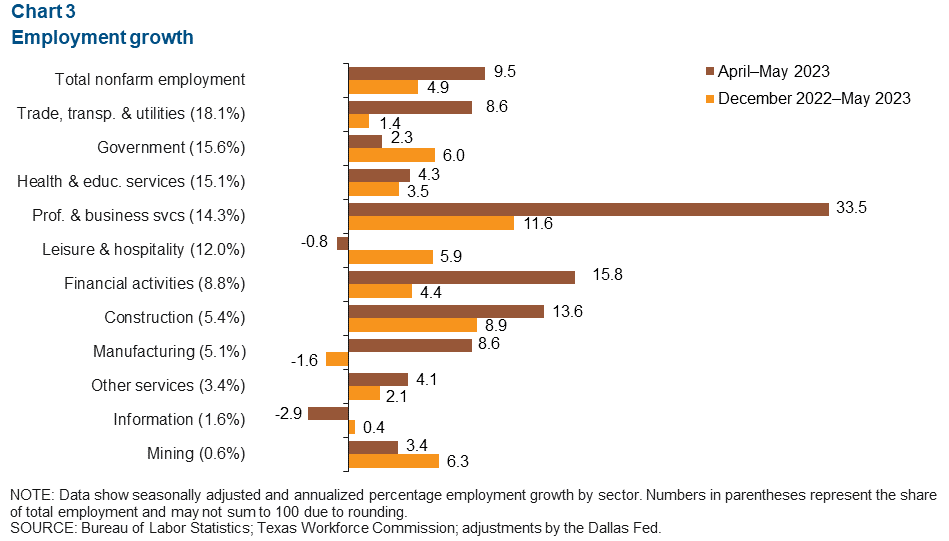
San Antonio payrolls increased an annualized 9.5 percent from April to May (8,748 jobs) (Chart 3). Most sectors saw job gains, though the greatest growth was in professional and business services (3,987 jobs, or 33.5 percent) and financial activities (1,243 jobs, or 15.8 percent). The sectors seeing decreases were information services (47 jobs, or 2.9 percent) and leisure and hospitality (97 jobs, or 0.8 percent). Year to date, total nonfarm employment has grown 4.9 percent in San Antonio, compared with 2.5 percent in the U.S. and 3.6 percent in Texas.
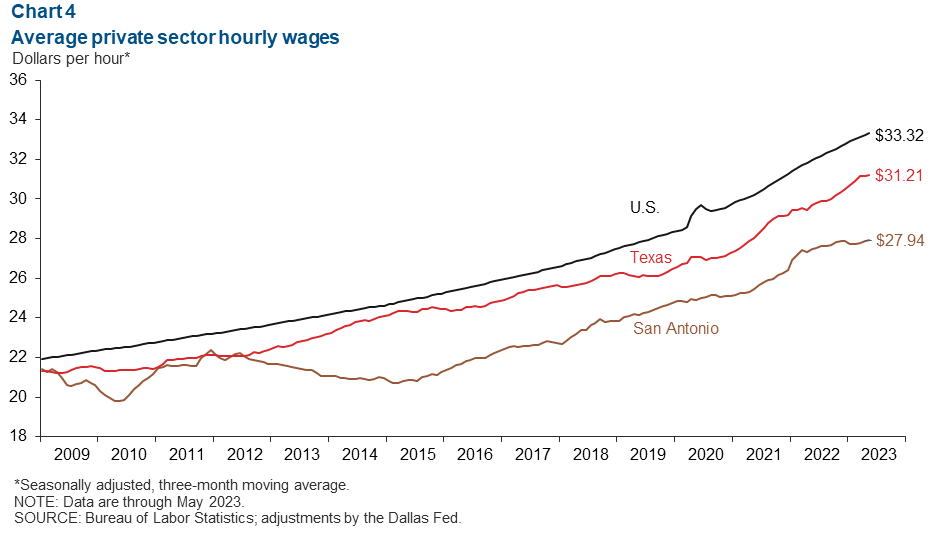
San Antonio wages rise
San Antonio wages increased an annualized 3.0 percent in May (Chart 4). The three-month moving average of hourly wages was $27.94, below both the state average of $31.21 and the national average of $33.32. In the past year, San Antonio’s wages have increased 1.6 percent—less than gains of 5.2 percent in Texas and 4.3 percent in the U.S.
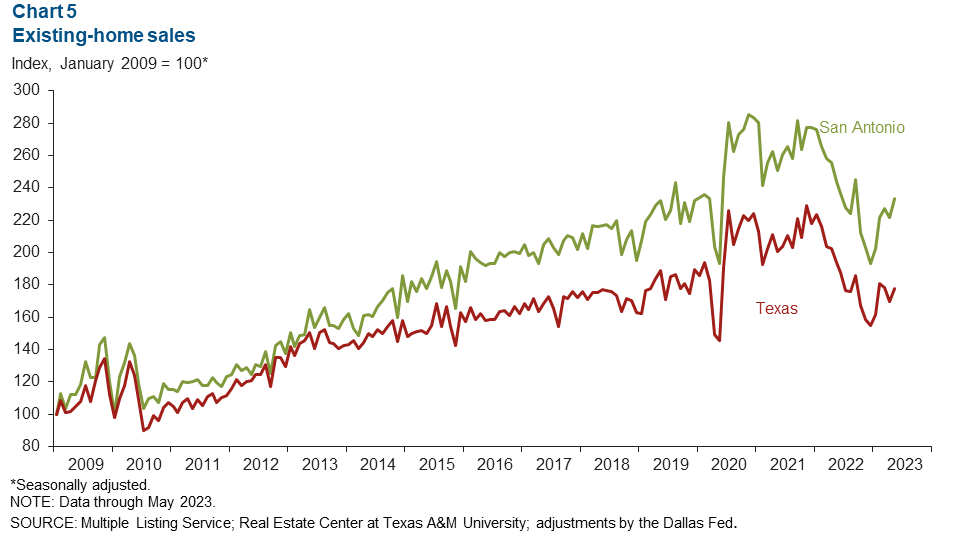
Home sales
San Antonio existing-home sales moved up 5.3 percent in May (Chart 5). Sales continue to rebound from the trough reached in December of 2022. Home sales have rebounded faster in San Antonio than the state; year-to-date existing-home sales are up 20.7 percent versus 14.6 percent in Texas.
NOTE: Data may not match previously published numbers due to revisions.
About San Antonio Economic Indicators
Questions or suggestions can be addressed to Vee Kalkunte at Prithvi.Kalkunte@dal.frb.org. San Antonio Economic Indicators is published every month during the week after state and metro employment data are released.