San Antonio Economic Indicators

| San Antonio economy dashboard (July 2023) | |||
| Job growth (annualized) April–July '23 |
Unemployment rate |
Avg. hourly earnings |
Avg. hourly earnings growth y/y |
| 1.2% | 4.4% | $28.09 | 1.6% |
San Antonio payroll jobs declined in July as the region experienced employment contraction across most sectors. Unemployment jumped as jobs declined and the labor force expanded at the fastest pace since the recovery from the pandemic shutdown in early 2020. Retail sales tax revenue continued to decline in July.
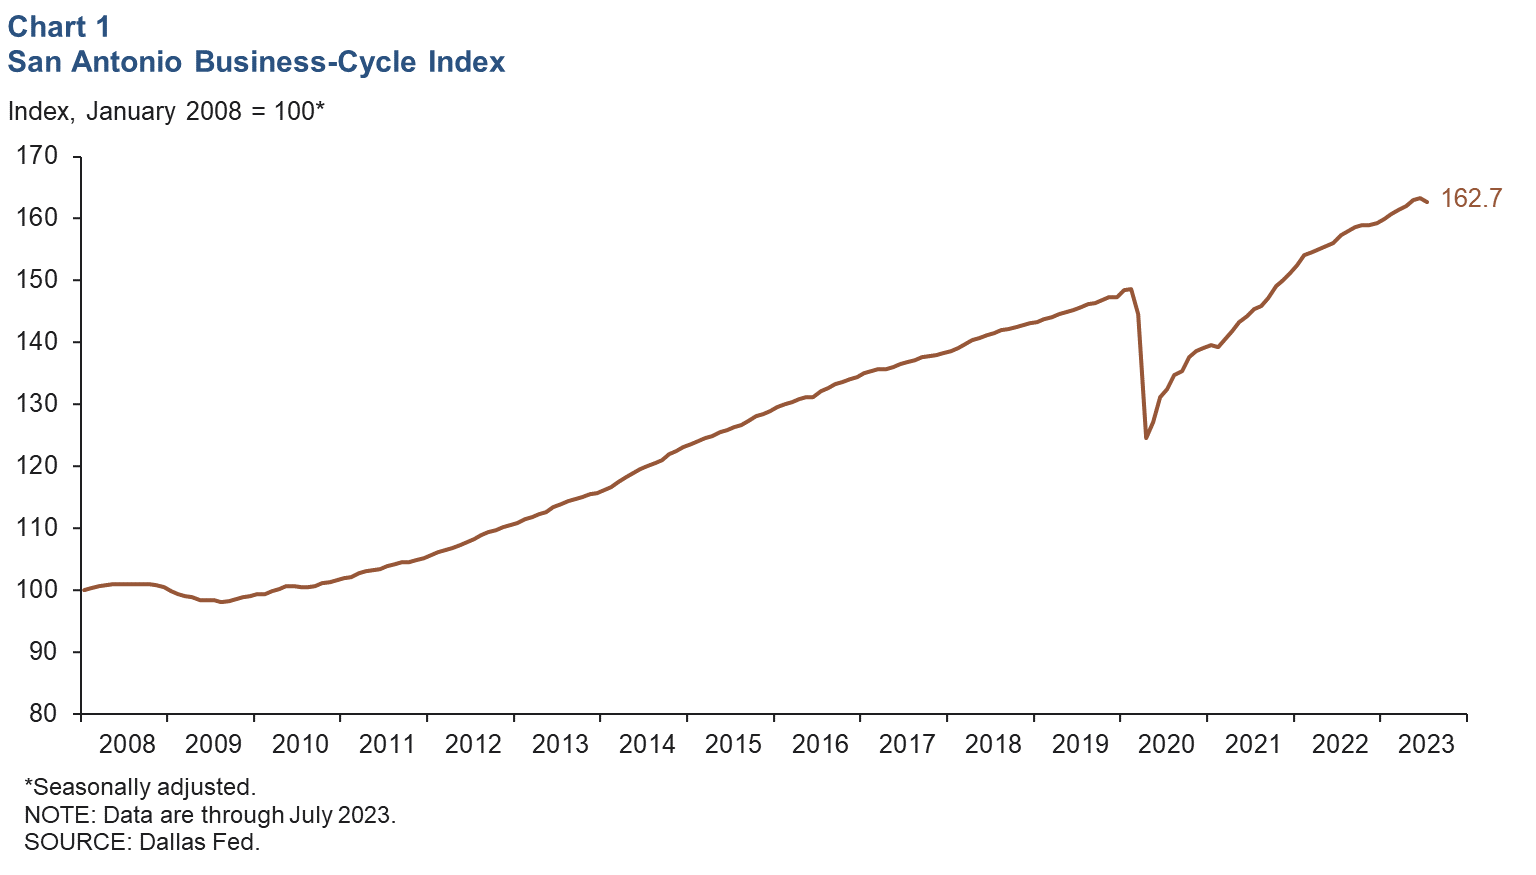
Business-cycle index
The San Antonio Business-Cycle Index—a gauge of economic conditions in the metro—declined an annualized 4.8 percent from June to July, compared with a 3.1 percent increase from May to June (Chart 1).
Labor market
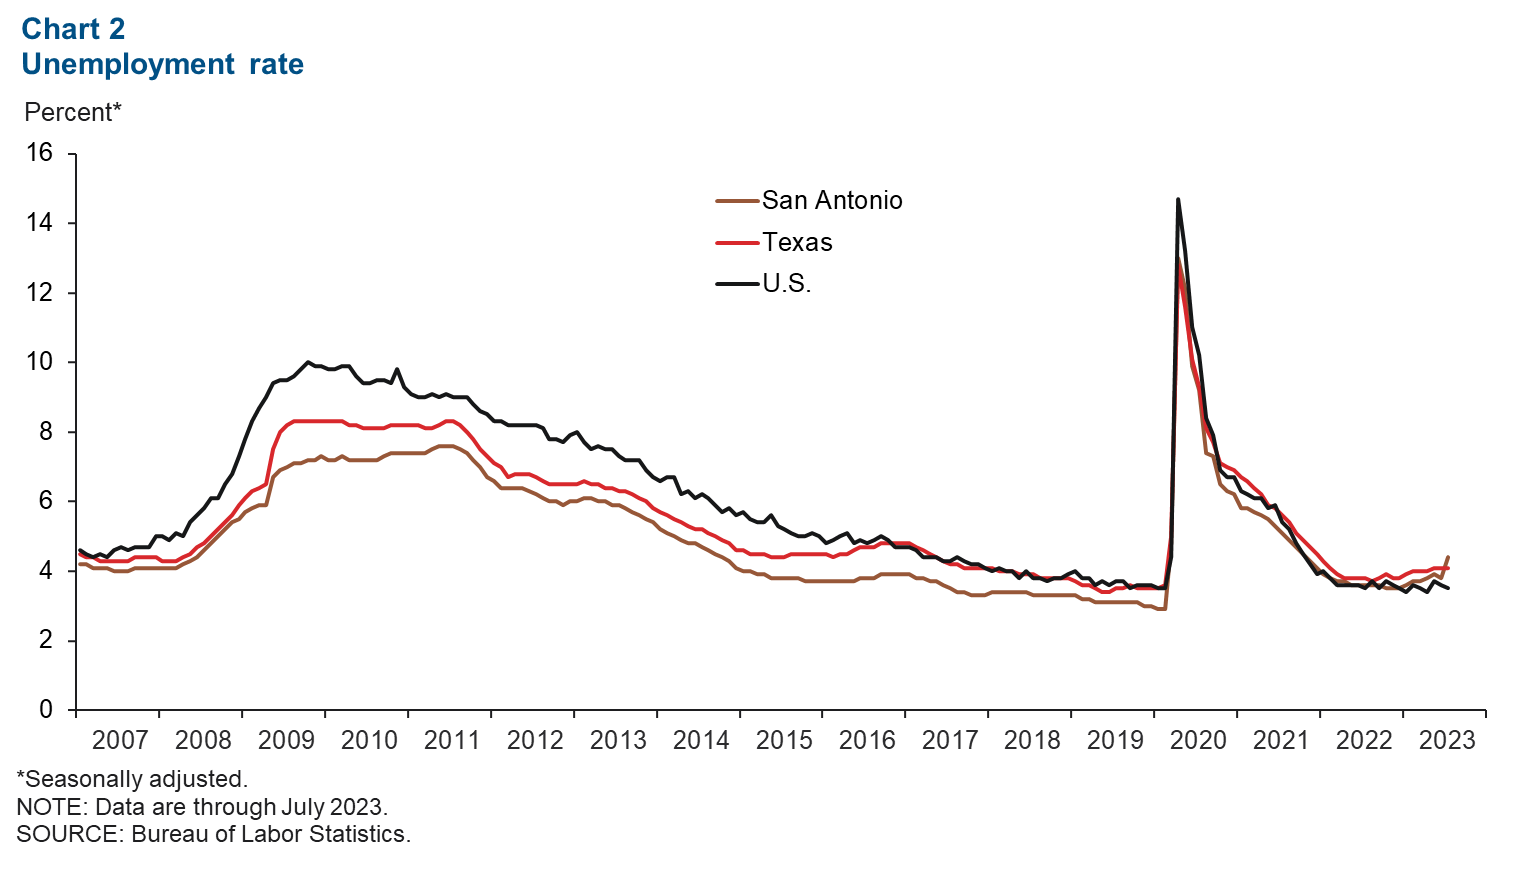
Unemployment rate rises
The San Antonio unemployment rate rose to 4.4 percent in July from 3.8 percent in June largely due to changes in the civilian labor force (Chart 2). The jobless rate is now higher in the region than in the state (4.1 percent) and the U.S. (3.5 percent). In July, San Antonio’s labor force increased an annualized 14.0 percent following June’s 6.2 percent decline.
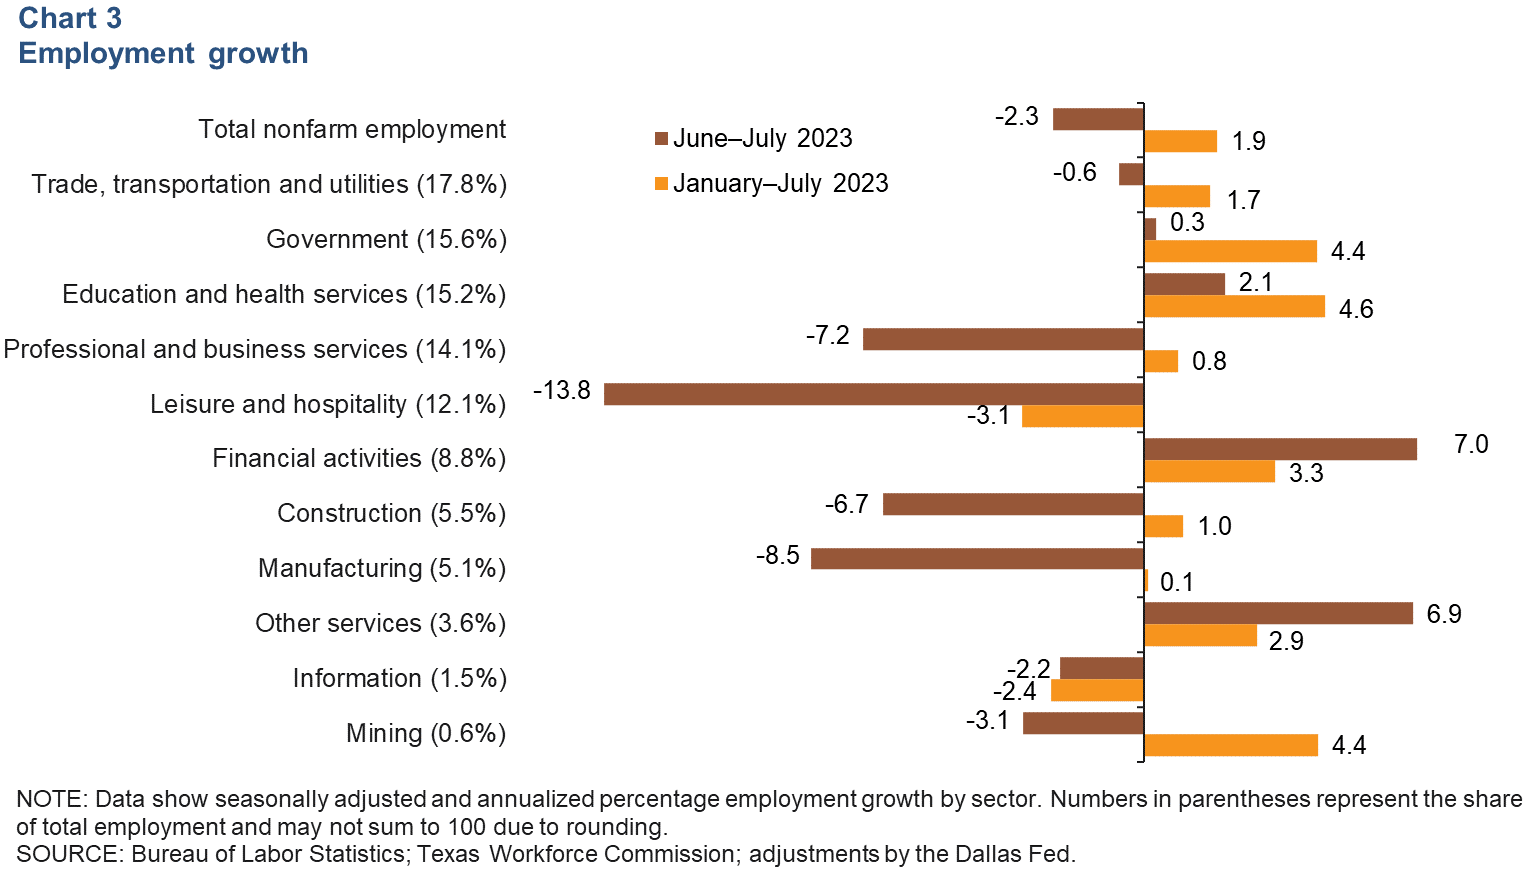
Employment growth trending down
San Antonio payrolls decreased an annualized 2.3 percent from June to July (2,279 jobs) (Chart 3). Job losses were led by the leisure and hospitality sector (13.8 percent, or 1,738 jobs), manufacturing (8.5 percent, or 441 jobs), and professional and business services (7.2 percent, or 1,011 jobs). Financial activities experienced the most growth (7.0 percent, or 570 jobs), and was closely followed by other services with 6.9 percent growth (228 jobs). The government sector (0.3 percent, or 44 jobs) and education and health services (2.1 percent, or 300 jobs) were the two remaining sectors with positive month-over-month growth; all other sectors experienced contraction. Year to date, total nonfarm employment has grown 1.9 percent in San Antonio, compared with gains of 2.5 percent in Texas and 1.5 percent in the U.S.
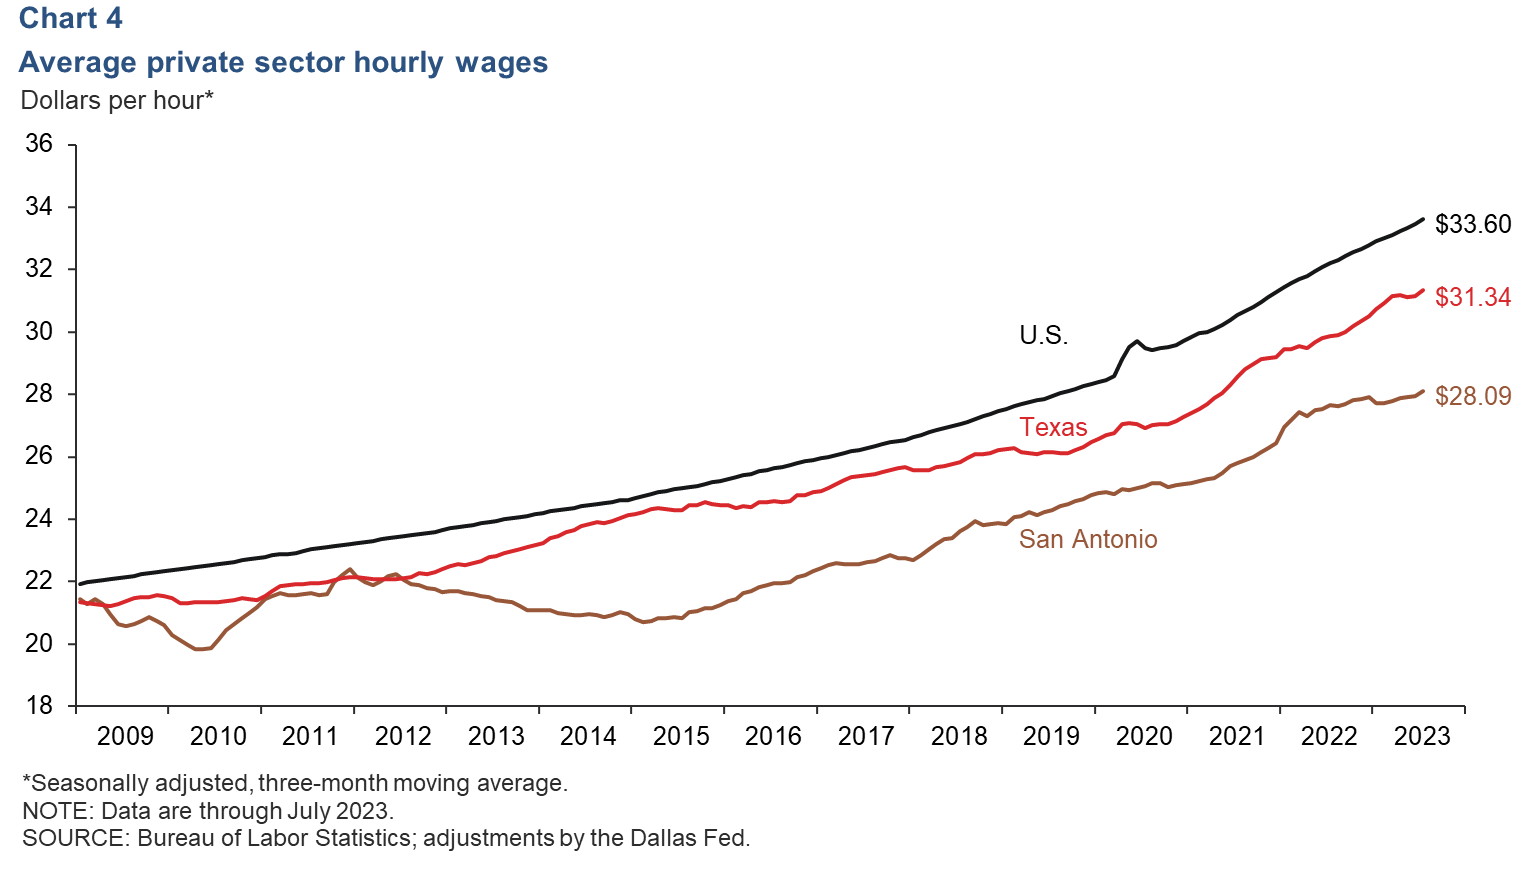
San Antonio wages increase
San Antonio wages increased an annualized 6.6 percent in July, slower than the entire state of Texas (8.3 percent), but faster than the nation (5.1 percent). The three-month moving average of hourly wages was $28.09, below both the state average of $31.34 and the national average of $33.60 (Chart 4). In the past year, San Antonio’s wages have increased 1.6 percent—less than gains of 4.9 percent in Texas and 4.4 percent in the U.S.
Sales tax revenue
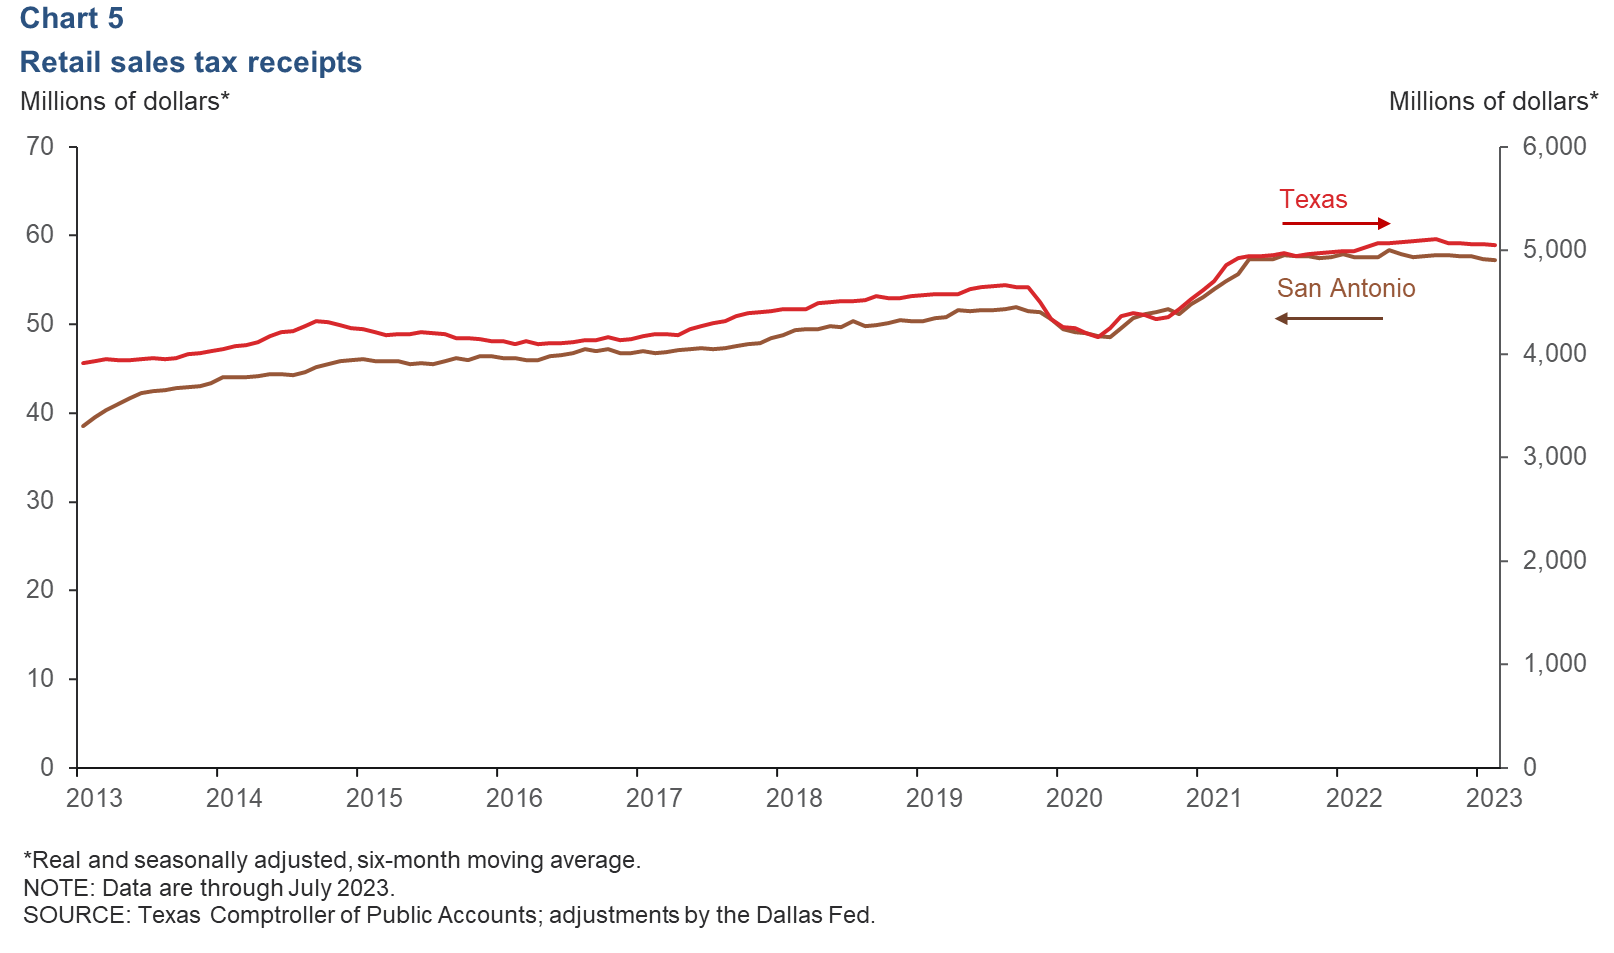
Retail sales tax revenue declines
San Antonio’s revenue from sales tax, adjusted for inflation, fell 2.1 percent in July (Chart 5), narrower than the state’s decline of 2.9 percent. However, for San Antonio, July marks the fourth month that the six-month moving average of tax receipts declined, while tax receipts declined slightly and then stabilized for the entire state over the same period. Tax revenue in San Antonio is down 0.5 percent compared with last year, and tax revenue is up 1.1 percent for Texas.
NOTE: Data may not match previously published numbers due to revisions.
About San Antonio Economic Indicators
Questions or suggestions can be addressed to Mariam Yousuf at Mariam.Yousuf@dal.frb.org. San Antonio Economic Indicators is published every month during the week after state and metro employment data are released.