San Antonio Economic Indicators

| San Antonio economy dashboard (August 2023) | |||
| Job growth (annualized) May–August '23 |
Unemployment rate |
Avg. hourly earnings |
Avg. hourly earnings growth y/y |
| -0.7% | 3.9% | $28.26 | 2.5% |
San Antonio payroll jobs increased in August after two months of contraction. The increase was driven by the leisure and hospitality sector and was offset by losses in the professional and business services. Despite the gains in employment, unemployment stayed steady as the labor force expanded. Retail sales tax revenue continued to decline in August.
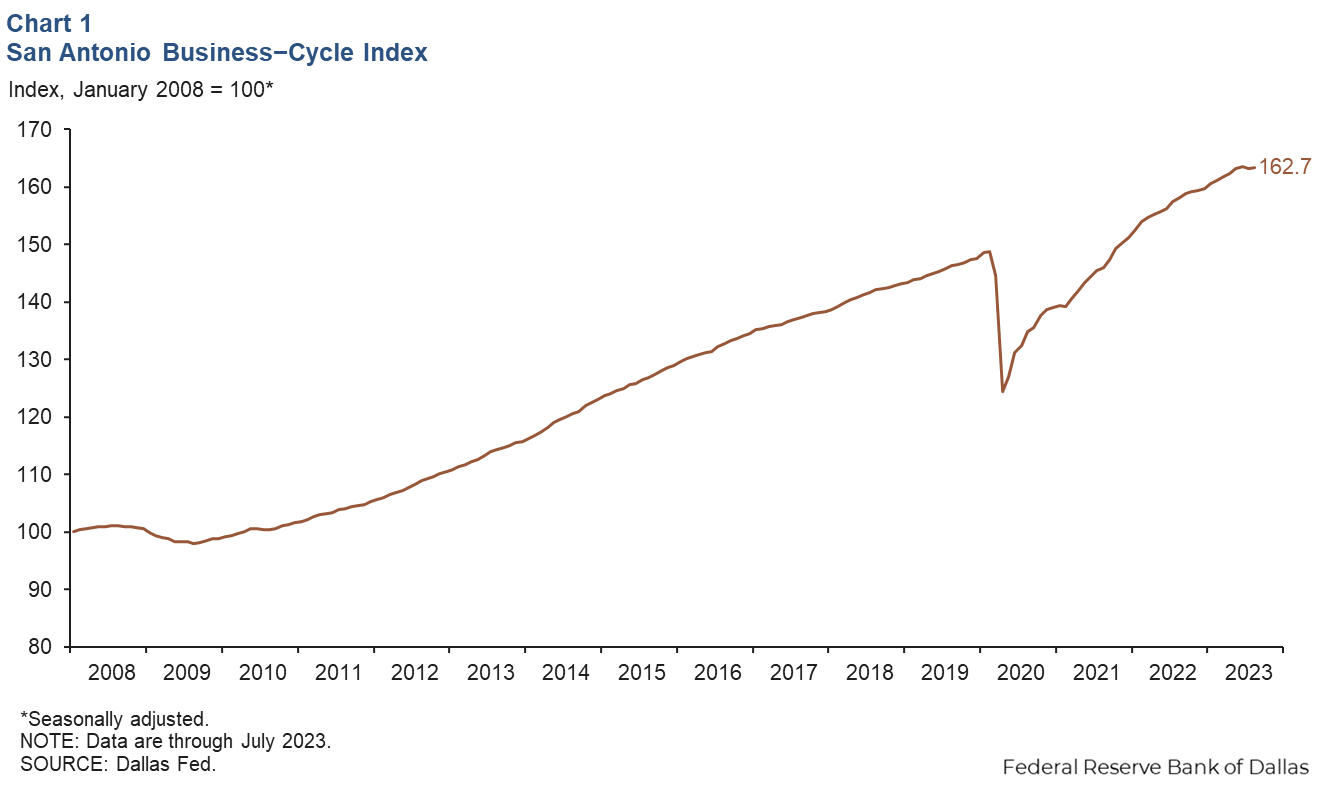
Business-cycle index
The San Antonio Business-Cycle Index, a gauge of economic conditions in the metro area, increased an annualized 1.5 percent from July to August compared with a 2.1 percent decline from June to July (Chart 1). Year to date, the index is up 3.0 percent annualized.
Labor market
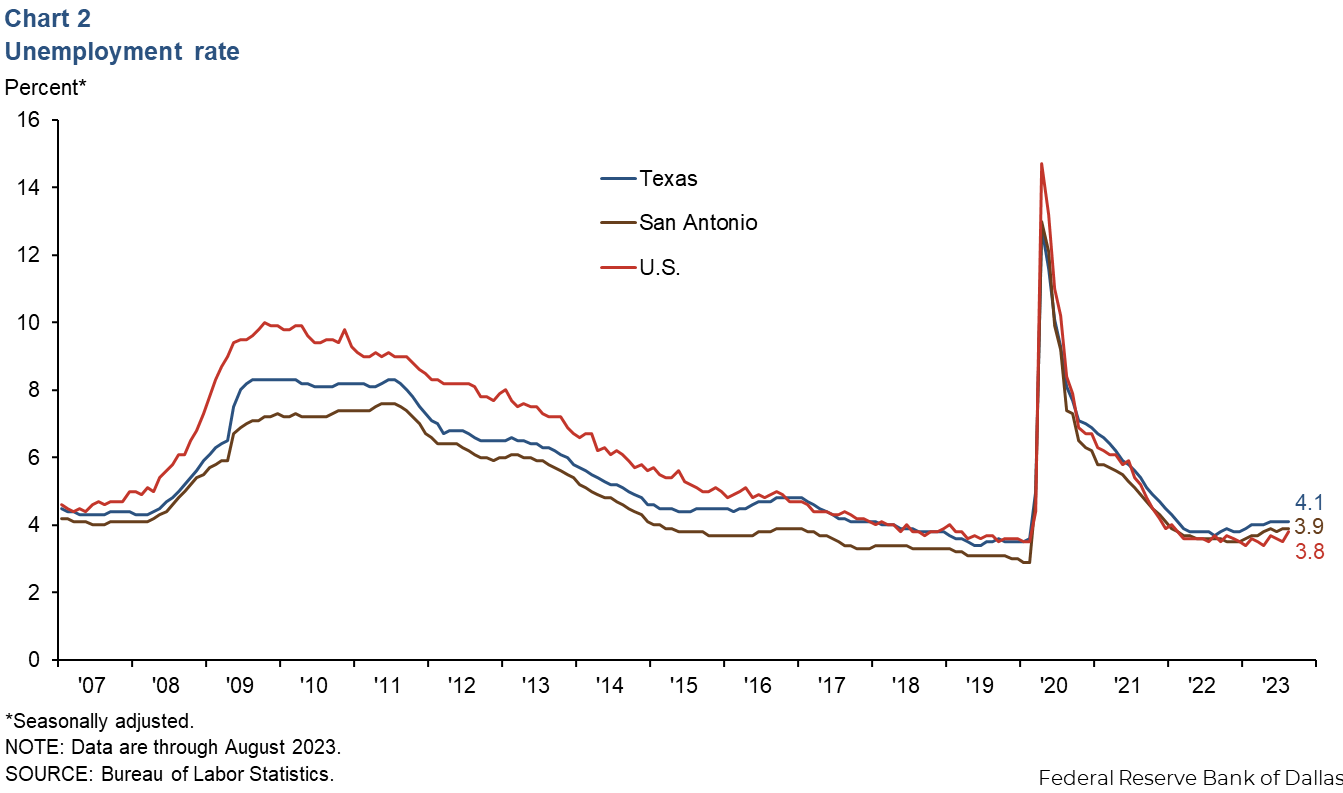
Unemployment rate remains flat
The San Antonio unemployment rate stayed steady at 3.9 percent in August after the July rate was revised down from 4.4 percent to 3.9 percent (Chart 2). The jobless rate is lower in the region than in the state (4.1 percent) and slightly above the U.S. (3.8 percent). In August, San Antonio’s labor force increased an annualized 4.5 percent; these gains offset the payroll growth, leading to a steady unemployment rate.
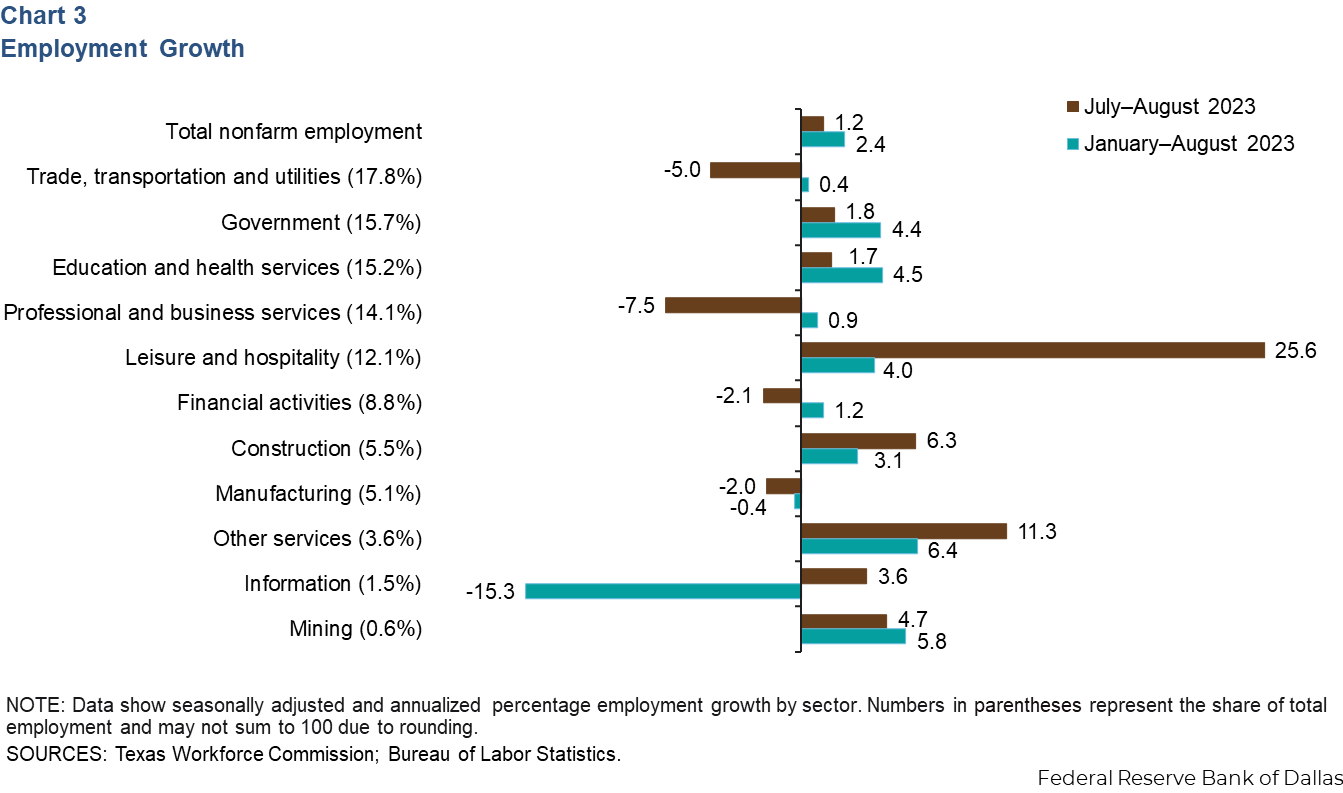
Employment growth trends up
San Antonio payrolls increased an annualized 1.2 percent from July to August (1,147 jobs) (Chart 3). Job gains were driven by the leisure and hospitality sector (25.6 percent, or 2,677 jobs), other services (11.3 percent, or 371 jobs) and construction (6.3 percent, or 326 jobs). These gains were offset by losses in professional and business services (7.5 percent, or 1,058 jobs), trade, transportation and utilities (5 percent, or 878 jobs), financial activities (2.1 percent, or 179 jobs) and manufacturing (2 percent, or 97 jobs). All the remaining sectors experienced expansion. While the growth in leisure and hospitality employment appears large, year to date, the sector is up only 4.0 percent. Year to date, total nonfarm employment has grown 2.4 percent in San Antonio, compared with gains of 3.3 percent in Texas and 1.8 percent in the U.S.
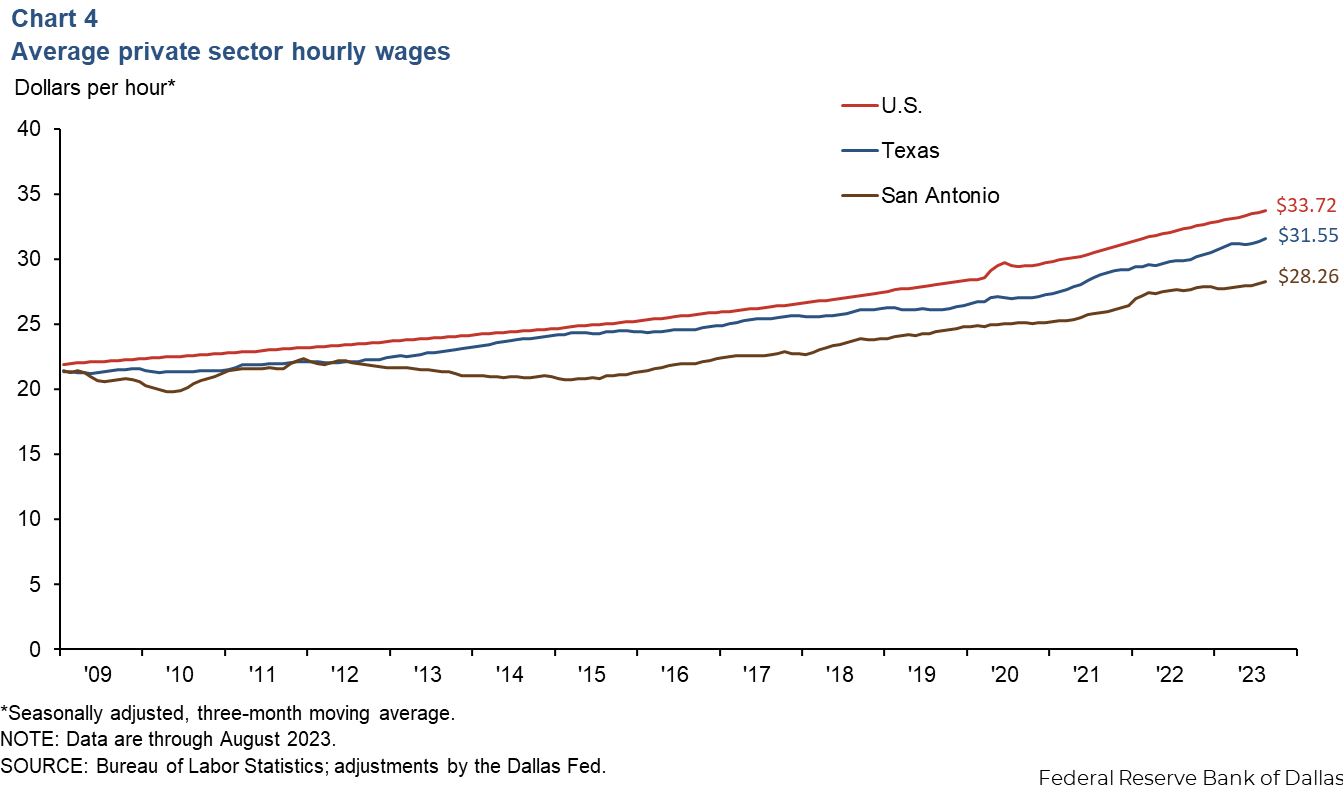
San Antonio wages rise
San Antonio wages rose an annualized 7.7 percent in August, slower than Texas (8.2 percent), but faster than the nation (4.5 percent). The three-month moving average of hourly wages in San Antonio was $28.26, below both the state average of $31.55 and the national average of $33.72 (Chart 4). In the past year, wages in San Antonio have risen 2.5 percent, slower than in Texas at 5.5 percent and in the U.S. at 4.4 percent.
Sales tax revenue and spending
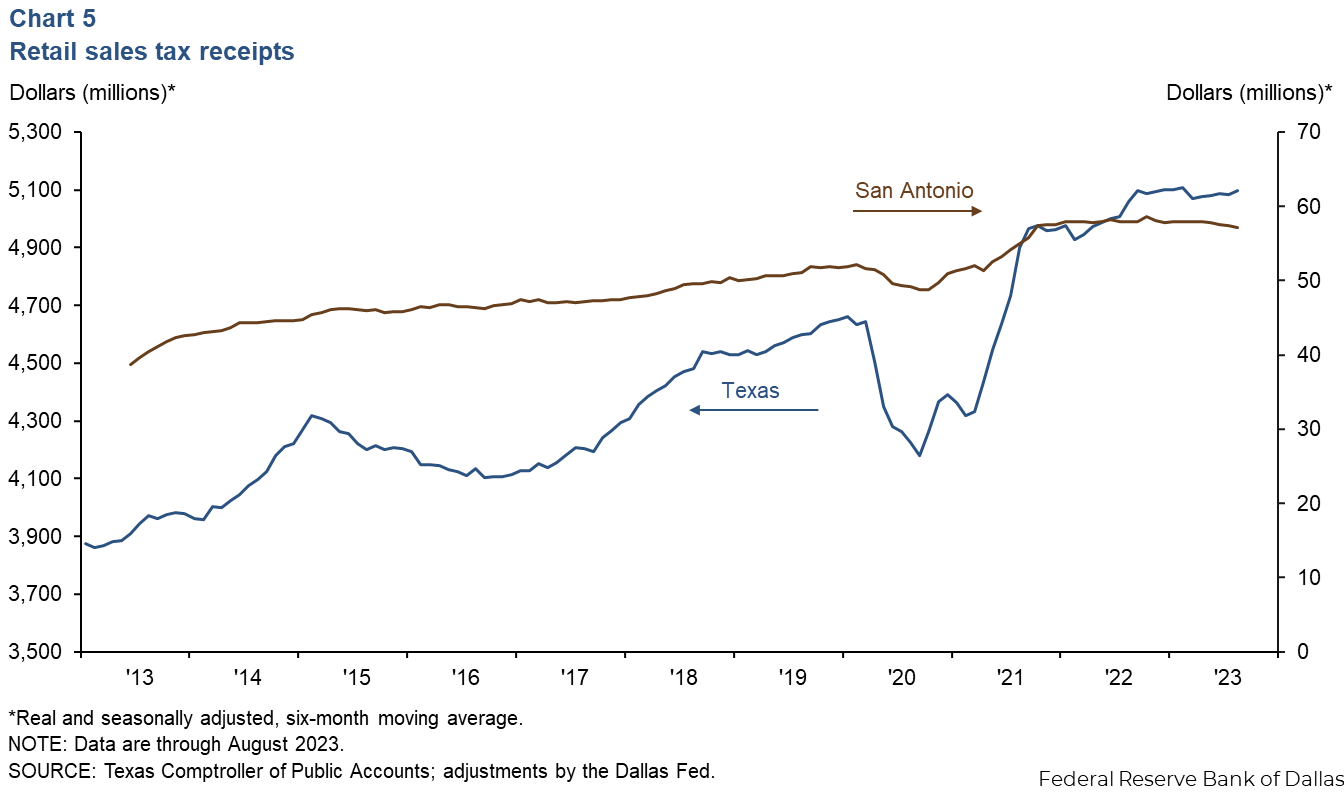
Retail sales tax revenue declines
San Antonio’s revenue from sales tax, adjusted for inflation, fell an annualized 5.0 percent in August, while the state’s rose 3.0 percent (Chart 5). The city’s decline is more than double its 2.2 percent decline in July. Month-over-month changes of this magnitude have occurred in the past three years, but despite the fluctuations, the long-run trend had been positive. This changed in 2023 when year-over-year tax revenue began shrinking in San Antonio. Tax revenue in San Antonio was down 1.6 percent compared with last year, while in Texas, tax revenue was up 0.8 percent.
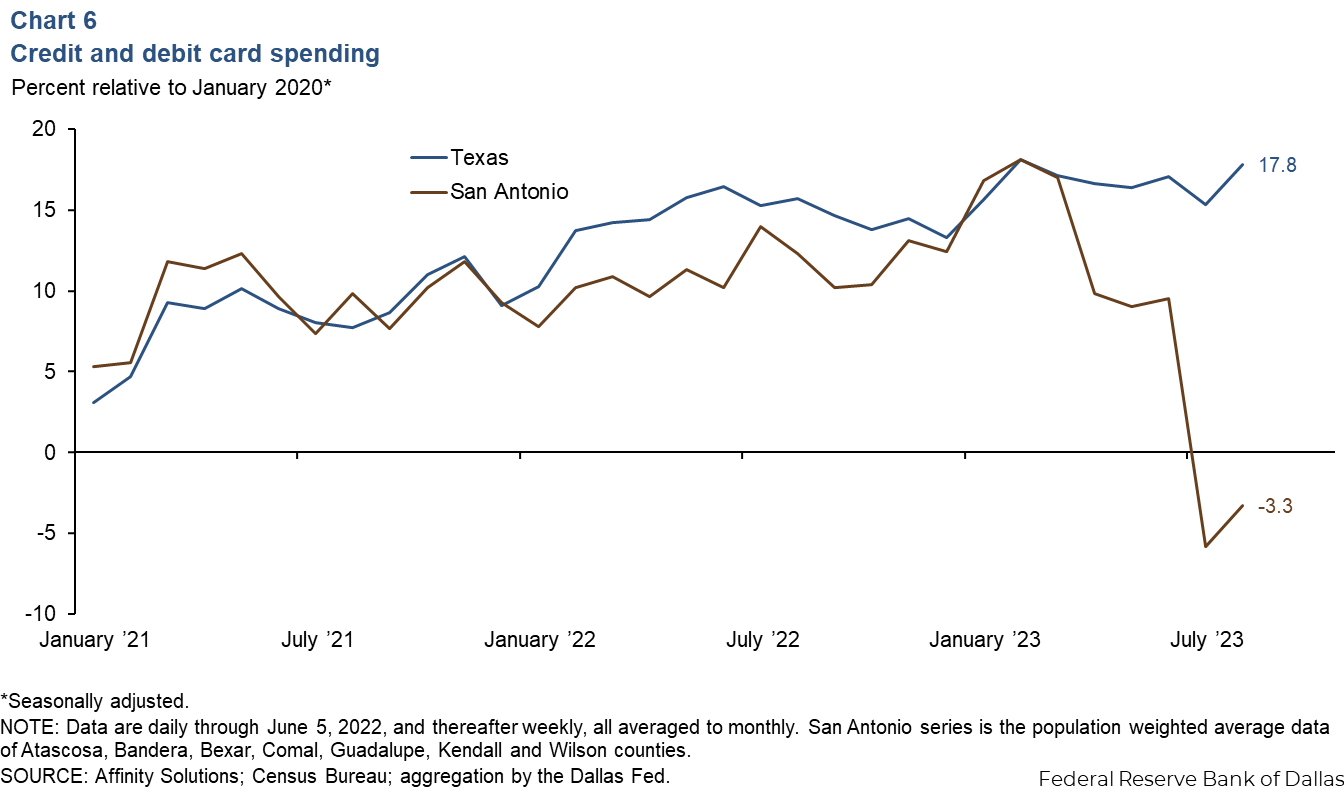
Consumer spending declines
The decline in sales tax revenue coincides with a decline in consumer spending. Based on credit and debit card data, nominal spending in San Antonio fell 3 percent in August compared with January 2020 (Chart 6). For Texas, spending was up 18 percent.
NOTE: Data may not match previously published numbers due to revisions.
About San Antonio Economic Indicators
Questions or suggestions can be addressed to Mariam Yousuf at Mariam.Yousuf@dal.frb.org. San Antonio Economic Indicators is published every month during the week after state and metro employment data are released.