San Antonio Economic Indicators

| San Antonio economy dashboard (September 2023) | |||
| Job growth (annualized) June–Sept. '23 |
Unemployment rate |
Avg. hourly earnings |
Avg. hourly earnings growth y/y |
| 1.8% | 3.7% | $28.32 | 2.4% |
San Antonio payroll jobs increased in September at the fastest rate in over a year. In addition, unemployment declined despite the increases in the labor force, and wages rose. Single-family housing permits increased slightly in August.
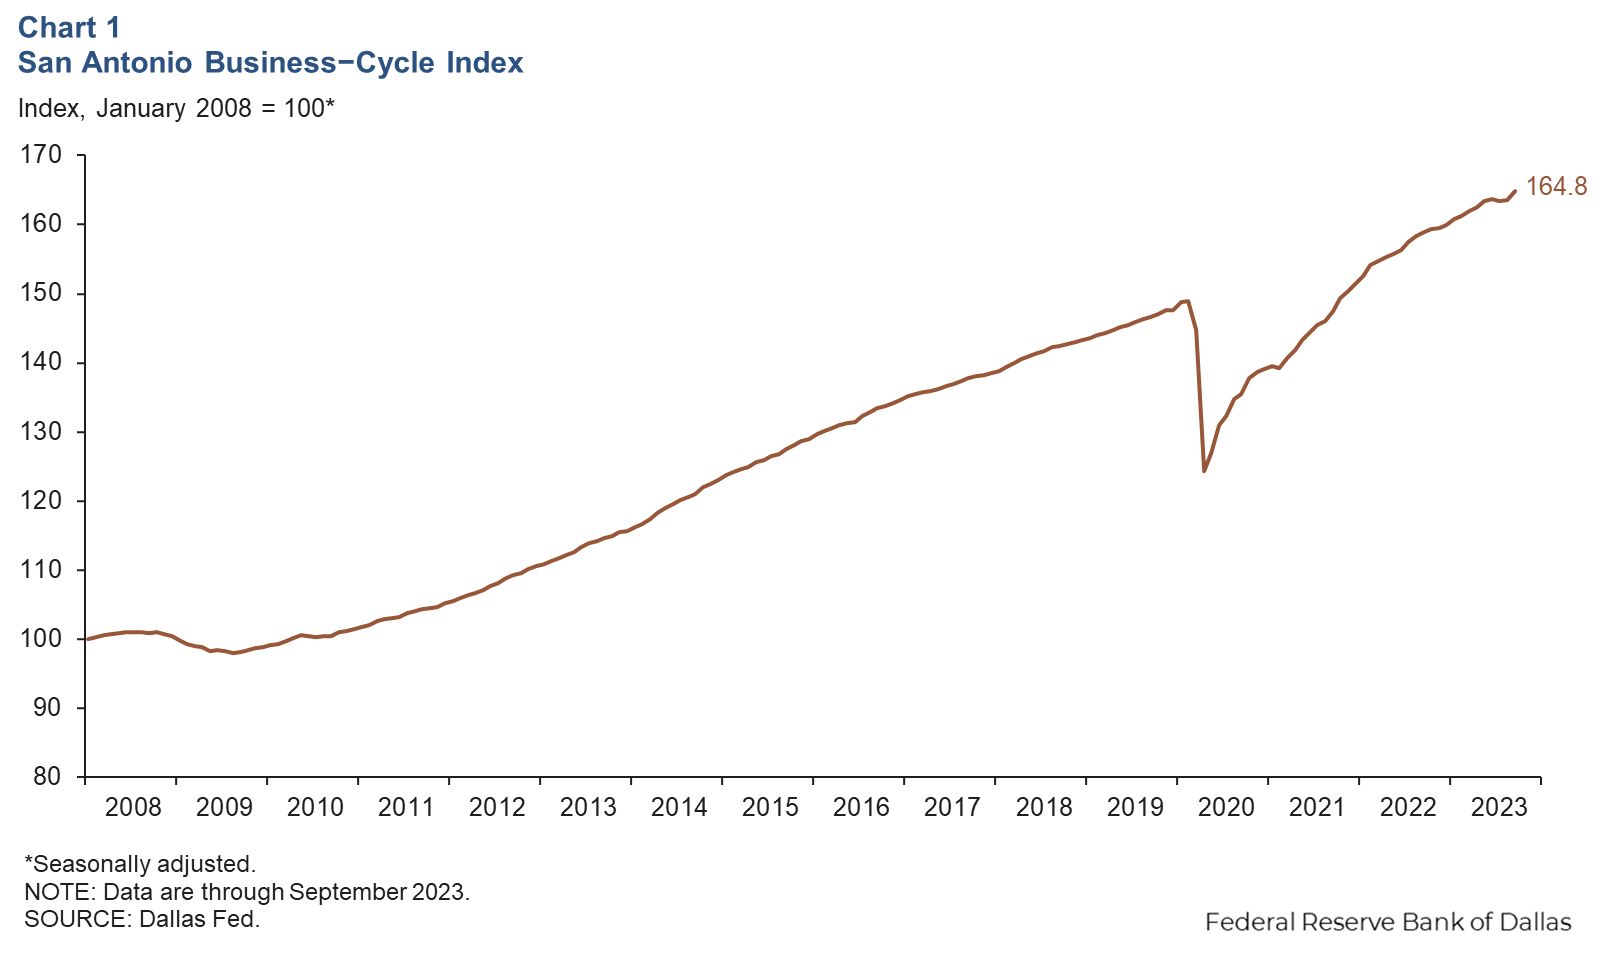
Business-cycle index
The San Antonio Business-Cycle Index, a gauge of economic conditions in the metro area, increased an annualized 9.4 percent from August to September, compared with a 1.5 percent decline from July to August (Chart 1). Growth at this rate has not been experienced since the middle of last year. Year to date, the index is up 7.5 percent annualized.
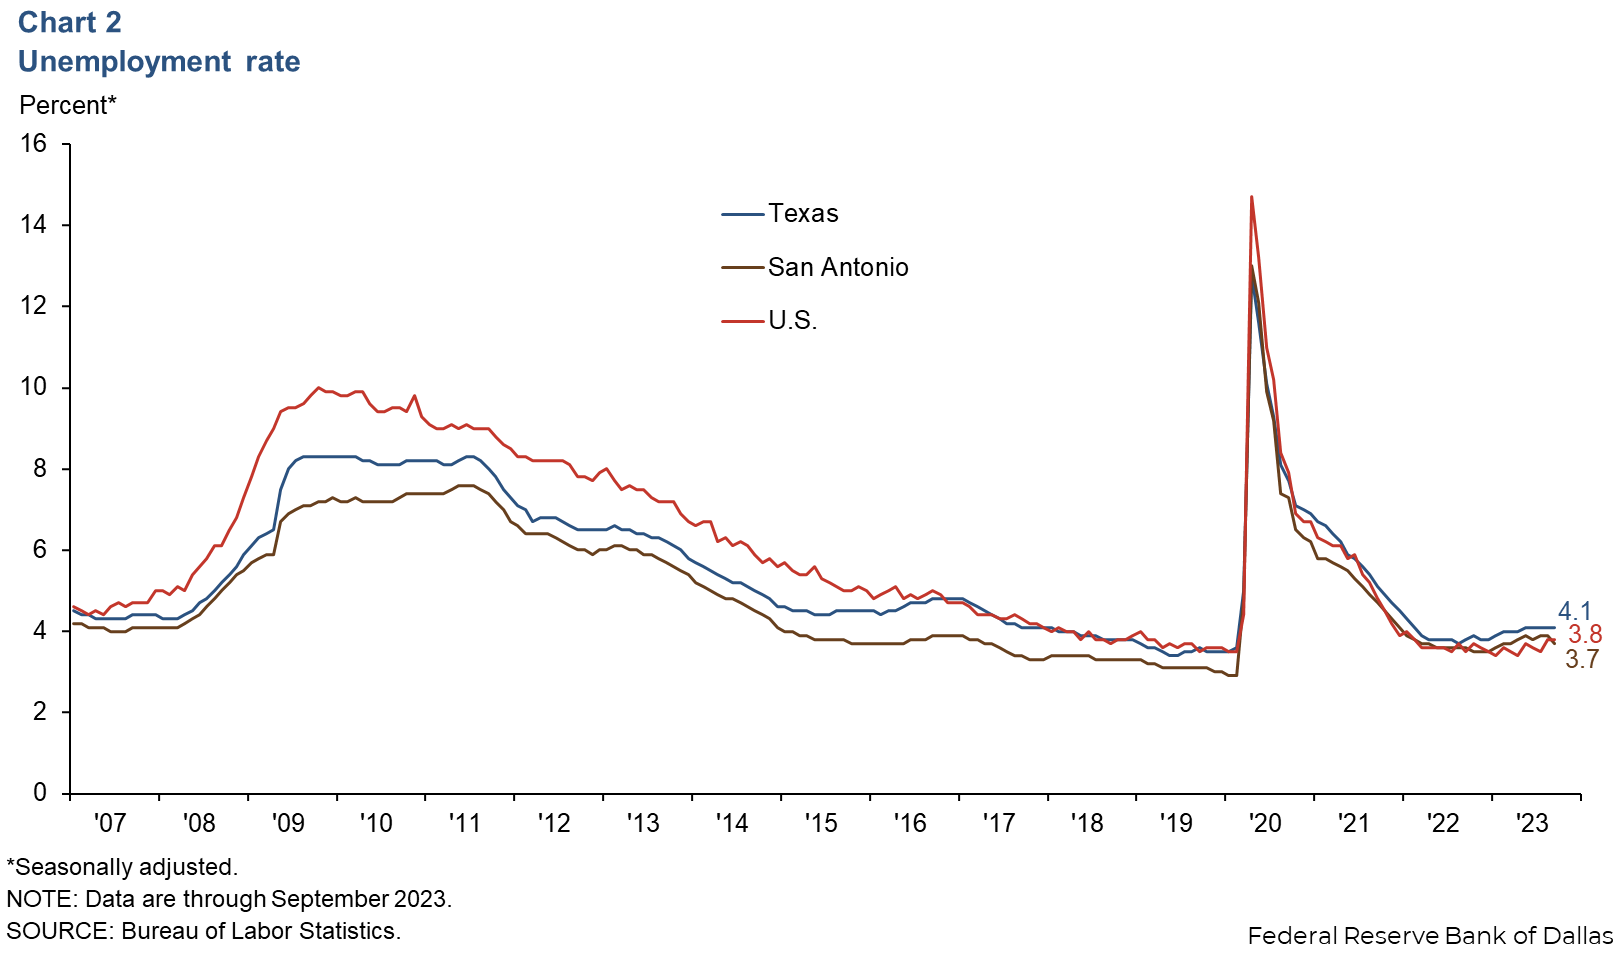
Labor market
Unemployment rate falls
The San Antonio unemployment rate declined to 3.7 percent in September after staying steady at 3.9 percent the previous two months (Chart 2). The jobless rate is lower in the region than in the state (4.1 percent) and the U.S. (3.8 percent). This decline in unemployment occurred despite San Antonio’s labor force increasing an annualized 3.0 percent as strong job growth overpowered the gains in the labor force, leading to a lower unemployment rate.
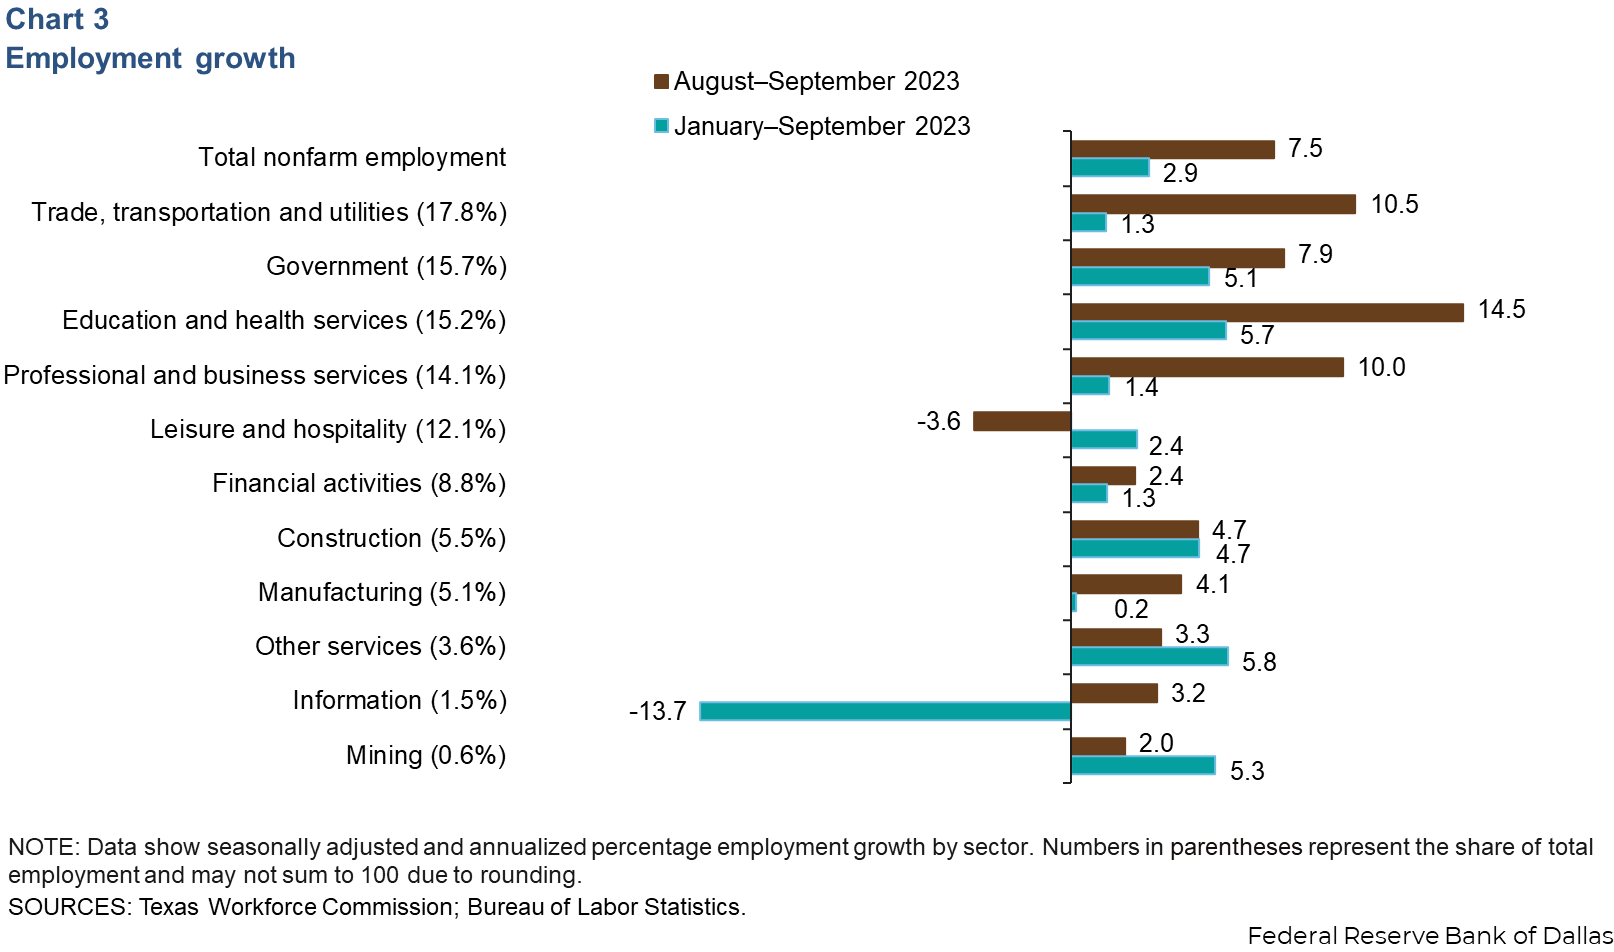
Employment growth trends up
San Antonio payrolls increased an annualized 7.5 percent from August to September (6,959 jobs) (Chart 3). Job gains were driven by education and health services (14.5 percent, or 1,994 jobs), trade, transportation and utilities (10.5 percent, or 1,705 jobs), and professional and business services (10.0 percent, or 1,288 jobs). The growth in education and health services is largely driven by the health side, which accounts for roughly 80 percent of the jobs in the combined sector. Year to date, total nonfarm employment has grown 2.9 percent in San Antonio, compared with gains of 5.4 percent in Texas and 2.6 percent in the U.S.
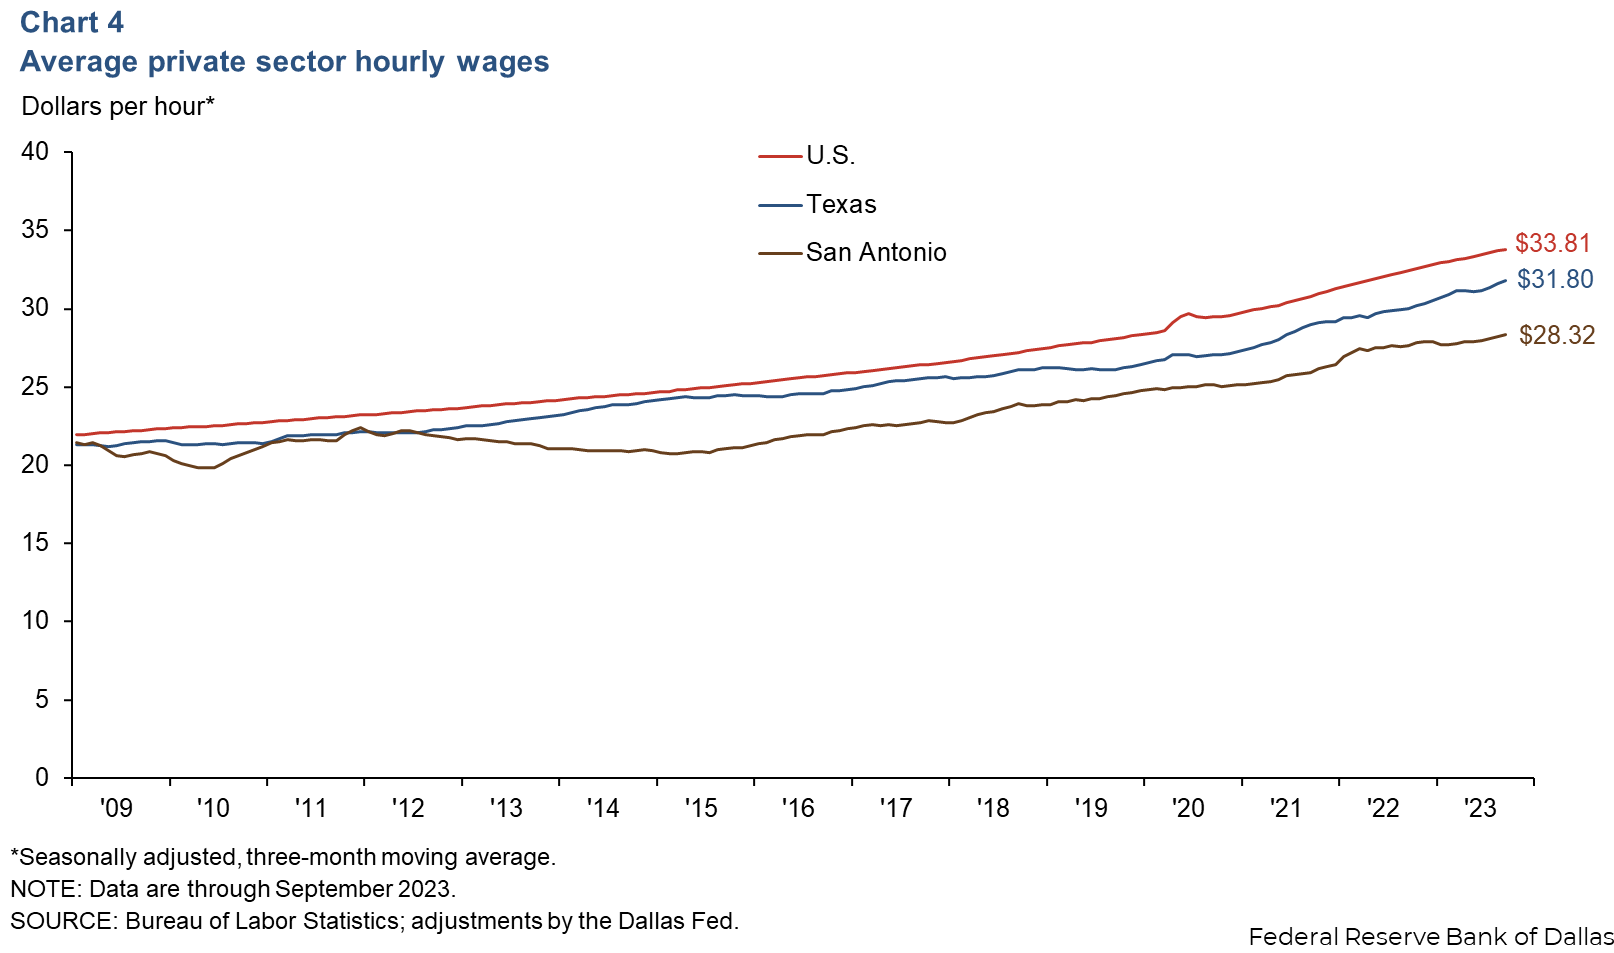
Wages rise
San Antonio wages rose an annualized 4.0 percent in September, slower than Texas’ increase (8.8 percent) but faster than the nation’s (3.4 percent). The three-month moving average of hourly wages in San Antonio was $28.32, below both the state average of $31.80 and the national average of $33.81 (Chart 4). In the past year, wages in San Antonio have risen 2.4 percent, slower than the increases in Texas (6.1 percent) and the U.S. (4.2 percent).
Housing construction
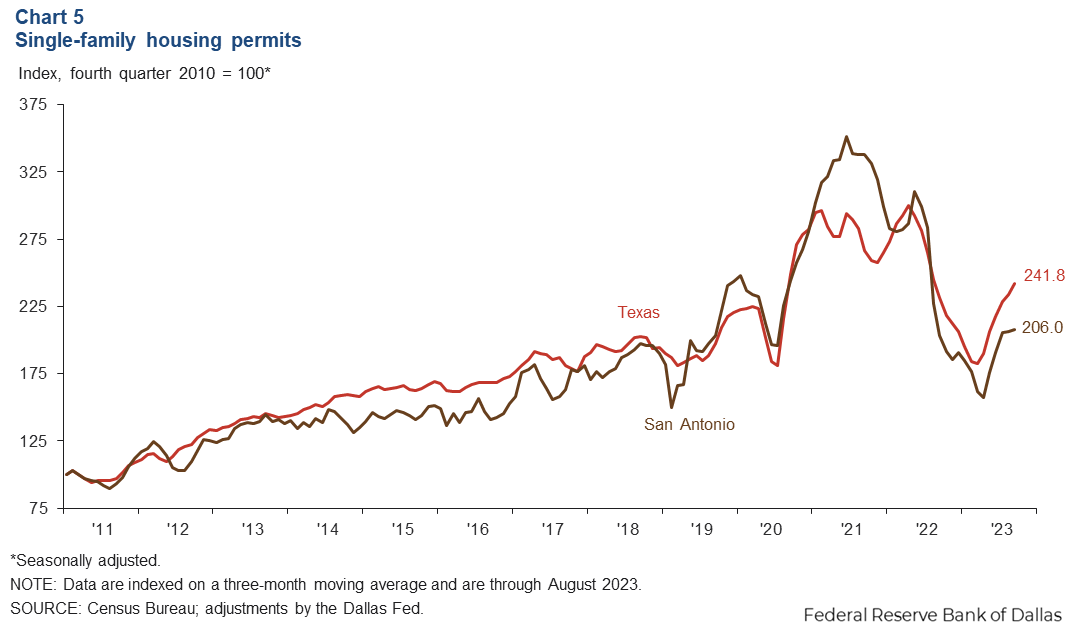
Single-family housing permits declined dramatically during 2022 and reached a low point in March 2023 (Chart 5). Permits began to recover after that, but the bounce back stalled in July in the metro despite continuing at the state level. In August, the three-month moving average of permits increased 1 percent month over month—significantly slower than the 7 to 12 percent monthly growth rate in April, May and June. The slowdown in new-home construction is occurring in a housing market where the majority of homes remain unaffordable for a median-income household due to rising mortgage rates.
NOTE: Data may not match previously published numbers due to revisions.
About San Antonio Economic Indicators
Questions or suggestions can be addressed to Mariam Yousuf at Mariam.Yousuf@dal.frb.org. San Antonio Economic Indicators is published every month during the week after state and metro employment data are released.