San Antonio Economic Indicators

| San Antonio economy dashboard (October 2023) | |||
| Job growth (annualized) July–Oct. '23 |
Unemployment rate |
Avg. hourly earnings |
Avg. hourly earnings growth y/y |
| 3.9% | 3.8% | $28.46 | 2.4% |
San Antonio payroll jobs continued to grow at an elevated rate in October after a sharp pickup in September. In addition, unemployment declined despite the increases in the labor force, and wages rose; however, retail sales tax continued to decline.
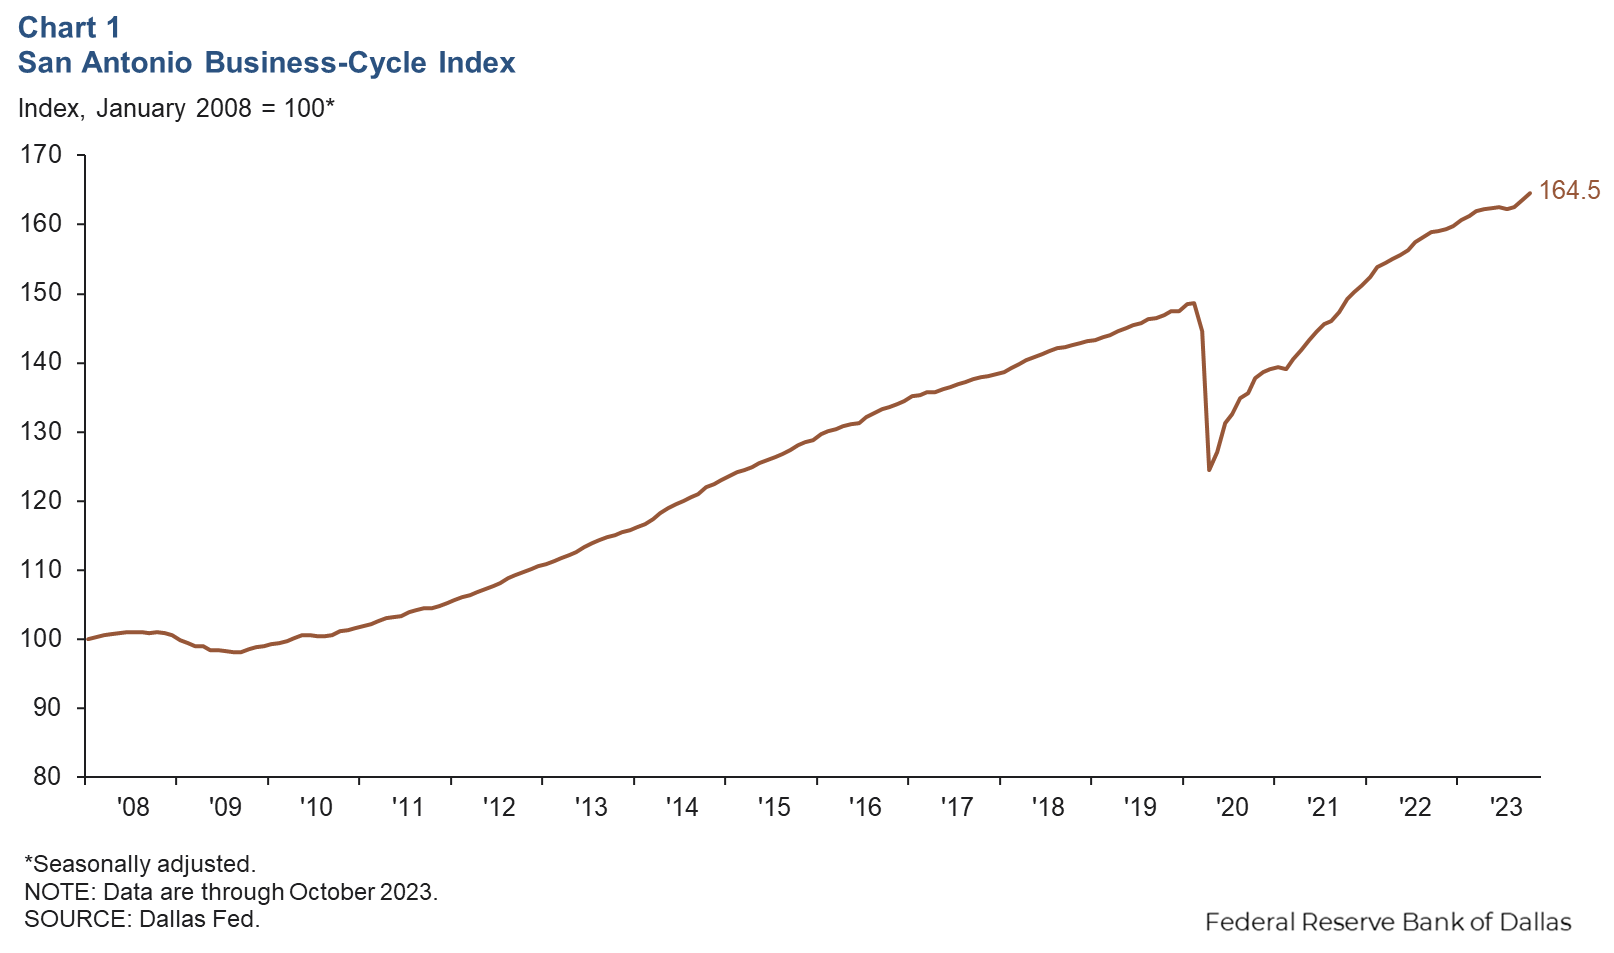
Business-cycle index
The San Antonio Business-Cycle Index, a gauge of economic conditions in the metro area, increased an annualized 6.7 percent from September to October, slightly slower than the 8.0 percent rise from August to September (Chart 1).
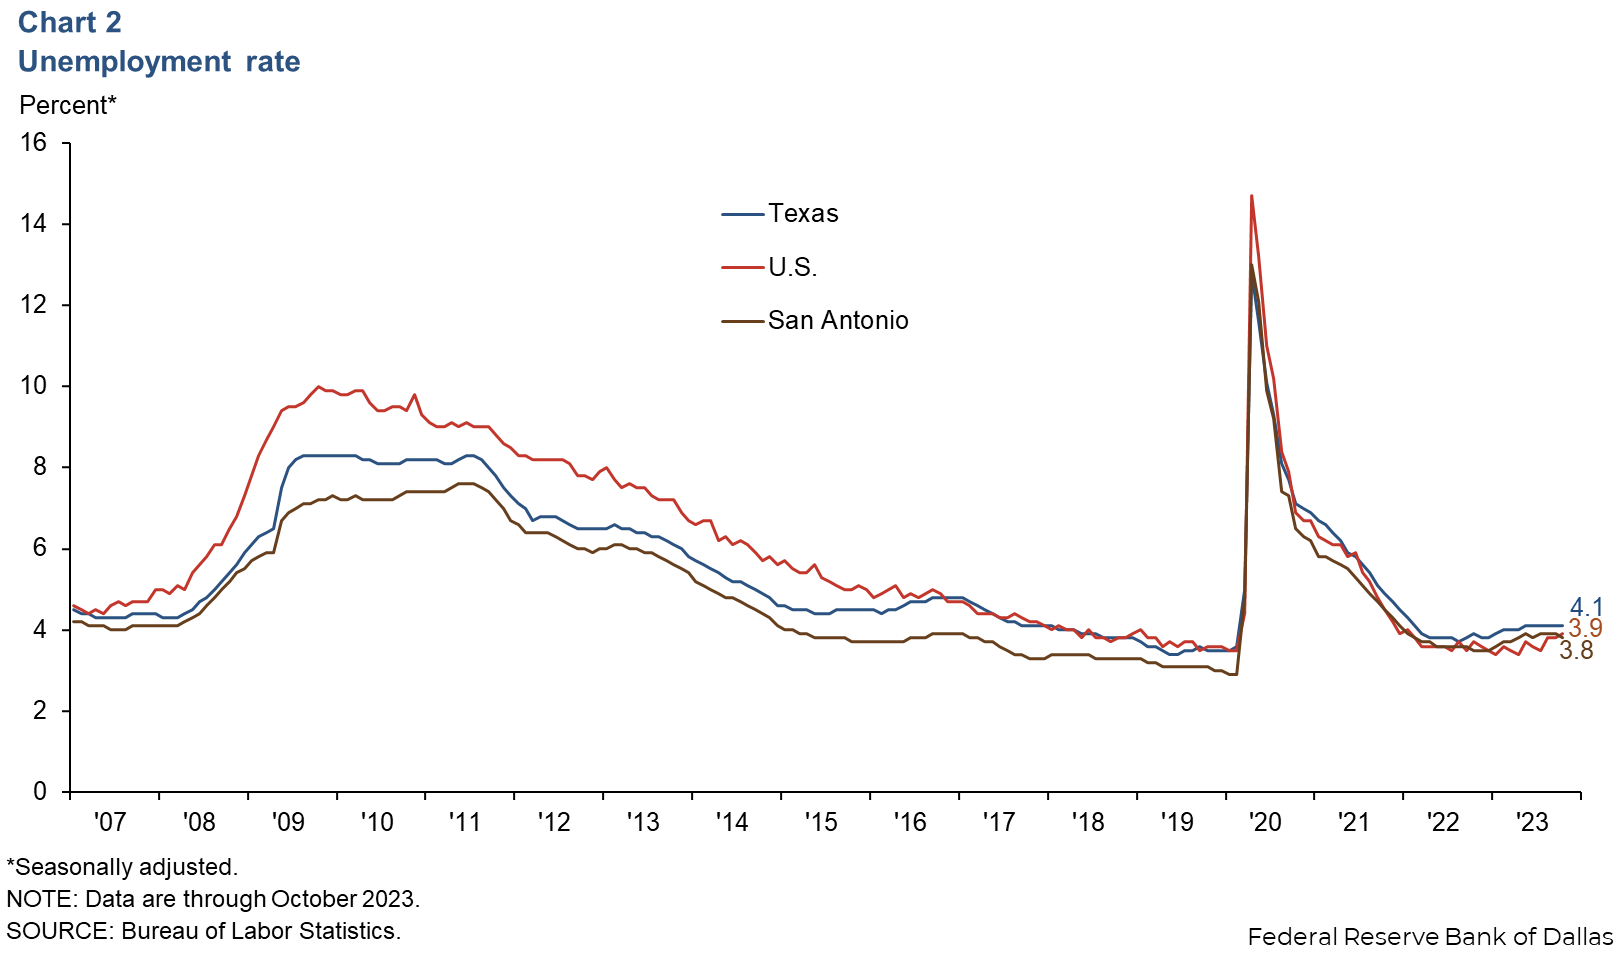
Labor market
Unemployment rate falls
The San Antonio unemployment rate declined to 3.8 percent in October after staying steady at 3.9 percent the previous three months (Chart 2). The jobless rate is lower in the region than in the state (4.1 percent) and the U.S. (3.9 percent). This decline in unemployment occurred despite San Antonio’s labor force increasing an annualized 3.6 percent, as strong job growth overpowered the gains in the labor force, leading to a lower unemployment rate.
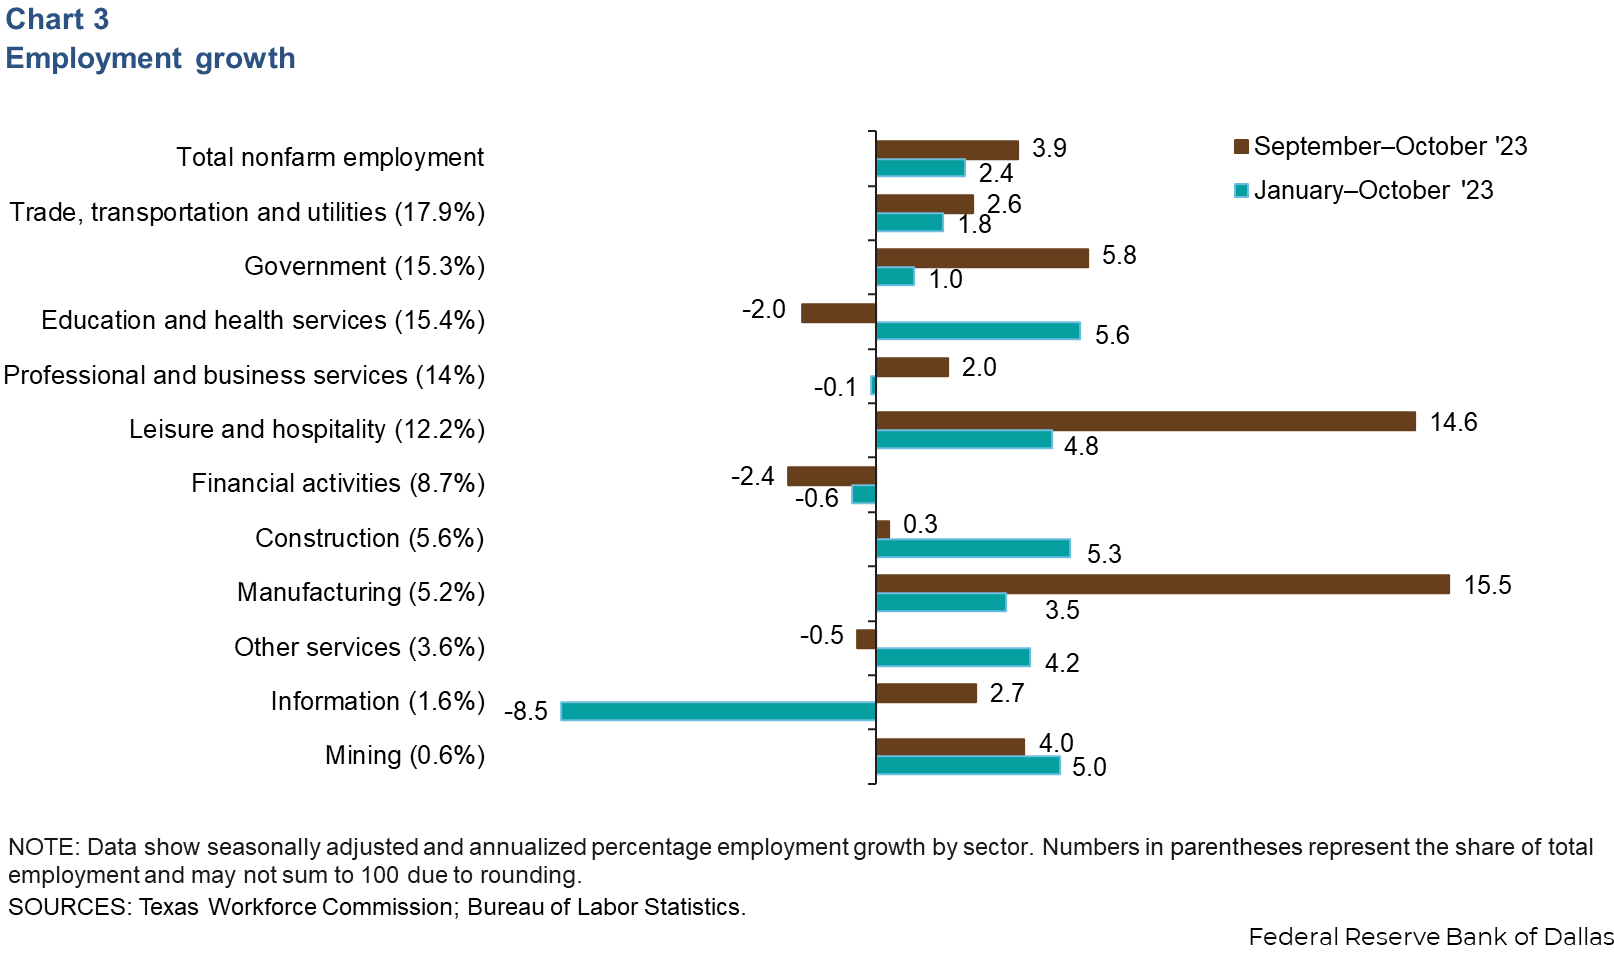
Employment growth trends up
San Antonio payrolls increased an annualized 3.9 percent from September to October (3,643 jobs) (Chart 3). Job gains were driven by manufacturing (15.5 percent, or 729 jobs) and leisure and hospitality (14.6 percent, or 1,623 jobs). All other sectors experienced positive monthly growth except financial activities (-2.4 percent, or 200 jobs), education and health services (-2.0 percent, or 299 jobs), and other services (-0.5 percent, or 17 jobs). Year to date, total nonfarm employment has grown 2.4 percent in San Antonio, compared with gains of 3.2 percent in Texas and 1.9 percent in the U.S.
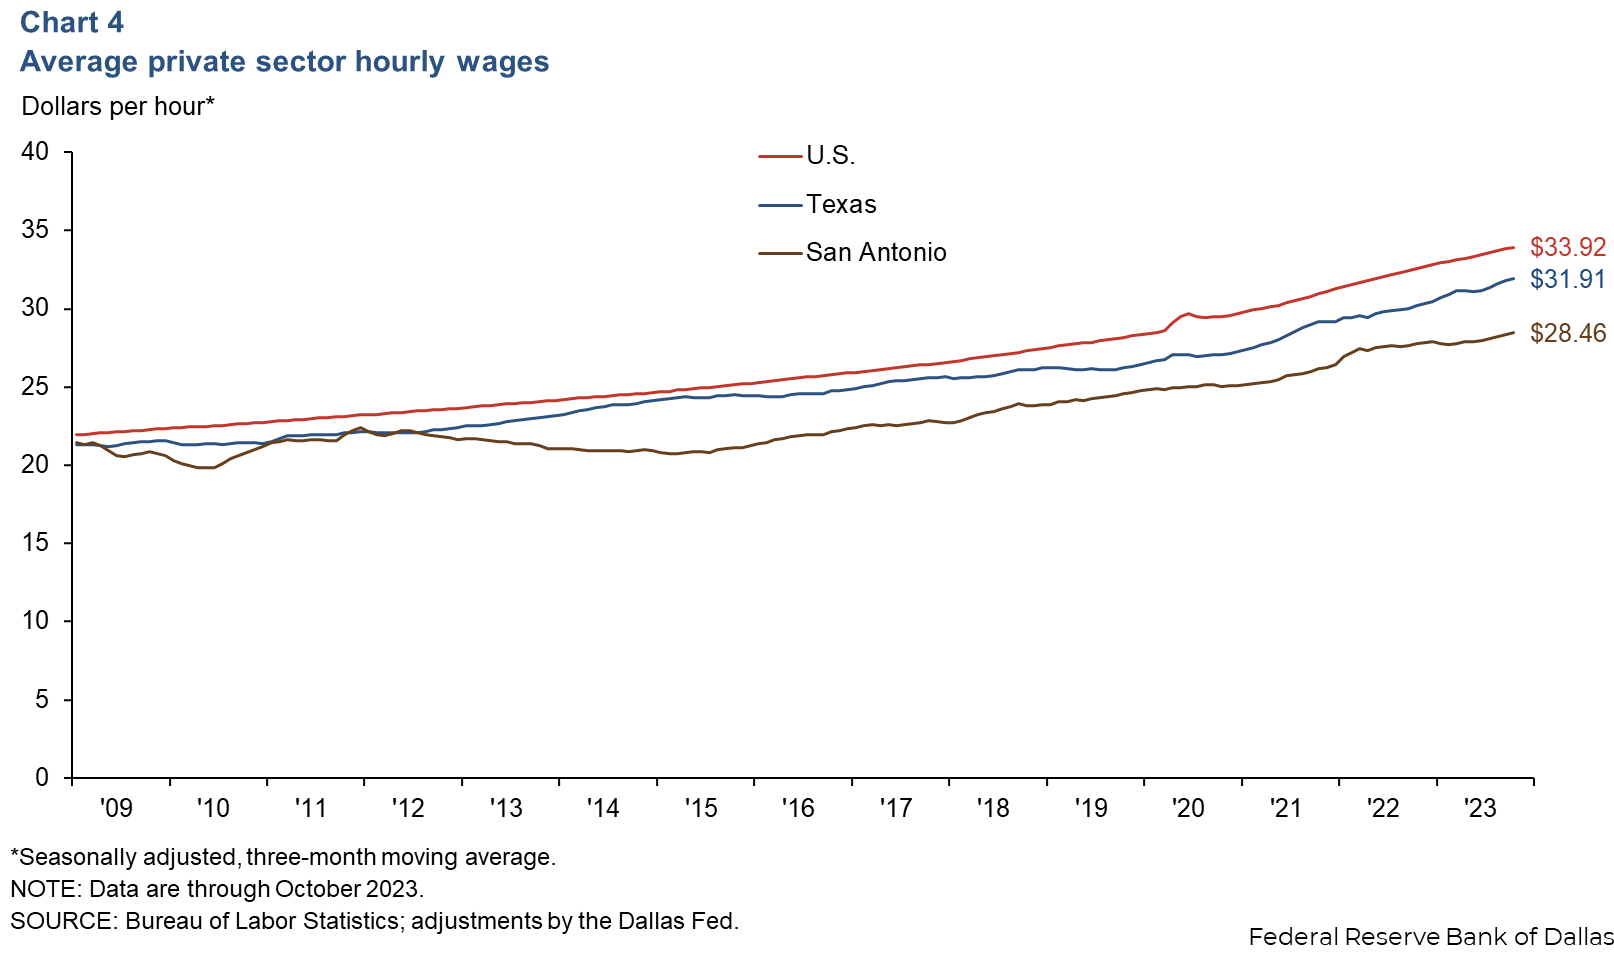
Wages rise
San Antonio wages rose an annualized 4.9 percent in October, faster than Texas’ increase (3.2 percent) and the nation’s (3.2 percent). The three-month moving average of hourly wages in San Antonio was $28.46, below both the state average of $31.91 and the national average of $33.92 (Chart 4). In the past year, wages in San Antonio have risen 2.4 percent, slower than the increases in Texas (5.7 percent) and the U.S. (4.2 percent).
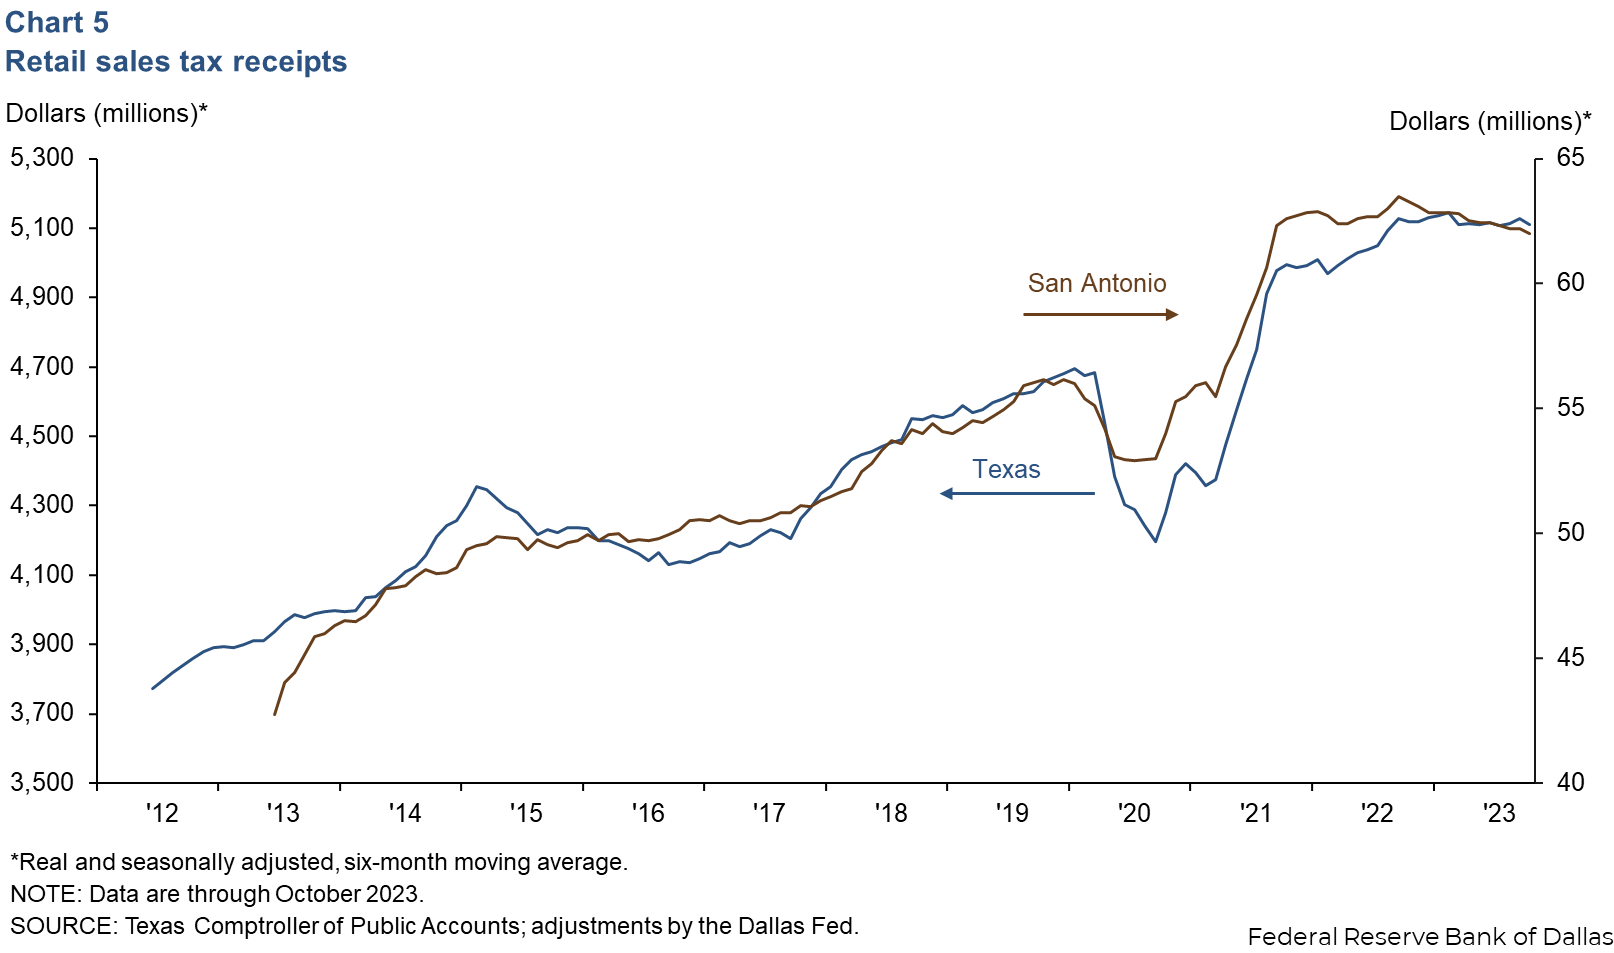
Retail sales tax revenue
San Antonio’s revenue from sales tax adjusted for inflation fell 3.9 percent in October (Chart 5), matching the state’s decline of 3.9 percent. October marks the eighth month that the six-month moving average of tax receipts declined in San Antonio while they fluctuated for the entire state over the same period. Tax revenue in San Antonio was down 2.0 percent year over year compared with a slight 0.2 percent decline for the state.
NOTE: Data may not match previously published numbers due to revisions.
About San Antonio Economic Indicators
Questions or suggestions can be addressed to Mariam Yousuf at Mariam.Yousuf@dal.frb.org. San Antonio Economic Indicators is published every month during the week after state and metro employment data are released.