San Antonio Economic Indicators

| San Antonio economy dashboard (November 2023) | |||
| Job growth (annualized) Aug.–Nov. '23 |
Unemployment rate |
Avg. hourly earnings |
Avg. hourly earnings growth y/y |
| 4.3% | 3.6% | $28.52 | 2.5% |
San Antonio payroll job growth slowed in November. In addition, unemployment declined, and retail sales tax revenue stabilized; however, wages stagnated.
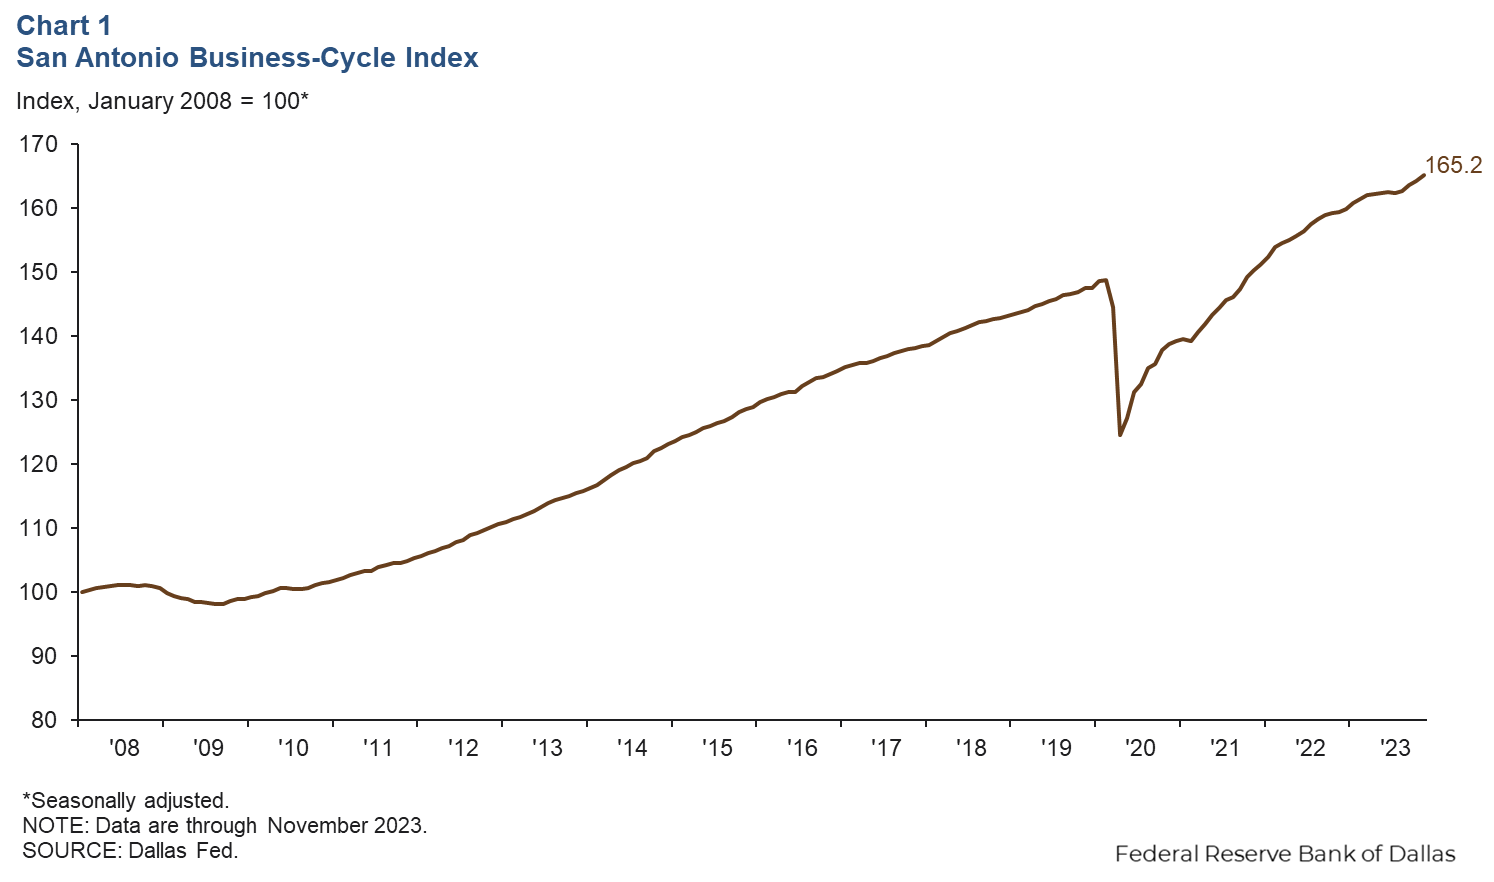
Business-cycle index
The San Antonio Business-Cycle Index, a gauge of economic conditions in the metro area, increased an annualized 6.9 percent from October to November, faster than the 5.0 percent rise from September to October (Chart 1).
Labor market
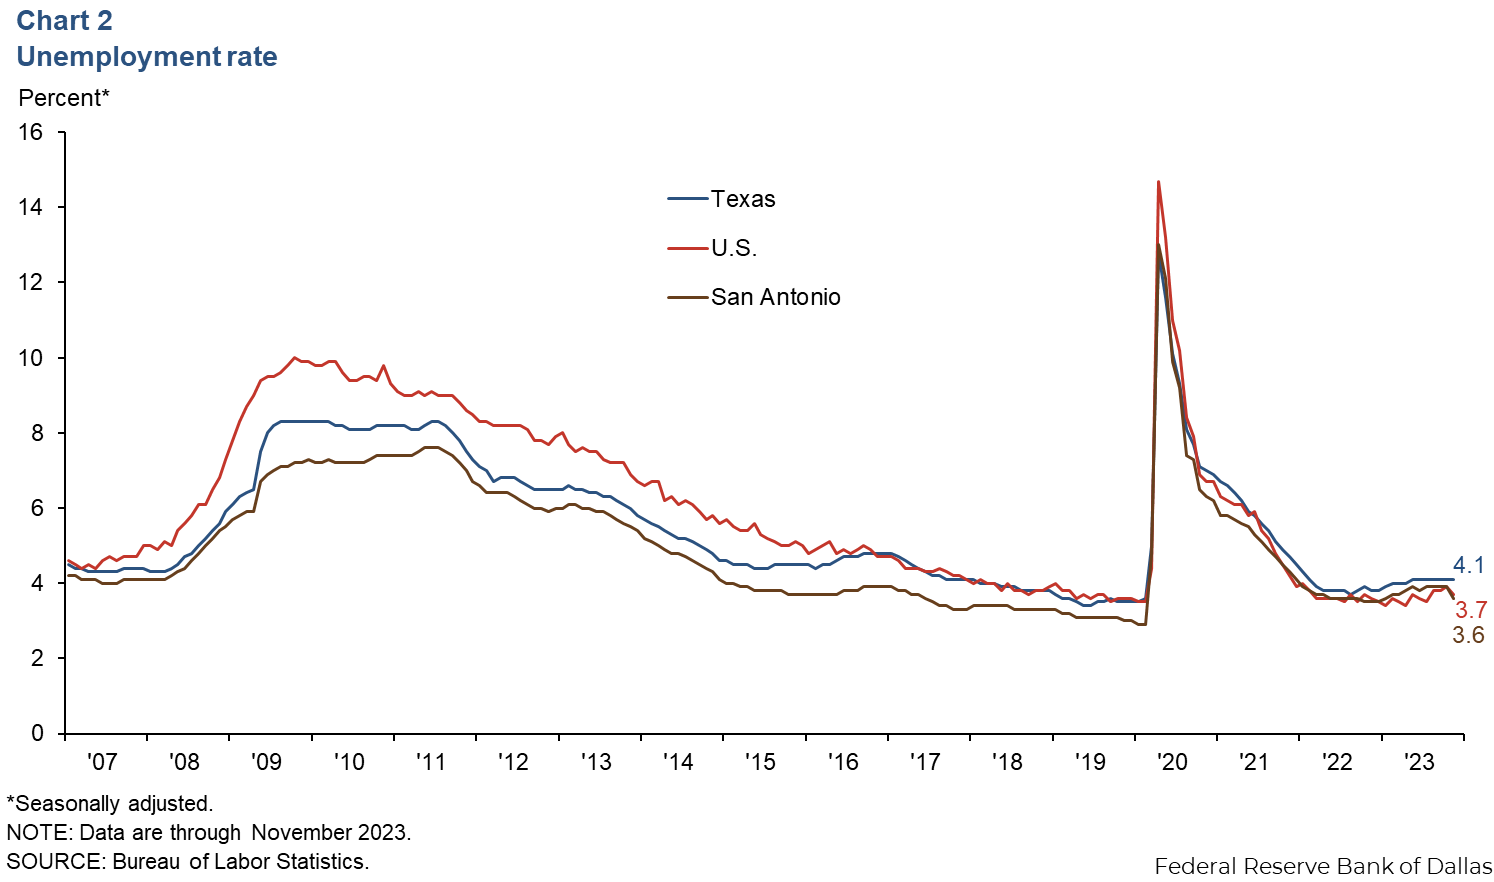
Unemployment rate falls
The San Antonio unemployment rate declined to 3.6 percent in November after remaining at 3.9 percent the previous four months (Chart 2). The jobless rate is lower in the region than in the state (4.1 percent) and the U.S. (3.7 percent). This significant decline in unemployment occurred as San Antonio’s labor force increased by an annualized 4.2 percent in November, a pickup from the 2.2 percent growth in October.
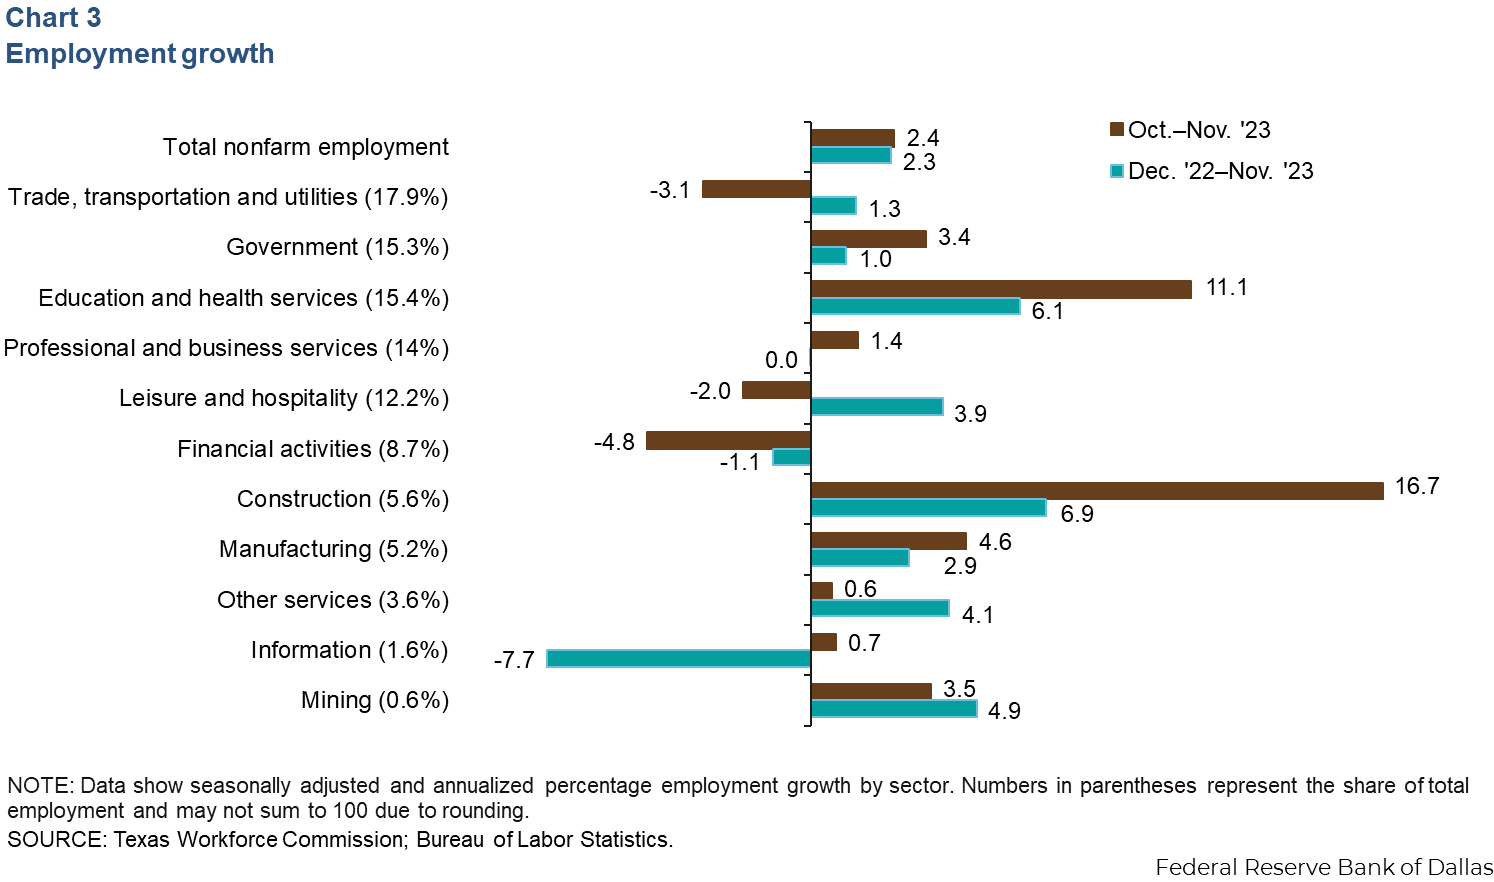
Employment growth slows
San Antonio payrolls increased an annualized 2.4 percent from October to November (2,329 jobs) (Chart 3). Job gains were driven by construction (16.7 percent, or 852 jobs) and education and health services (11.1 percent, or 1,580 jobs). All other sectors experienced positive monthly growth except financial activities (-4.8 percent, or -407 jobs), trade, transportation and utilities (-3.1 percent, or -551 jobs), and leisure and hospitality (-2.0 percent, or -239 jobs). Year to date, total nonfarm employment has grown 2.3 percent in San Antonio compared with gains of 3.3 percent in Texas and 1.8 percent in the U.S.
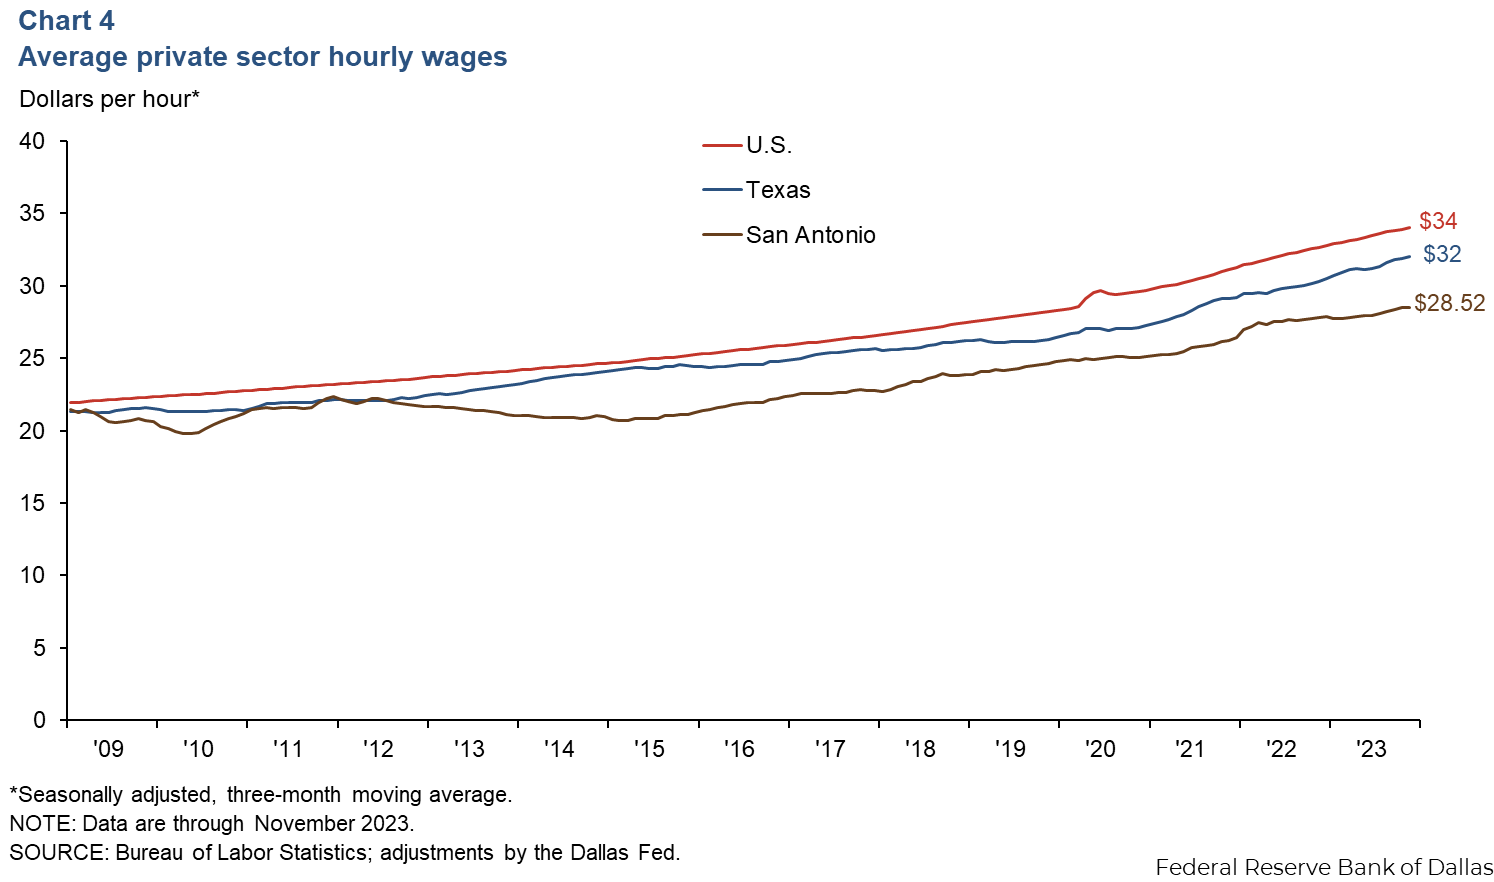
Wages rise
San Antonio wages rose an annualized 0.4 percent in November, slower than Texas’ increase (3.7 percent) and the nation’s (3.4 percent). The three-month moving average of hourly wages in San Antonio was $28.52, below both the state average of $32 and the national average of $34 (Chart 4). In the past year, wages in San Antonio have risen 2.5 percent, slower than the increases in Texas (5.5 percent) and the U.S. (4.1 percent).
Retail sales tax revenue
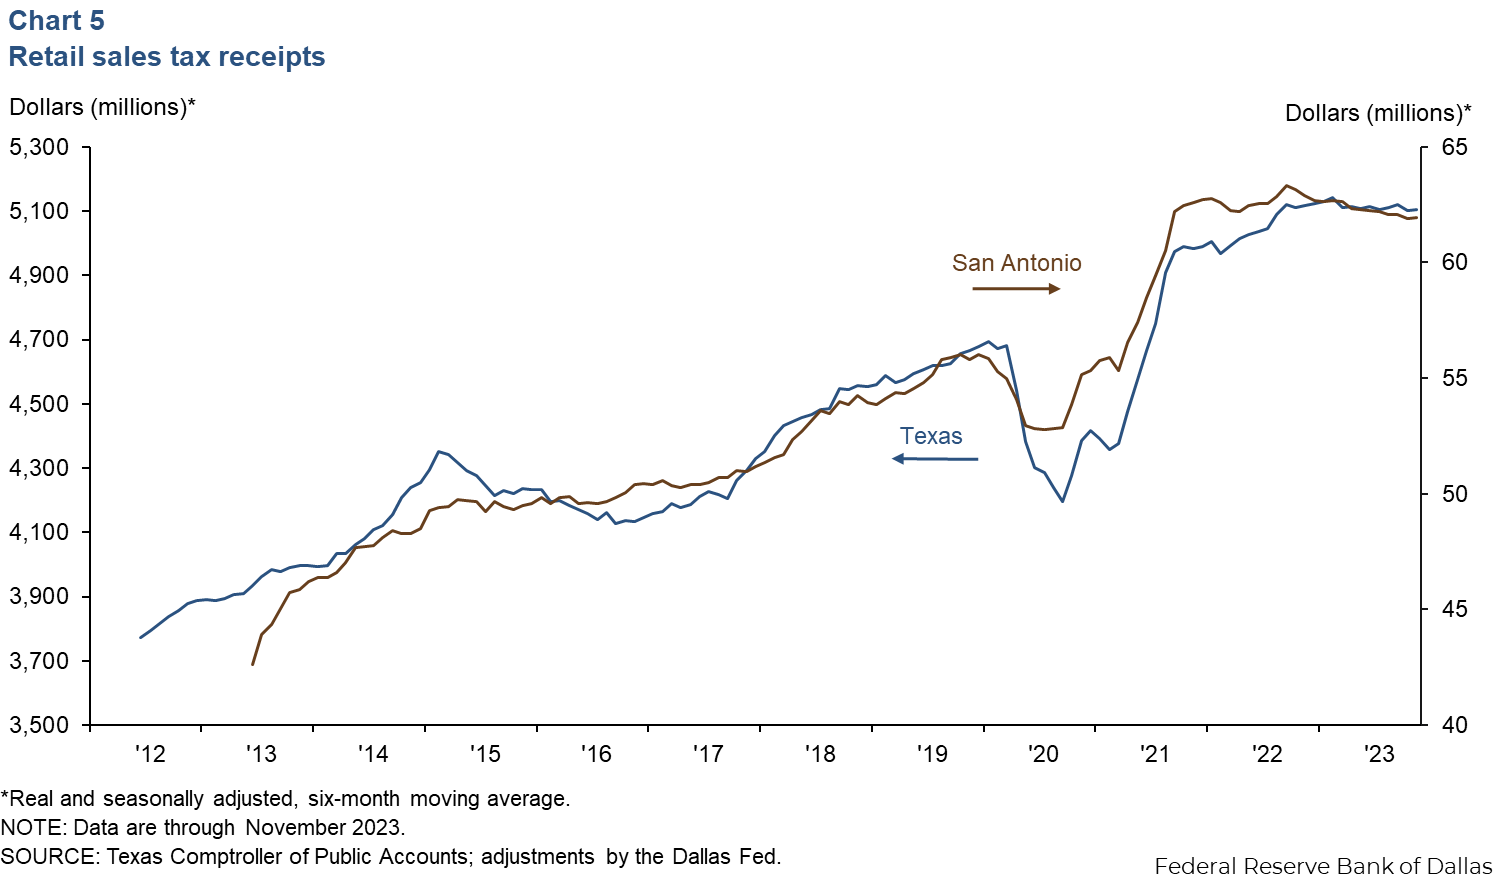
San Antonio’s revenue from sales tax adjusted for inflation recorded a slight increase of 0.5 percent in November, similar to the state’s increase of 0.3 percent (Chart 5). Despite this mild uptick, year over year, the six-month moving average of revenue was still down 1.5 percent in November but less than October’s decrease of 2.0 percent. The state’s revenue was mildly down in November (-0.2 percent) compared with 2022. The year-over-year revenue has been declining for seven months.
NOTE: Data may not match previously published numbers due to revisions.
About San Antonio Economic Indicators
Questions or suggestions can be addressed to Mariam Yousuf at Mariam.Yousuf@dal.frb.org. San Antonio Economic Indicators is published every month during the week after state and metro employment data are released.