Agricultural Survey

Survey highlights
Bankers responding to the first-quarter survey reported persistent weak conditions across most regions of the Eleventh District. The drought continued to put a strain on agricultural production; however, because of the winter rains, there is some optimism for the 2024 crop yields, particularly wheat. Due to harsh conditions, farmers struggled to pay back loans and relied on crop insurance.
“Lower commodity prices and drought in 2023 have resulted in a significant increase in the number of producers that cannot pay off their operating loans for the year,” replied one survey participant. “Without the government’s Emergency Relief Program and the Stacked Income Protection Plan, most of the ag producers would not have been able to pay out,” stated another. Despite the overall dry conditions, a few noted the beneficial impact of the winter weather. One responded stated, “Weather conditions have been near perfect for the winter wheat crop and pasture. Timely and ample rains have also helped the pastures recover.”
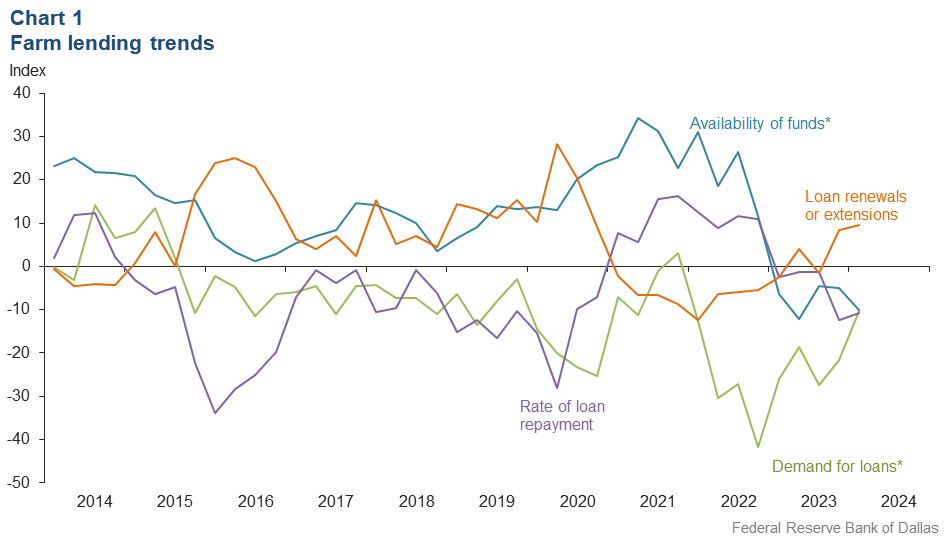
Demand for agricultural loans decreased in the first quarter for the ninth straight quarter, but at the slowest pace since 2021. Loan renewal or extensions continued to increase in the first quarter. The rate of loan repayment declined, but at a mildly decelerated pace than the fourth quarter. Except for operating and cattle feeder loans, loan volume was down for all remaining categories compared with a year ago (Chart 1).
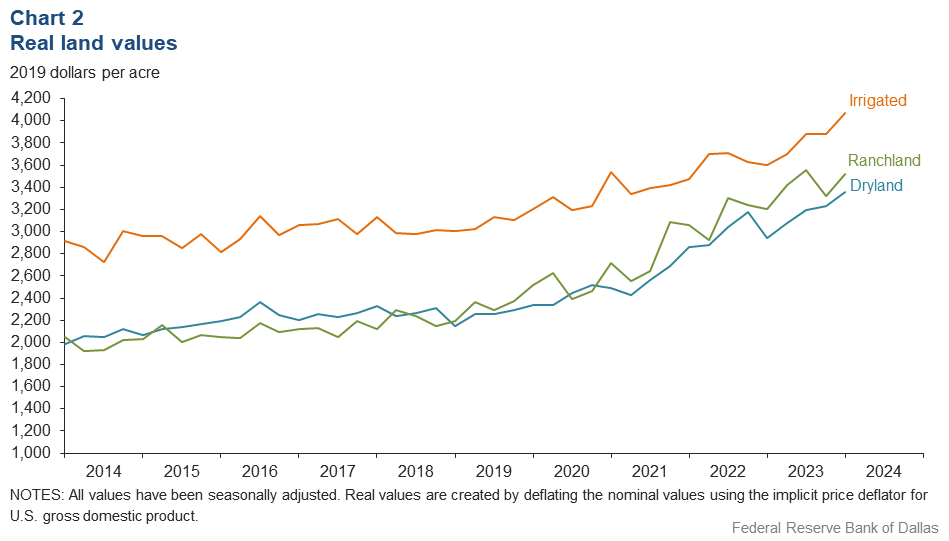
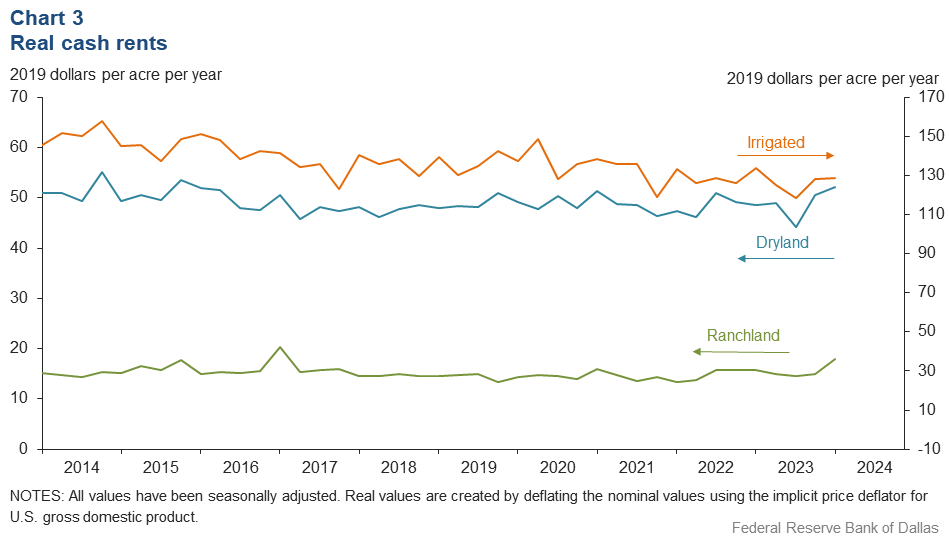
Real land values for dryland, irrigated cropland and ranchland increased this quarter (Chart 2). Ranchland, irrigated cropland and dryland values rose at least 10 percent year over year in Texas (Table 1). In the first quarter of 2024, real cash rents picked up significantly for ranchland and mildly for irrigated cropland and dryland (Chart 3).
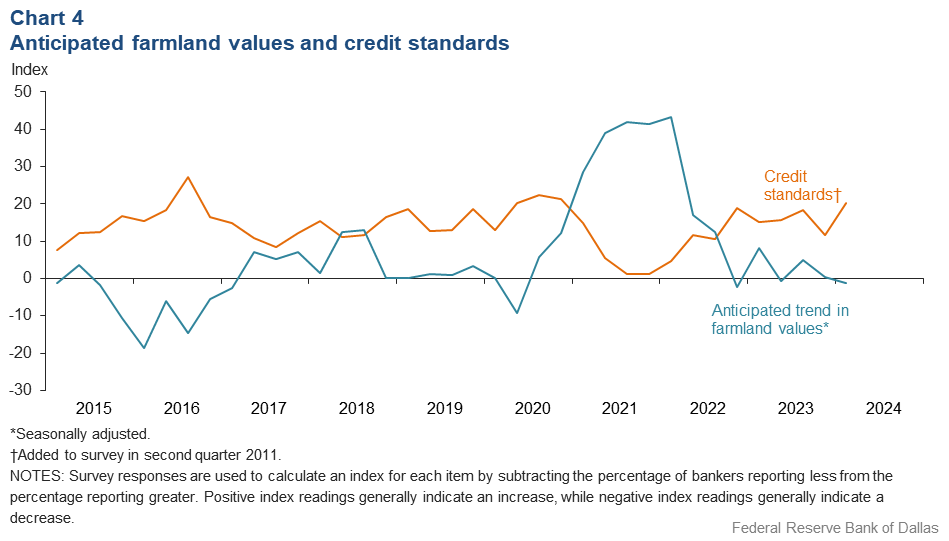
The anticipated trend in the farmland values index declined to just below zero, suggesting respondents expect farmland values to decline slightly. The credit standards index jumped to the fastest pace of tightening since the second quarter of 2020 (Chart 4).
Next release: June 24, 2024
Agricultural Survey is compiled from a survey of Eleventh District agricultural bankers, and data have been seasonally adjusted as necessary. Data were collected March 5-13, and 79 bankers responded to the survey.
Quarterly comments

District bankers were asked for additional comments concerning agricultural land values and credit conditions. These comments have been edited for publication.
The cattle market recovered as expected from the dip three months ago. Dry conditions are a real concern going into the growing season along with prices. A lot of farmers that have historically grown corn silage are turning to milo this year, with the steep decline in price mostly due to dairies tightening their belts.
It is still extremely dry. Pasture conditions are not good, and farming does not project well for this year.
Below average irrigated crops and poor to very poor dryland crops have impacted the 2023 total ag revenue. Without the government’s Emergency Relief Program and the Stacked Income Protection Plan most of the ag producers would not have been able to pay out.
Land prices made a large jump this year in the Lubbock area and surrounding 50-mile radius due to speculation of development plus non-farm investors.
Weather conditions have been near perfect for the winter wheat crop and pasture. Timely and ample rains have also helped the pastures recover. Cow-calf producers are selling cattle at near-all-time high prices, while the wheat price is a concern for farmers. Economic conditions are a concern, as many input costs seem to keep getting higher.
Lower commodity prices and drought in 2023 have resulted in a significant increase in the number of producers that cannot pay off their operating loans for the year. Numerous restructures are taking place, and equity has been lost from multi-year droughts. Government help has been negligible. Some of the area has received beneficial moisture giving a boost in confidence for a better 2024 crop year.
Land prices are still high, but there are not many closings due to interest rates.
Smaller rural tracts between 10 and 50 acres are selling for $11,000 to $20,000 per acre. They are being sold for recreational purposes or to build homes or barndominiums.
Ag loan demand is increasing.
Very dry conditions persist in the lending area, with El Nino essentially being a non-event here. Cattle prices remain very strong, but with limited moisture, it is anticipated that most ranchers will be required to sell significant numbers of their base herds. Dairy woes continue, impacting forage crop farmers. Many are transitioning to non-dairy crops such as cotton and small bale alfalfa. The number of dairy cows on feed in Pecos Valley is significantly reduced from five years ago.
Current and projected commodity prices along with past years’ carryover balances are making cash flows rather difficult to show repayment. It is looking like another rough year ahead. Some farmers may have a difficult time staying in business.
Historical data
Historical data can be downloaded dating back to first quarter 2000.
Charts
Farm lending trends
What changes occurred in non-real-estate farm loans at your bank in the past three months compared with a year earlier?
| Index | Percent reporting, Q1 | ||||
| 2023:Q4 | 2024:Q1 | Greater | Same | Less | |
Demand for loans* | –21.7 | –10.3 | 10.3 | 69.1 | 20.6 |
Availability of funds* | –4.9 | –10.1 | 6.2 | 77.5 | 16.3 |
Rate of loan repayment | –12.3 | –10.8 | 1.4 | 86.5 | 12.2 |
Loan renewals or extensions | 8.3 | 9.6 | 11.0 | 87.7 | 1.4 |
| *Seasonally adjusted. | |||||

What changes occurred in the volume of farm loans made by your bank in the past three months compared with a year earlier?
| Index | Percent reporting, Q1 | ||||
| 2023:Q4 | 2024:Q1 | Greater | Same | Less | |
Non–real–estate farm loans | –21.1 | –1.3 | 14.7 | 69.3 | 16.0 |
Feeder cattle loans* | –8.4 | 6.9 | 27.1 | 52.7 | 20.2 |
Dairy loans* | –16.2 | –9.9 | 0.0 | 90.1 | 9.9 |
Crop storage loans* | –19.4 | –7.1 | 4.2 | 84.5 | 11.3 |
Operating loans | 11.3 | 6.9 | 19.4 | 68.1 | 12.5 |
Farm machinery loans* | –24.2 | –20.0 | 1.1 | 77.8 | 21.1 |
Farm real estate loans* | –21.5 | –16.5 | 5.0 | 73.5 | 21.5 |
| *Seasonally adjusted. NOTES: Survey responses are used to calculate an index for each item by subtracting the percentage of bankers reporting less from the percentage reporting greater. Positive index readings generally indicate an increase, while negative index readings generally indicate a decrease. |
|||||
Real land values

Real cash rents

Anticipated farmland values and credit standards
What trend in farmland values do you expect in your area in the next three months?
| Index | Percent reporting, Q1 | ||||
| 2023:Q4 | 2024:Q1 | Up | Same | Down | |
| Anticipated trend in farmland values* | 0.5 | –1.2 | 8.4 | 82.0 | 9.6 |
| *Seasonally adjusted. | |||||
What change occurred in credit standards for agricultural loans at your bank in the past three months compared with a year earlier?
| 2023:Q4 | 2024:Q1 | Up | Same | Down | |
| Credit standards | 11.6 | 20.3 | 21.6 | 77.0 | 1.4 |

Tables
Rural real estate values—first quarter 2024
| Banks1 | Average value2 | Percent change in value from previous year3 | ||
Cropland–Dryland | ||||
District* | 62 | 3,398 | 13.2 | |
Texas* | 52 | 3,477 | 13.7 | |
1 | Northern High Plains | 9 | 1,144 | 9.8 |
2 | Southern High Plains | 7 | 1,393 | 20.4 |
3 | Northern Low Plains* | 3 | 1,120 | 8.0 |
4 | Southern Low Plains* | 5 | 2,372 | 6.9 |
5 | Cross Timbers | n.a. | n.a. | n.a. |
6 | North Central Texas | 4 | 6,625 | 13.2 |
7 | East Texas* | 3 | 4,559 | 20.0 |
8 | Central Texas | 9 | 9,817 | 9.6 |
9 | Coastal Texas | n.a. | n.a. | n.a. |
10 | South Texas | 3 | 3,067 | 4.0 |
11 | Trans–Pecos and Edwards Plateau | 5 | 4,140 | 26.3 |
12 | Southern New Mexico | 4 | 588 | –17.5 |
13 | Northern Louisiana | 6 | 4,133 | 7.7 |
Cropland–Irrigated | ||||
District* | 52 | 4,122 | 10.2 | |
Texas* | 41 | 3,621 | 10.6 | |
1 | Northern High Plains | 9 | 3,178 | 3.7 |
2 | Southern High Plains | 7 | 2,607 | 17.0 |
3 | Northern Low Plains* | n.a. | n.a. | n.a. |
4 | Southern Low Plains | 4 | 3,375 | 10.4 |
5 | Cross Timbers | n.a. | n.a. | n.a. |
6 | North Central Texas | n.a. | n.a. | n.a. |
7 | East Texas | 3 | 5,667 | 14.3 |
8 | Central Texas | 5 | 12,300 | 23.2 |
9 | Coastal Texas | n.a. | n.a. | n.a. |
10 | South Texas | n.a. | n.a. | n.a. |
11 | Trans–Pecos and Edwards Plateau | 4 | 4,625 | 1.4 |
12 | Southern New Mexico | 5 | 7,552 | 10.7 |
13 | Northern Louisiana | 6 | 5,542 | 7.2 |
Ranchland | ||||
District* | 68 | 3,569 | 14.6 | |
Texas* | 58 | 4,247 | 14.2 | |
1 | Northern High Plains | 9 | 1,133 | 27.0 |
2 | Southern High Plains | 7 | 1,214 | 16.4 |
3 | Northern Low Plains | 3 | 1,067 | 0.0 |
4 | Southern Low Plains* | 5 | 2,603 | 5.3 |
5 | Cross Timbers | 3 | 4,000 | 3.9 |
6 | North Central Texas | 5 | 8,500 | 17.8 |
7 | East Texas | 6 | 5,500 | 15.2 |
8 | Central Texas | 9 | 12,056 | 9.4 |
9 | Coastal Texas | n.a. | n.a. | n.a. |
10 | South Texas | 3 | 3,267 | 1.8 |
11 | Trans–Pecos and Edwards Plateau | 6 | 3,917 | 22.5 |
12 | Southern New Mexico | 5 | 645 | 29.0 |
13 | Northern Louisiana | 5 | 2,920 | 5.4 |
| *Seasonally adjusted. 1 Number of banks reporting land values. 2 Prices are dollars per acre, not adjusted for inflation. 3 Not adjusted for inflation and calculated using responses only from those banks reporting in both the past and current quarter. n.a.—Not published due to insufficient responses but included in totals for Texas and district. |
||||
Interest rates by loan type—first quarter 2024
| Feeder cattle | Other farm operating | Intermediate term | Long-term farm real estate | |
| Fixed (average rate, percent) | ||||
2023:Q1 | 8.57 | 8.56 | 8.44 | 8.08 |
2023:Q2 | 9.16 | 9.14 | 8.88 | 8.41 |
2023:Q3 | 9.26 | 9.22 | 8.98 | 8.66 |
2023:Q4 | 9.43 | 9.35 | 9.23 | 8.76 |
2024:Q1 | 9.31 | 9.32 | 9.07 | 8.69 |
| Variable (average rate, percent) | ||||
2023:Q1 | 8.79 | 8.75 | 8.57 | 8.21 |
2023:Q2 | 9.28 | 9.31 | 9.00 | 8.59 |
2023:Q3 | 9.39 | 9.38 | 9.09 | 8.83 |
2023:Q4 | 9.53 | 9.48 | 9.32 | 8.89 |
2024:Q1 | 9.51 | 9.49 | 9.27 | 8.88 |
For More Information
Questions regarding the Agricultural Survey can be addressed to Mariam Yousuf at Mariam.Yousuf@dal.frb.org.