Dallas Fed Energy Survey

First Quarter | March 27, 2019
Oil and Gas Activity Grows Modestly as Oil Price Jumps
What's New This Quarter
The survey now includes a new index that gauges operating margins for oilfield service firms.
Special questions this quarter include an annual update to our data on breakeven prices by basin, and expected changes in employee head counts for 2019.
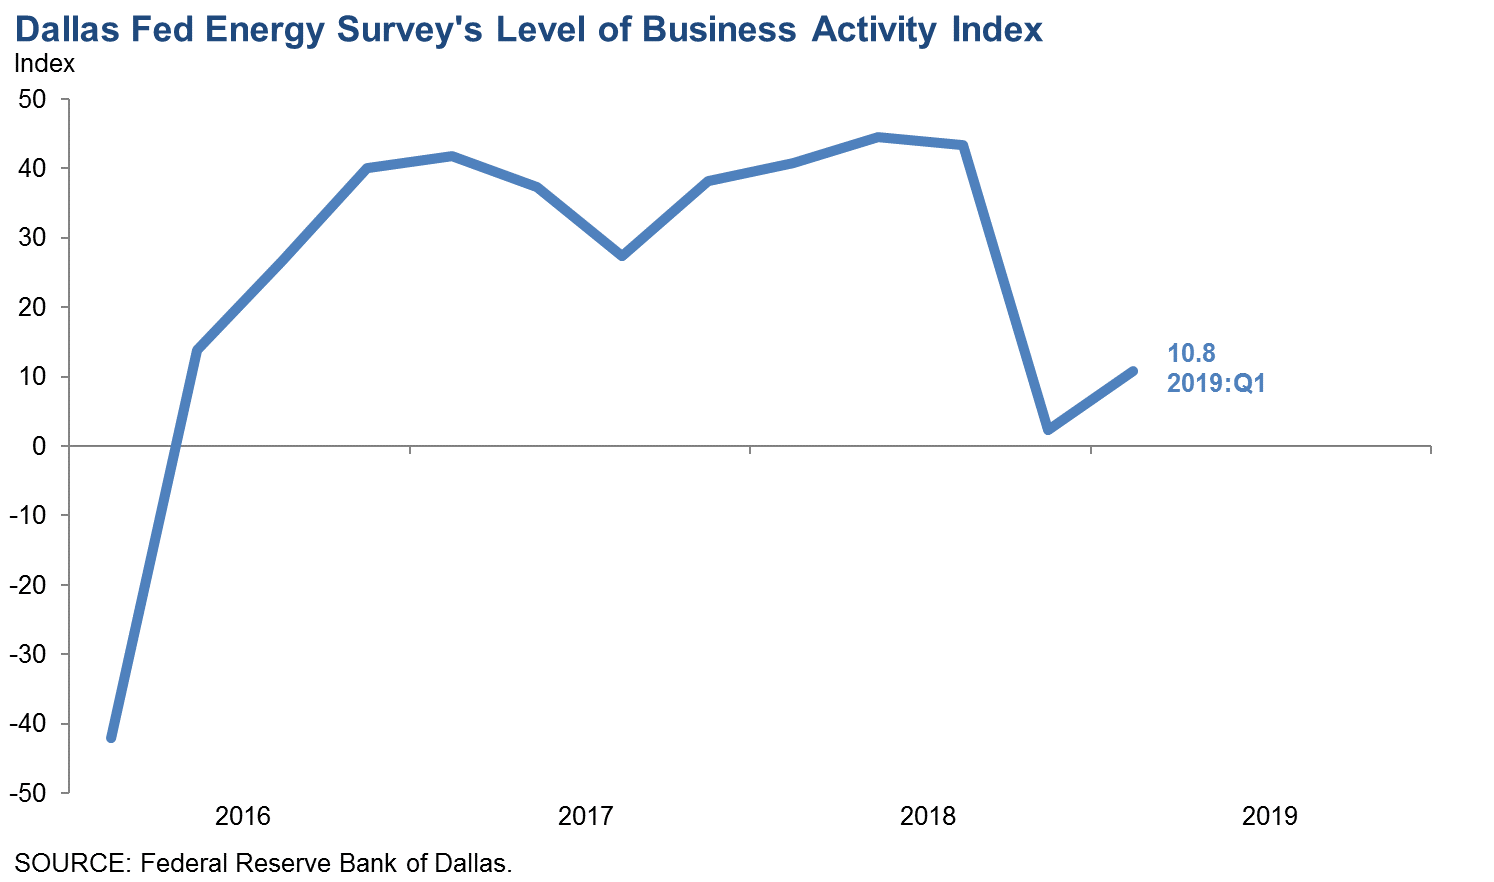
Energy sector activity grew modestly in first quarter 2019, according to oil and gas executives responding to the Dallas Fed Energy Survey. The business activity index—the survey’s broadest measure of conditions facing Eleventh District energy firms—came in at 10.8 in the first quarter, up from 2.3 in the fourth quarter but well below the average level seen over the past few years. Oilfield services firms drove much of the increase, with their business activity index jumping from 0.0 to 16.1.
Positive readings in the survey generally indicate expansion, while readings below zero suggest contraction.
Oil and gas production increased for the 10th consecutive quarter, according to E&P executives. However, the oil production index fell from 29.1 in the fourth quarter to 21.1 in the first quarter, indicating a slower rate of growth. The natural gas production index also slipped, from 24.8 to 16.7.
Among oilfield services firms, the index for utilization of equipment jumped sharply to 16.4 in the first quarter, gaining 15 points. Input costs continued to increase but at a slower pace, with the index declining from 36.7 to 25.0. Meanwhile, the index of prices received dipped into negative territory to -1.7, suggesting a minor decline in oilfield services prices from last quarter. The index for operating margins, at -6.6, indicates narrowing margins for oilfield services firms during the first quarter relative to the fourth quarter.
Employment and employee hours continued growing but at a slower pace than last quarter. The aggregate employment index dropped to 6.0 from 13.8. The aggregate employee hours worked index also edged down, from 12.1 to 9.7. The index for aggregate wages and benefits came in at 23.5, down from last quarter but still indicative of strong growth in wages and benefits.
The company outlook index rebounded into positive territory this quarter, jumping 34 points to 23.3. While uncertainty continues to intensify, markedly fewer firms noted rising uncertainty this quarter than last, and the index fell 24 points to 18.6.
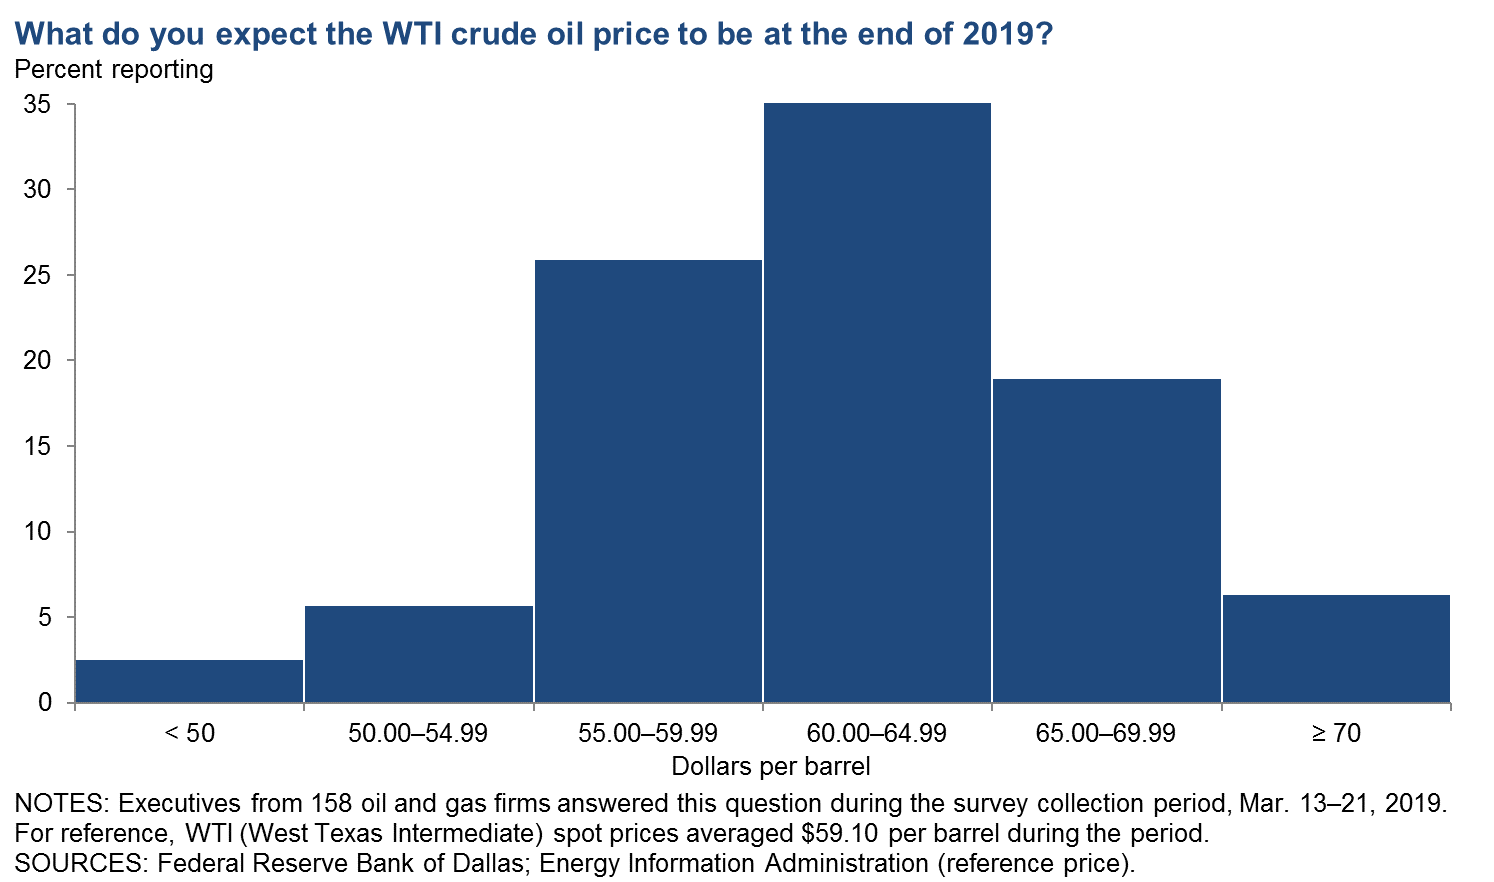
Expectations for West Texas Intermediate (WTI) oil prices at year-end 2019 are roughly in line with current prices, with respondents on average projecting $60.19 per barrel. That compares with the $59.10 average seen during the survey collection period. Responses ranged from $43 to $76.
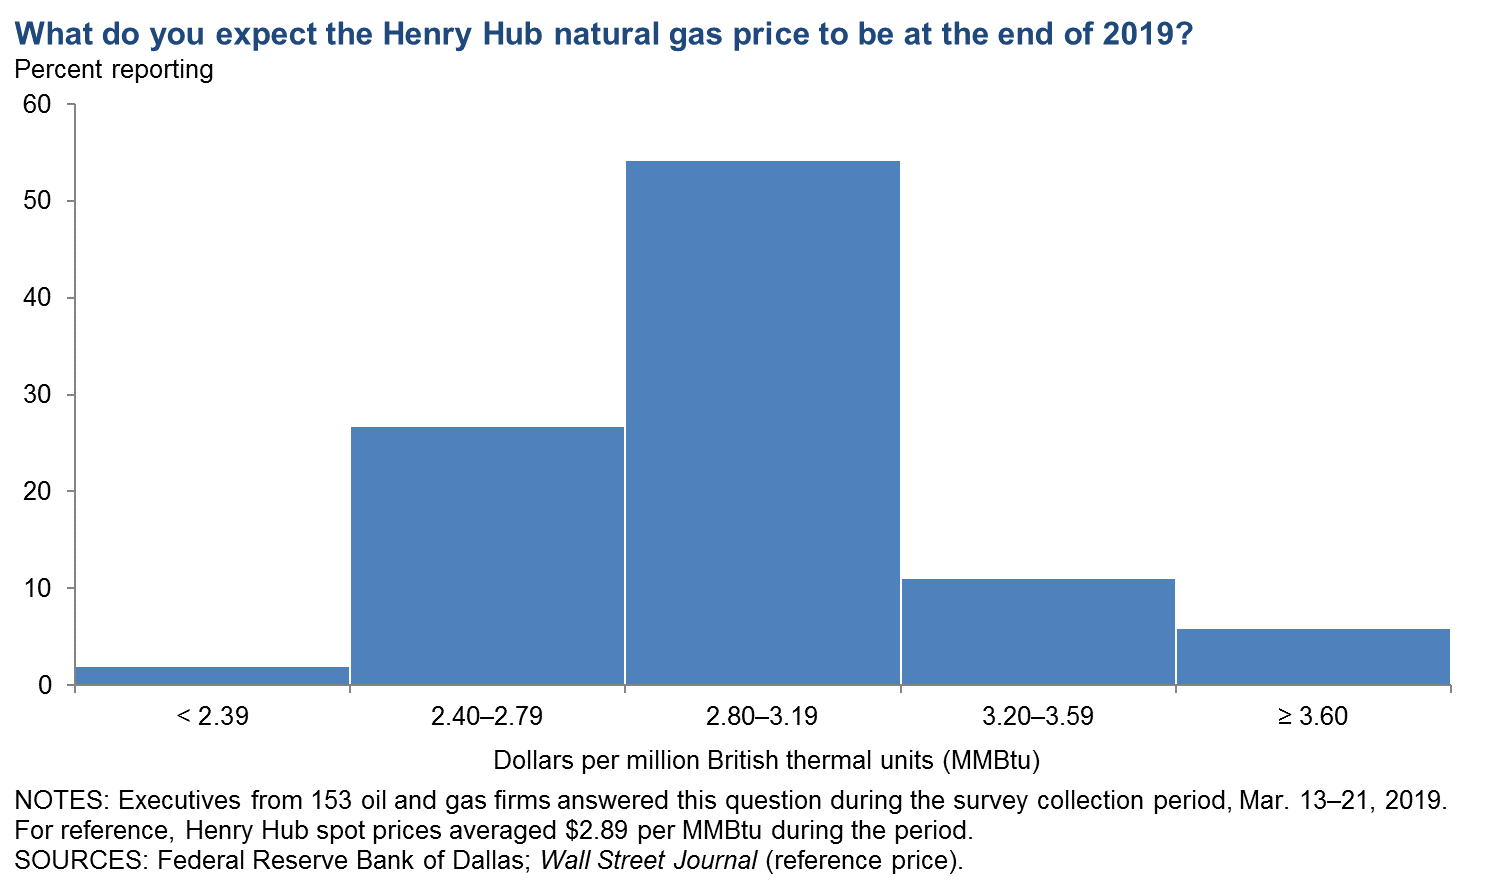
On average, respondents expect Henry Hub natural gas prices to be $2.96 per million British thermal units (MMBtu) at the end of 2019. Responses ranged from $2.15 to $5.00. For reference, Henry Hub spot prices averaged $2.89 per MMBtu during the survey collection period.
Next release: June 26, 2019
|
Data were collected March 13–21, and 166 energy firms responded to the survey. Of the respondents, 104 were exploration and production firms and 62 were oilfield services firms. The Dallas Fed conducts the Dallas Fed Energy Survey quarterly to obtain a timely assessment of energy activity among oil and gas firms located or headquartered in the Eleventh District. Firms are asked whether business activity, employment, capital expenditures and other indicators increased, decreased or remained unchanged compared with the prior quarter and with the same quarter a year ago. Survey responses are used to calculate an index for each indicator. Each index is calculated by subtracting the percentage of respondents reporting a decrease from the percentage reporting an increase. When the share of firms reporting an increase exceeds the share reporting a decrease, the index will be greater than zero, suggesting the indicator has increased over the previous quarter. If the share of firms reporting a decrease exceeds the share reporting an increase, the index will be below zero, suggesting the indicator has decreased over the previous quarter. |
First Quarter | March 27, 2019
Price Forecasts
West Texas Intermediate Crude
| West Texas Intermediate crude oil price (dollars per barrel), year-end 2019 | ||||
| Indicator | Survey Average | Low Forecast | High Forecast | Price During Survey |
Current quarter | $60.19 | $43.00 | $76.00 | $59.10 |
Prior quarter | $59.97 | $45.00 | $80.00 | $49.22 |
|
NOTE: Price during survey is an average of daily spot prices during the survey collection period. SOURCES: Energy Information Administration; Federal Reserve Bank of Dallas. | ||||
Henry Hub Natural Gas
| Henry Hub natural gas price (dollars per MMBtu), year-end 2019 | ||||
| Indicator | Survey Average | Low Forecast | High Forecast | Price During Survey |
Current quarter | $2.96 | $2.15 | $5.00 | $2.89 |
Prior quarter | $3.34 | $2.00 | $5.50 | $3.97 |
|
NOTE: Price during survey is an average of daily spot prices during the survey collection period. SOURCES: Federal Reserve Bank of Dallas; Wall Street Journal. | ||||
First Quarter | March 27, 2019
Special Questions
Data were collected March 13–21, and 160 oil and gas firms responded to the special questions survey.
Exploration and Production (E&P) Firms
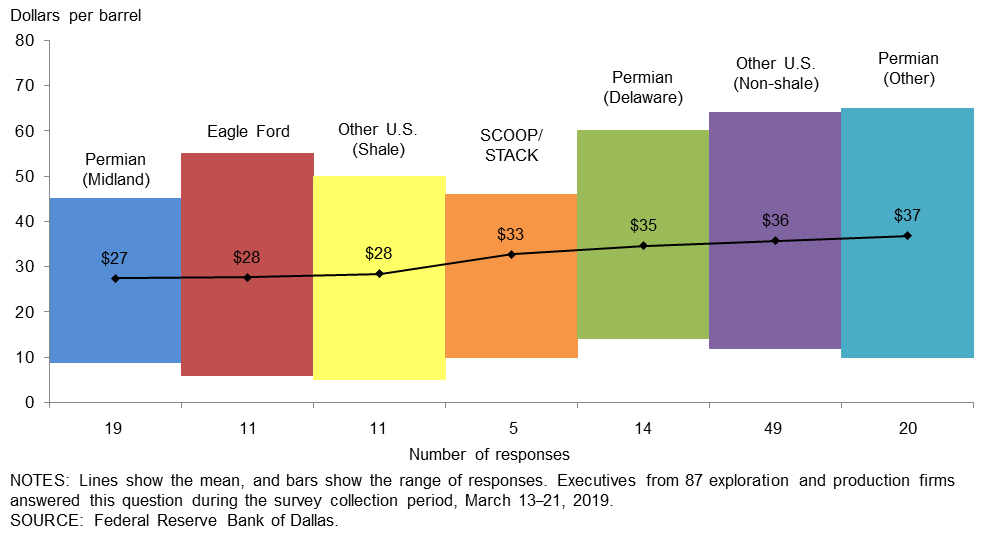
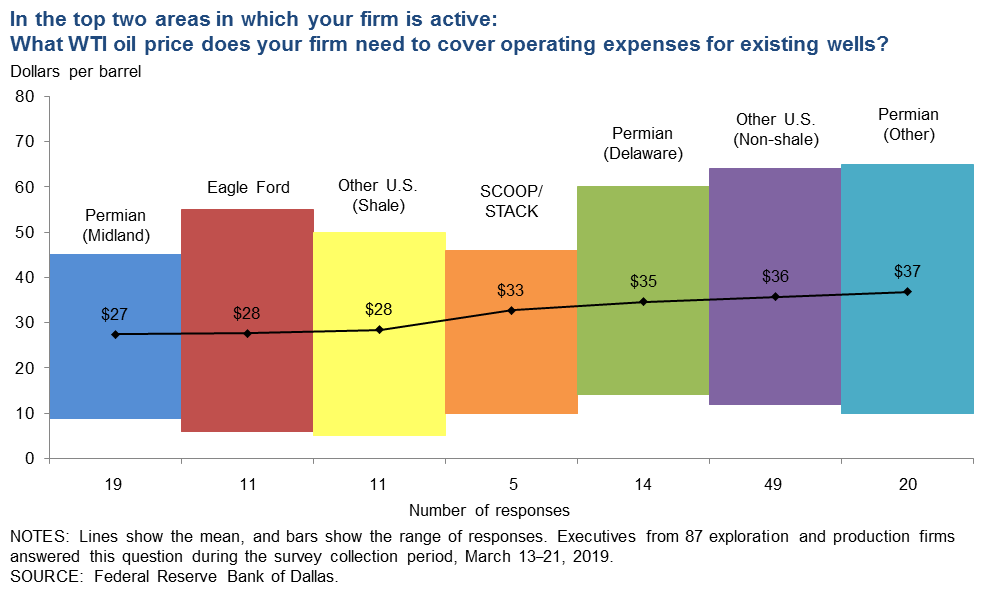
In the top two areas in which your firm is active: What West Texas Intermediate (WTI) oil price does your firm need to cover operating expenses for existing wells?
Average prices necessary to cover operating expenses across regions range from $27 to $37 per barrel. Almost all respondents can cover operating expenses for existing wells at current prices. Overall, operating expenses are slightly lower than those observed in last year’s first-quarter survey, with the average across the entire sample at approximately $33 per barrel, versus $35 per barrel last year.
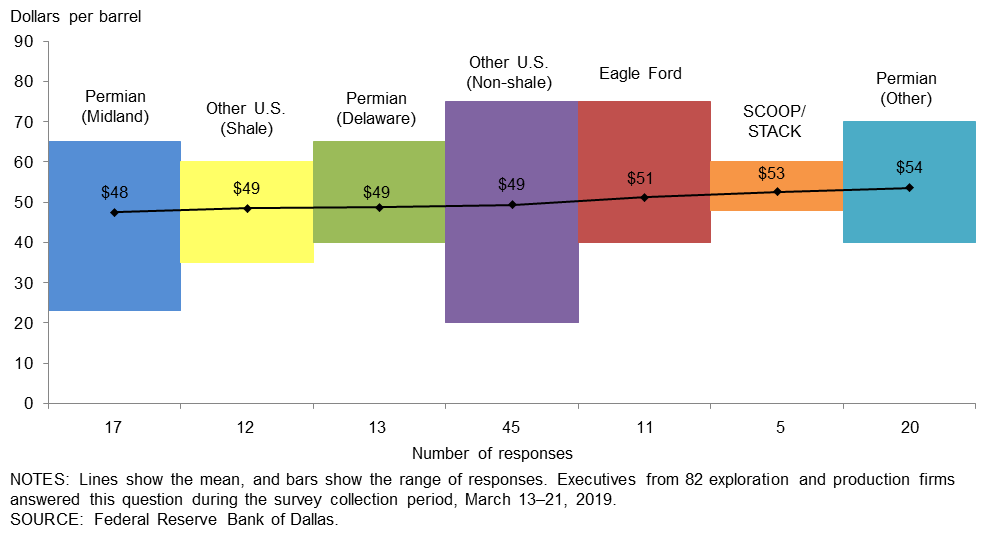
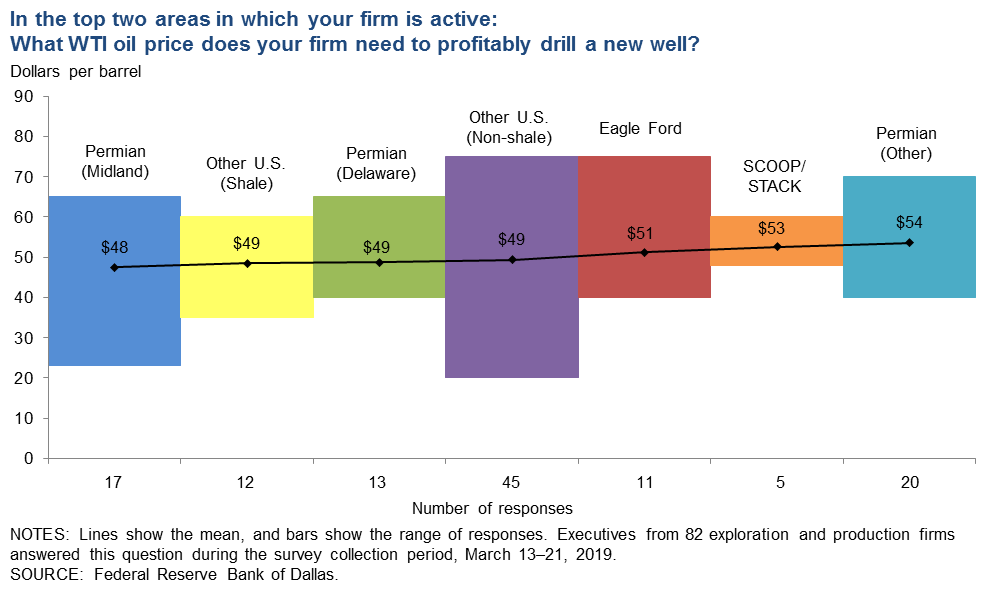
In the top two areas in which your firm is active: What WTI oil price does your firm need to profitably drill a new well?
Average breakeven prices to profitably drill a new well range from $48 to $54 per barrel, depending on the region. For the entire sample, firms need $50 per barrel on average to profitably drill, down from $52 per barrel when the same question was asked last year. Average breakeven prices in the Permian Basin are $50 per barrel, unchanged from last year. For the past three years, Permian (Midland) has been the lowest-cost region. With the recent recovery in oil prices, the majority of firms in the survey can profitably drill a new well at current prices; 78 percent of responses were at or below the March 22 WTI spot price ($59 per barrel).
All Firms
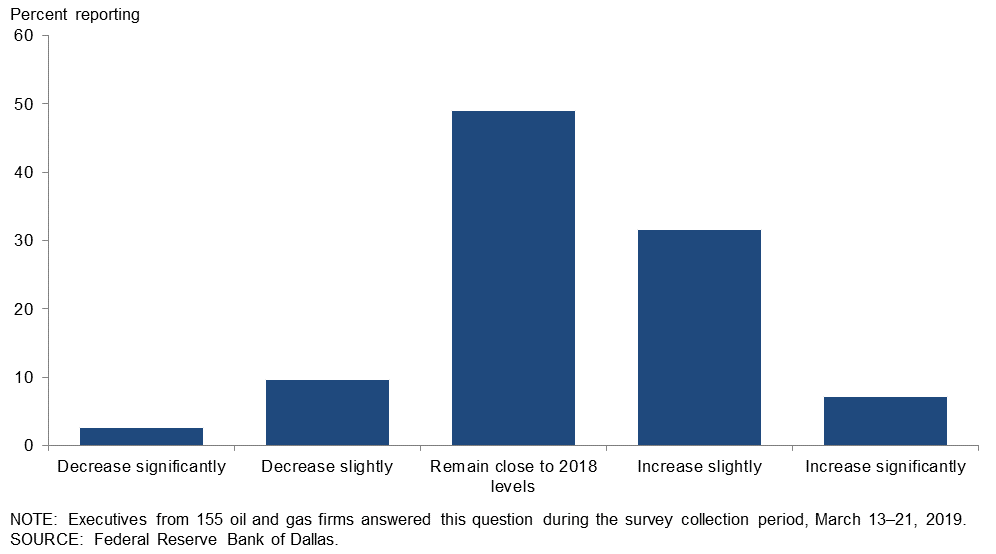
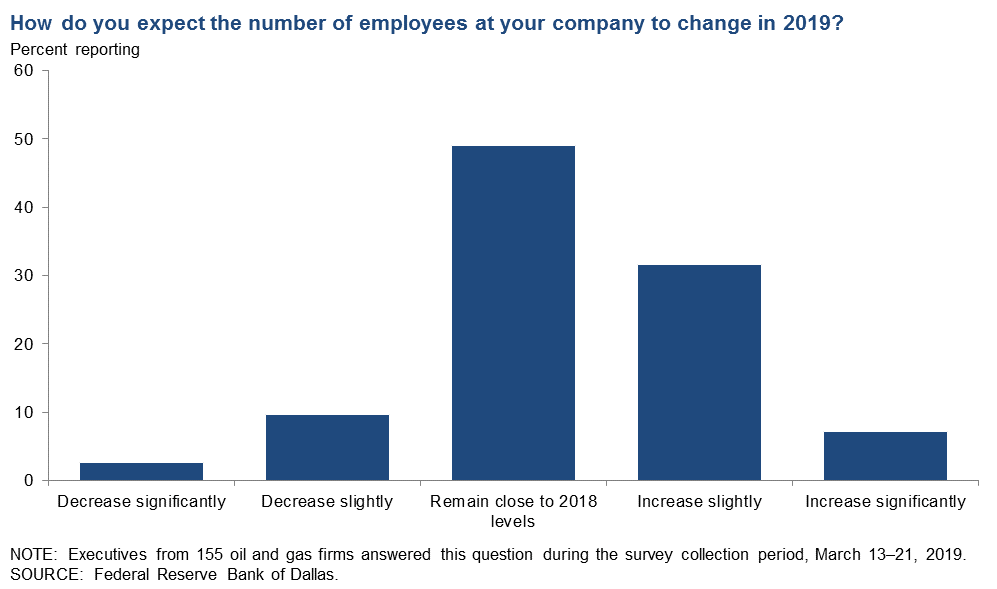
How do you expect the number of employees at your company to change in 2019?
Forty-nine percent of executives expect the number of employees to remain close to 2018 levels. Thirty-nine percent of executives expect the number of employees to increase from 2018 levels, of which 7 percent expect a significant increase and 32 percent expect a slight increase. Only 13 percent expect the number of employees to decrease in 2019.
A greater percentage of oil and gas support services firms expect to increase employment in 2019 when compared with E&P firms. Fifty-two percent of support services firms expect to increase the number of employees in 2019 versus 29 percent for E&P firms. (See table for more detail.)
| Response | Percent Reporting | ||
| All Firms | E&P | Services | |
| Decrease significantly | 3 | 4 | 0 |
| Decrease slightly | 10 | 10 | 10 |
| Remain close to 2018 levels | 49 | 56 | 38 |
| Increase slightly | 32 | 23 | 44 |
| Increase significantly | 7 | 6 | 8 |
| NOTES: Executives from 155 exploration and production (E&P) and oil and gas support services firms answered this question during the survey collection period, March 13–21, 2019. The “All firms” column reports the percentages out of the total responses, whereas the other columns report the percentages from the 94 E&P and 61 services firms that responded. Percentages may not sum to 100 due to rounding SOURCE: Federal Reserve Bank of Dallas. | |||
Special Questions Comments
Exploration and Production Firms
- We expect a consolidation party for both smaller independents and service companies. Companies that can generate free cash flow will win. Profitable production is the name of the game.
- We went from eight operating areas to one, thus the reduction in staff. We are now right-sized for the scale of our operation.
- The problem has been the discount to WTI for our barrels sold. For the Permian area, it’s been a $7 to $12 per barrel discount, so a WTI barrel priced at $58 nets us between $46 and $51 per barrel.
- I am hearing that natural gas gathering and pipeline companies are, and will continue, to aggressively move their costs into a gathering/processing fee basis. We have already seen this happening with our midstream provider whereby their fees are now more than 40 percent of our gross revenues, and more fees are said to be coming, thus depressing our net economics further. Posted Henry Hub and WTI (NYMEX) prices fail to tell the whole story.
- We have given up on drilling new conventional wells purely for natural gas, owing to prolonged low prices. We will drill “gas” wells if there is an expectation of significant liquids along with the gas.
Oil and Gas Support Services Firms
- Most growth is in the Permian Basin and will continue to be for the near future. However, the northeast Eagle Ford remains steady.
- With no improvement on revenue expected, there is little reason for us to add staff.
- Our company is currently in expansion mode for 2019.
Additional Comments »
First Quarter | March 27, 2019
Historical data are available from first quarter 2016 to the most current release quarter.
Business Indicators: Quarter/Quarter
| Business Indicators: All Firms Current Quarter (versus previous quarter) | |||||
| Indicator | Current Index | Previous Index | % Reporting Increase | % Reporting No Change | % Reporting Decrease |
Level of Business Activity | 10.8 | 2.3 | 31.9 | 47.0 | 21.1 |
Capital Expenditures | 6.7 | 8.9 | 29.3 | 48.2 | 22.6 |
Supplier Delivery Time | –0.6 | –3.7 | 5.5 | 88.4 | 6.1 |
Employment | 6.0 | 13.8 | 21.1 | 63.9 | 15.1 |
Employee Hours | 9.7 | 12.1 | 20.7 | 68.3 | 11.0 |
Wages and Benefits | 23.5 | 32.9 | 30.1 | 63.3 | 6.6 |
| Indicator | Current Index | Previous Index | % Reporting Improved | % Reporting No Change | % Reporting Worsened |
Company Outlook | 23.3 | –10.2 | 35.2 | 52.8 | 11.9 |
| Indicator | Current Index | Previous Index | % Reporting Increase | % Reporting No Change | % Reporting Decrease |
Uncertainty | 18.6 | 42.4 | 31.9 | 54.8 | 13.3 |
| Business Indicators: E&P Firms Current Quarter (versus previous quarter) | |||||
| Indicator | Current Index | Previous Index | % Reporting Increase | % Reporting No Change | % Reporting Decrease |
Level of Business Activity | 7.7 | 3.9 | 27.9 | 51.9 | 20.2 |
Oil Production | 21.1 | 29.1 | 42.3 | 36.5 | 21.2 |
Natural Gas Wellhead Production | 16.7 | 24.8 | 34.3 | 48.0 | 17.6 |
Capital Expenditures | 5.0 | 7.7 | 27.5 | 50.0 | 22.5 |
Expected Level of Capital Expenditures Next Year | 16.3 | 7.9 | 36.5 | 43.3 | 20.2 |
Supplier Delivery Time | –1.9 | –5.9 | 2.9 | 92.3 | 4.8 |
Employment | 1.0 | 11.5 | 15.4 | 70.2 | 14.4 |
Employee Hours | 5.8 | 7.7 | 15.5 | 74.8 | 9.7 |
Wages and Benefits | 23.1 | 32.6 | 29.8 | 63.5 | 6.7 |
Finding and Development Costs | –1.9 | 6.7 | 14.4 | 69.2 | 16.3 |
Lease Operating Expenses | 2.8 | 9.8 | 16.3 | 70.2 | 13.5 |
| Indicator | Current Index | Previous Index | % Reporting Improved | % Reporting No Change | % Reporting Worsened |
Company Outlook | 24.0 | –6.0 | 34.0 | 56.0 | 10.0 |
| Indicator | Current Index | Previous Index | % Reporting Increase | % Reporting No Change | % Reporting Decrease |
Uncertainty | 17.3 | 48.5 | 28.8 | 59.6 | 11.5 |
| Business Indicators: O&G Support Services Firms Current Quarter (versus previous quarter) | |||||
| Indicator | Current Index | Previous Index | % Reporting Increase | % Reporting No Change | % Reporting Decrease |
Level of Business Activity | 16.1 | 0.0 | 38.7 | 38.7 | 22.6 |
Utilization of Equipment | 16.4 | 1.6 | 34.4 | 47.5 | 18.0 |
Capital Expenditures | 9.7 | 11.1 | 32.3 | 45.2 | 22.6 |
Supplier Delivery Time | 1.7 | 0.0 | 10.0 | 81.7 | 8.3 |
Lag Time in Delivery of Firm's Services | 3.4 | –3.4 | 11.7 | 80.0 | 8.3 |
Employment | 14.5 | 17.5 | 30.6 | 53.2 | 16.1 |
Employment Hours | 16.4 | 19.4 | 29.5 | 57.4 | 13.1 |
Wages and Benefits | 24.1 | 33.3 | 30.6 | 62.9 | 6.5 |
Input Costs | 25.0 | 36.7 | 30.0 | 65.0 | 5.0 |
Prices Received for Services | –1.7 | 0.0 | 15.0 | 68.3 | 16.7 |
Operating Margin | –6.6 | #N/A | 16.4 | 60.7 | 23.0 |
| Indicator | Current Index | Previous Index | % Reporting Improved | % Reporting No Change | % Reporting Worsened |
Company Outlook | 22.0 | –17.2 | 37.3 | 47.5 | 15.3 |
| Indicator | Current Index | Previous Index | % Reporting Increase | % Reporting No Change | % Reporting Decrease |
Uncertainty | 21.0 | 32.3 | 37.1 | 46.8 | 16.1 |
Business Indicators: Year/Year
| Business Indicators: All Firms Current Quarter (versus same quarter a year ago) | |||||
| Indicator | Current Index | Previous Index | % Reporting Increase | % Reporting No Change | % Reporting Decrease |
Level of Business Activity | 30.5 | 38.2 | 53.9 | 22.7 | 23.4 |
Capital Expenditures | 20.7 | 37.9 | 43.9 | 32.9 | 23.2 |
Supplier Delivery Time | 1.3 | 4.6 | 11.2 | 78.9 | 9.9 |
Employment | 19.7 | 24.5 | 37.3 | 45.1 | 17.6 |
Employee Hours | 23.4 | 24.4 | 33.1 | 57.1 | 9.7 |
Wages and Benefits | 39.0 | 55.8 | 46.8 | 45.5 | 7.8 |
| Indicator | Current Index | Previous Index | % Reporting Improved | % Reporting No Change | % Reporting Worsened |
Company Outlook | 28.3 | 21.0 | 47.6 | 33.1 | 19.3 |
| Business Indicators: E&P Firms Current Quarter (versus same quarter a year ago) | |||||
| Indicator | Current Index | Previous Index | % Reporting Increase | % Reporting No Change | % Reporting Decrease |
Level of Business Activity | 26.8 | 34.0 | 51.5 | 23.7 | 24.7 |
Oil Production | 39.2 | 42.1 | 60.8 | 17.5 | 21.6 |
Natural Gas Wellhead Production | 34.4 | 33.7 | 50.0 | 34.4 | 15.6 |
Capital Expenditures | 15.3 | 35.1 | 41.8 | 31.6 | 26.5 |
Expected Level of Capital Expenditures Next Year | 9.6 | 17.9 | 36.2 | 37.2 | 26.6 |
Supplier Delivery Time | 1.0 | 0.0 | 9.2 | 82.7 | 8.2 |
Employment | 6.2 | 15.8 | 28.1 | 50.0 | 21.9 |
Employee Hours | 13.3 | 12.4 | 24.5 | 64.3 | 11.2 |
Wages and Benefits | 32.7 | 58.4 | 42.9 | 46.9 | 10.2 |
Finding and Development Costs | 3.0 | 19.8 | 22.4 | 58.2 | 19.4 |
Lease Operating Expenses | 12.4 | 28.7 | 29.9 | 52.6 | 17.5 |
| Indicator | Current Index | Previous Index | % Reporting Improved | % Reporting No Change | % Reporting Worsened |
Company Outlook | 22.9 | 16.0 | 44.6 | 33.7 | 21.7 |
| Business Indicators: O&G Support Services Firms Current Quarter (versus same quarter a year ago) | |||||
| Indicator | Current Index | Previous Index | % Reporting Increase | % Reporting No Change | % Reporting Decrease |
Level of Business Activity | 36.8 | 45.0 | 57.9 | 21.1 | 21.1 |
Utilization of Equipment | 32.7 | 40.6 | 52.7 | 27.3 | 20.0 |
Capital Expenditures | 29.9 | 42.3 | 47.4 | 35.1 | 17.5 |
Supplier Delivery Time | 1.8 | 12.1 | 14.8 | 72.2 | 13.0 |
Lag Time in Delivery of Firm's Services | 7.3 | 9.0 | 16.4 | 74.5 | 9.1 |
Employment | 42.1 | 38.3 | 52.6 | 36.8 | 10.5 |
Employment Hours | 41.1 | 44.0 | 48.2 | 44.6 | 7.1 |
Wages and Benefits | 50.0 | 51.7 | 53.6 | 42.9 | 3.6 |
Input Costs | 40.0 | 48.3 | 45.5 | 49.1 | 5.5 |
Prices Received for Services | 21.8 | 34.5 | 34.5 | 52.7 | 12.7 |
Operating Margin | 17.0 | #N/A | 34.0 | 49.1 | 17.0 |
| Indicator | Current Index | Previous Index | % Reporting Improved | % Reporting No Change | % Reporting Worsened |
Company Outlook | 37.7 | 30.6 | 52.8 | 32.1 | 15.1 |
First Quarter | March 27, 2019
Activity Chart
First Quarter | March 27, 2019
Comments from Survey Respondents
These comments are from respondents’ completed surveys and have been edited for publication. Comments from the Special Questions survey can be found below the special questions.
Exploration and Production Firms
- This is a cycle in our industry where only the large well-capitalized companies can grow. Small companies without access to capital are stagnant, which will bleed over into the service sector. Oil prices above $60 per barrel and natural gas prices above $3 per million British thermal units are needed to start moderate growth. It is a major industry readjustment period.
- Our investors and we are discouraged by monetary loses in public equities (stock prices) and high-yield debt instruments (junk bonds) issued by small to medium-sized oil and gas companies. This shrinkage in market capitalization of some companies is breathtaking. These loses translate into a loss of interest in further direct investments in the drilling of new oil and/or natural gas prospects.
- Early adopters of the New Green Deal are going to be sorely disappointed when they find that their actions actually increase the cost of energy and, thereby, negatively impact the standard of living around the world. Real problems require real solutions, not trite conversations that tickle the ears of the naive.
- The capital markets aren't supporting acquisition of proved undeveloped reserves or proved developed non-producing reserves; only proved developed producing reserves. There is a slowdown of acquisition and divestiture (A&D) and development.
- The idiocy of having coal pushed as a significant long-term energy source in the U.S. needs to be changed, especially given that natural gas is abundant and significantly better environmentally. The administration’s focus on coal is a very misguided “political” payoff and should be changed.
- In our firm’s U.S. E&P universe, companies issued $2.4 billion in common equity for 2018, compared to the roughly $9.5 billion in 2017: a 75 percent decrease. First quarter 2019 A&D showed the market is stalling on the heels of bad capital market conditions. Public companies left the marketplace as an exit option for private assets, and the first quarter of 2019 has experienced roughly $3.5 billion of A&D activity so far, compared to $22.3 billion and $25.1 billion for the same quarter in 2018 and 2017, respectively.
- Pipeline constraints in the Permian Basin continue to cost us up to $20 per barrel and have a significant impact on capital expenditures. This cost changes month by month, making revenue estimation difficult.
- Qualified young professionals are avoiding joining the oil and gas industry.
- It will be interesting to see if producer discipline holds and the mantra of free cash flow persists, if prices start to rise.
- Price differentials are hurting us. (Wouldn't this be a good time to bring pro-rationing back?) We're still finding ways to cut costs and defer expenditures. We have several opportunities to expand current projects, but with a huge oil and gas price differential currently, it makes no sense to try. The big shale drillers have messed up the equation for everyone. (Wouldn't this be a good time to bring back pro-rationing? Or have I already mentioned that?)
- We are buying vertical wells from major independents for recompletion activity to improve production. We are seeing windows of opportunity opening in that venue. Vertical drilling prospects are dead. Leases are covered by horizontal plays in good areas. Smaller independents are competing with a different animal that is too expensive to tame. Deep pockets for manufacturing oil and gas have taken over the patch here.
- We see West Texas Intermediate (WTI) on the New York Mercantile Exchange (NYMEX) moving between $55 and $65 per barrel over the next three to 18 months, or through 2019 and most of 2020.
- We expect more price stability in 2019 than 2018 given OPEC’s commitment to lower production.
- Volatility of commodity prices and divergence in operator results (operational or corporate) are being more closely monitored.
- It should be an interesting year on the mergers-and-acquisitions front in the exploration and production (E&P) space.
- Supply and demand seems to be moving to a reasonable, but artificial, price balance with the production reductions imposed by OPEC and the situation in Venezuela. That balance is as reliably predictable as continuation of the current production accord within OPEC. In essence, we believe there will continue to be considerable potential for continuing volatility in the crude market going forward as a permanent component of the crude market.
- Pipeline capacity in the Permian will improve in coming months, dumping more oil on the markets. However if the current administration stays in office, the economy will continue to grow and consume the excess oil. If the administration is not reelected, the economy will slow (bogged down by excess tax and regulations) and an oversupply of oil will drive prices down. My bet is that the administration will be reelected, and we'll see continued strong economic conditions throughout the second term and possibly beyond 2024. The 2020 election will determine a lot in our industry.
Oil and Gas Support Services Firms
- Skilled labor for all positions, especially commercially licensed drivers, is in great demand. It’s increasingly harder to find qualified and available help.
- The fourth quarter of 2018 eroded confidence, but that is slowly returning despite threats of an ongoing trade war, Trumponomics and the slowing Western economies.
- Our customers are increasingly focused on cash flow, and clearly, the rush to add production is over. Oil and gas companies are delaying spending decisions as late as possible.
- The “anticarbon” movement concerns me. The leaders of the movement simply do not understand how we do business. If a left-wing Congress and president win, which eventually will happen, what will happen to our business? Colorado serves as an example.
- We are seeing an overall increase in activity from customers. It’s not tremendous but certainly noticeable. To me, this demonstrates an increased confidence in the economy.
- We have the same clients, but they’re coming a little slower with payments and assignments. Hopefully, this is only temporary.
Questions regarding the Dallas Fed Energy Survey can be addressed to Michael Plante at Michael.Plante@dal.frb.org or Kunal Patel at Kunal.Patel@dal.frb.org.
Sign up for our email alert to be automatically notified as soon as the latest Dallas Fed Energy Survey is released on the web.